Starch and fibre intake and glucose postprandial response of dogs
Consumo de amido e fibra e a resposta pós-prandial de glicose de cães
Mariana MontiI Guilherme Roberto PalumboI Mariana Vieira de Paula PintoI Thaila Cristina PutarovI Bruna Agy LoureiroI Márcia de Oliveira Sampaio GomesII
Gener Tadeu PereiraI Aulus Cavalieri CarciofiI* ISSN 0103-8478
ABSTRACT
Fibre has been studied to reduce the postprandial glucose response of dogs, but the results are inconsistent. Starch intake, however, was not properly considered in the published studies. The effects of starch and fibre intake on the postprandial glucose response were studied in non-obese adult dogs. Cellulose (CEL), carboxymethylcellulose (CMC), pea fibre (PE) and sugarcane fibre (SCF) were combined to form six diets with starch contents ranging from 33% to 42%: SCF+CEL and PE+CEL diets, both with high insoluble fibre (IF=22%) and low soluble fibre (SF=2.5%) content; SCF+CMC and PE+CMC diets with high SF (SF=4.5%; IF=19%) content; and CMC and CEL diets with low dietary fibre (14%) content. The diets were fed in two amounts, providing an intake of 9.5g or 12.5g of starch (kg0.75)-1 day-1, totaling 12 treatments. Each diet was fed to six dogs conditioned to consume all of the daily food in 10min. Their plasma glucose levels were measured before and during 480min after food intake. Results of fibre and starch intake and their interactions were compared by repeated measures ANOVA and the Tukey test (P<0.05). Fibre intake did not change the glucose postprandial responses (P>0.05). High-dose starch intake, however, induced a higher glycaemia at 180 and 240min after the meal and a greater maximal glycaemia and greater area under the glucose curve (P<0.05). A range in insoluble and soluble fibre intake does not change postprandial glucose response, and the amount of starch intake is a main factor for the postprandial glucose response of healthy non-obese dogs.
Key words: dietary fibre, glycaemia, metabolic response, metabolisable energy.
RESUMO
Fibras têm sido estudadas como opção para reduzir a resposta glicêmica pós-prandial de cães, mas os resultados obtidos têm sido inconsistentes. A ingestão de amido, no entanto, não tem sido adequadamente considerada na interpretação dos resultados
de algumas dessas pesquisas. O presente estudo investigou, em cães adultos não obesos, os efeitos da ingestão de amido e fibra sobre a resposta pós-prandial. Celulose (CEL), carboximetilcelulose (CMC), fibra de ervilha (PE) e fibra de cana-de-açúcar (SCF) foram combinadas, gerando seis dietas com 33% a 42% de amido: dietas SCF+CEL e PE+CEL com alta fibra insolúvel (IF=22%) e baixa fibra solúvel (SF=2,5%); dietas SCF+CMC e PE+CMC com alta fibra solúvel (SF=4,5%; IF=19%); dietas CMC e CEL como controles baixa fibra (14%). As dietas foram fornecidas aos cães em duas quantidades, resultando na ingestão de 9,5g ou 12,5g de amido (kg0,75)-1 dia-1, gerando um total de 12 tratamentos. Cada tratamento foi fornecido a seis cães, condicionados a ingerir todo o alimento do dia num período de 10min. A glicose plasmática foi medida em jejum e durante 480min após a refeição. Os resultados foram analisados por análise de variância de medidas repetidas, considerando-se os feitos da ingestão de amido e fibra, e suas interações, sendo as médias comparadas pelo teste de Tukey (P<0,05). A ingestão de fibra não alterou a resposta pós-prandial de glicose (P>0,05). O consumo da dose elevada de amido, no entanto, resultou em maiores glicemias aos 180 e 240min, maior glicemia máxima e maior área abaixo da curva de glicose (P<0,05). Verificou-se que a quantidade ingerida de amido é mais importante que o consumo de fibra para a resposta glicêmica pós-prandial de cães não obesos.
Palavras-chave: energia metabolizável, fibra alimentar, glicemia, respostas metabólicas.
INTRODUCTION
In response to the increase in canine health problems related to glucose intolerance (e.g., obesity and diabetes mellitus), there is an interest in investigating diets that favour glycaemic control
IFaculdade de Ciências Agrárias e Veterinárias (FCAV), Universidade Estadual Paulista (UNESP), Via de Acesso Prof. Paulo Donato
Castellane, s/n, 14884-900, Jaboticabal, SP, Brasil. E-mail: [email protected]. *Corresponding author. IIFaculdade de Medicina Veterinária e Zootecnia (FMVZ), Universidade de São Paulo (USP), São Paulo, SP, Brasil.
(CARCIOFI et al., 2008). Studying the glucose and insulin responses to a meal relies on evaluating carbohydrate metabolism: as faster and more complete the digestion and absorption of starch is, the greater the postprandial responses of humans (WOLEVER & BOLOGNESI, 1996) and dogs (CARCIOFI et al., 2008) are. Other dietary factors
also influence the postprandial glycaemic responses
and depend on an integrated evaluation of the diet, including starch-intrinsic factors such as digestion rates (CARCIOFI et al., 2008) and amylose-to-amylopectin ratios (BILIADERIS, 1991) as
well as extrinsic influences, such as the ingested
amount, the extent of food processing and diet composition (HEATON et al., 1988; WOLEVER & BOLOGNESI, 1996; NGUYEN et al., 1998).
Regarding diet composition, increasing
the dietary fibre content has been explored for dogs
and cats as a nutritional tool to reduce postprandial glucose responses, but not always showing
significant results (MASSIMINO et al., 1998;
FISCHER et al., 2012). In several of these studies,
fibre was added to the diet replacing the starch
sources, attempting to control the amounts of protein and fat in the experimental foods. Nevertheless, this
substitution of starch by fibre in the experimental
design induced the ingestion of different amounts of starch because the diets were given to dogs based on DM or metabolisable energy intake, and their starch intake was not always kept constant between treatments. In one study (HOENIG et al., 2001) the
effects of different sources of fibre were evaluated
using dogs, including guar gum (high solubility and fermentability), beet pulp (moderate solubility and fermentability), and cellulose (low solubility and fermentability), and the different sources were included in diets in low, moderate, and high amounts.
The authors concluded that high fibre diets did not
affect glucose tolerance, but no reference was made to the starch content of these diets. Another study (NGUYEN et al., 1994) evaluated the effect of the meal composition on the postprandial glycaemic and insulinemic responses of dogs but also did not report the amount of starch intake during the evaluation.
For humans, it is well know that the amount of starch eaten is one of the main predictors of the glucose response to the meal (WOLEVER & BOLOGNESI, 1996), but unfortunately, the starch intake in experiments using dogs has not been described
or controlled sufficiently to allow an understanding of its influence. Considering this, using diets with different starch and fibre inclusion amounts and different fibre
types the present study evaluated the effect of the
intakes of starch and fibre on the postprandial glycaemic
response of non-obese adult dogs.
EXPERIMENTAL METHODS
Animals, diets and experimental design
The study was conducted in the Laboratory of Research on Nutrition and Nutritional Diseases of Dogs and Cats of the UNESP, Jaboticabal, Brasil.
The experiment was conducted using six adult clinically healthy beagle dogs, with an average body weight of 11.3±0.5kg, a mean age of 3.3±0.2 years, and a mean body condition score of 5.0±0.2 on a nine-point scale (LAFLAMME, 1997). The dogs were housed in pairs in 1.5x4.0m kennels with a solarium and were randomly allotted to the experimental treatments. The dogs were exercised daily in a 200m2 grassy area.
The dietary treatments included the
following four fibre sources: an insoluble non-fermentable purified source - purified cellulose
(CEL; ARBOCEL BWW 40C, J. Rettenmaier Latino Americana Ltda, Diadema, SP, Brasil); a soluble,
highly viscous and non-fermentable purified source
- carboxymethylcellulose (CMC; CEKOL 700, CPKelco, Limeira, SP, Brasil); an insoluble natural
source - pea fibre (PE; Dilumix, Leme, SP, Brasil); an
insoluble and long-length natural source - sugarcane
fibre (SCF; Vit2be Fiber, Dilumix, Leme, SP, Brasil). These fibres were included in complete kibbled diets
balanced for dog maintenance (FEDIAF, 2008).
Combining these four fibre sources, six diets were formulated. Two diets presented high insoluble fibre (22%) and low soluble fibre (2.5%) content, being
one formulated with SCF (12% of inclusion, as-fed basis) and CEL (2.2%), and the other with PE (12.8%) and CEL (2.2%). Two diets presented high
soluble (4.5%) and moderate insoluble fibre (19%),
one including SCF (12%) and CMC (2.8%), and the other PE (12.8%) and CMC (2.8%). Two diets was
used as control, lower fibre diets, one including CMC
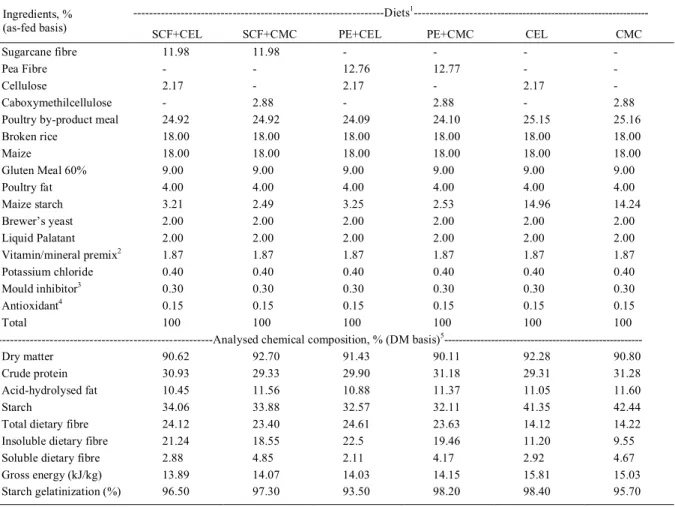
(2.8%) and the other CEL (2.2%). The formulation and chemical composition of the experimental diets are presented on table 1. The four diets supplemented
with fibre (SCF+CEL, PE+CEL, SCF+CMC, and PE+CMC) showed similar nutrient and total dietary fibre contents, varying only on the proportion soluble: insoluble fibre. The other two diets (CMC and CEL) had the same protein and fat, but less dietary fibre and
more starch, as they were used as controls.
ingredients were mixed and ground using a hammer
mill (Model 4, D’Andrea, Limeira, Brasil) fitted with
a 0.8-mm screen sieve. Diets were extruded under identical processing conditions using a single-screw extruder (Mab 400S, Extrucenter, Monte Alto, Brasil) with an average extrusion capacity of 150kg h-1. A laboratory-scale complete extrusion system was used, which has the same components and standards of operation as the extruders used for commercial production. The manufacturing process was controlled by adjusting the kibble density to between 390 and 410g L-1 (as-is basis) every 20min to ensure consistent cooking and kibble quality (size and expansion). The extruder pre-conditioning temperature was maintained above 90°C. The water and steam additions, screw
speed and food flux were adjusted according to the
dietary formulations, and the extrusion temperature varied between 125 and 135°C. Degree of starch gelatinisation was adequate in all of the diets, with values of greater than 90% (SA et al., 2013).
Foods were analyzed for DM by oven-drying the sample (method 934.01) and conversion to
ash by muffle furnace incineration (method 942.05).
Crude protein (CP) was analyzed by the Kjeldahl method (method 954.01), and acid hydrolyzed fat was assessed using a Soxhlet apparatus (method 954.02)
according to the Association of Official Analytical
Chemists (AOAC, 1995). Organic matter (OM) was
calculated as DM-ash. Dietary fibre (total, soluble,
and insoluble) was measured by using a combination
Table 1 - Ingredient and chemical composition of the experimental diets.
---Diets1
---Ingredients, %
(as-fed basis) SCF+CEL SCF+CMC PE+CEL PE+CMC
CEL CMC
Sugarcane fibre 11.98 11.98 - - -
-Pea Fibre - - 12.76 12.77 -
-Cellulose 2.17 - 2.17 - 2.17
-Caboxymethilcellulose - 2.88 - 2.88 - 2.88
Poultry by-product meal 24.92 24.92 24.09 24.10 25.15 25.16
Broken rice 18.00 18.00 18.00 18.00 18.00 18.00
Maize 18.00 18.00 18.00 18.00 18.00 18.00
Gluten Meal 60% 9.00 9.00 9.00 9.00 9.00 9.00
Poultry fat 4.00 4.00 4.00 4.00 4.00 4.00
Maize starch 3.21 2.49 3.25 2.53 14.96 14.24
Brewer’s yeast 2.00 2.00 2.00 2.00 2.00 2.00
Liquid Palatant 2.00 2.00 2.00 2.00 2.00 2.00
Vitamin/mineral premix2 1.87 1.87 1.87 1.87 1.87 1.87
Potassium chloride 0.40 0.40 0.40 0.40 0.40 0.40
Mould inhibitor3 0.30 0.30 0.30 0.30 0.30 0.30
Antioxidant4 0.15 0.15 0.15 0.15 0.15 0.15
Total 100 100 100 100 100 100
---Analysed chemical composition, % (DM basis)5
---Dry matter 90.62 92.70 91.43 90.11 92.28 90.80
Crude protein 30.93 29.33 29.90 31.18 29.31 31.28
Acid-hydrolysed fat 10.45 11.56 10.88 11.37 11.05 11.60
Starch 34.06 33.88 32.57 32.11 41.35 42.44
Total dietary fibre 24.12 23.40 24.61 23.63 14.12 14.22
Insoluble dietary fibre 21.24 18.55 22.5 19.46 11.20 9.55
Soluble dietary fibre 2.88 4.85 2.11 4.17 2.92 4.67
Gross energy (kJ/kg) 13.89 14.07 14.03 14.15 15.81 15.03
Starch gelatinization (%) 96.50 97.30 93.50 98.20 98.40 95.70
1 - Diets: SCF+CEL - Addition of sugarcane fibre and cellulose; SCF+CMC - addition of sugarcane fibre and caboxymethilcellulose; PE+CEL - addition of pea fibre and cellulose; PE+CMC - addition of pea fibre and carboxymethilcellulose; CEL - addition of cellulose;
of enzymatic and gravimetric procedures (AOAC, method 991.43, 1995). Total amount of starch was determined according to the method described by HENDRIX (1995). The degree of gelatinization of the starch of the experimental diets was determined by the amyloglucosidase method (SA et al., 2013). All analyses were carried out in duplicate and repeated
when the coefficient of variation was higher than 5%.
To study the postprandial glucose response, the six experimental diets were fed in two amounts to the dogs using a 6 x 2 factorial arrangement (six diets and two dosages), for a total of 12 experimental treatments. The amount of each diet offered was
defined according to its starch content, and the dogs
were fed with calculated amounts to attain intakes of 9.5g or 12.5g of starch (kg0.75)-1 day-1. To this,
first the amount of starch to be fed was defined
multiplying 9.5 or 12.5g by the dog metabolic weight
(body weight, kg0.75). After defined the desired
amount of starch, the amount of daily food provided for each dog was calculated dividing the amount of starch to be fed by the starch content of the food. This amount of starch intake resulted on the consumption of approximately 385kJ and 505kJ of metabolisable energy (kg0.75)-1 day-1, respectively, what is considered physiological for dogs at maintenance (NRC, 2006). A washout period of at least one week was done between each postprandial evaluation, during this period the dogs was fed with their normal kibble diet used in the kennel.
After five days of adaptation to the diet
(NGUYEN et al., 1998a) and provided amount, the postprandial glucose responses of the dogs were evaluated (CARCIOFI et al., 2008). Before the test, dogs were conditioned to ingest all of the food within 10 minutes. Dogs that took longer than 10min to consume the total amount of food were not tested, and the procedure was repeated on the following day. Afterward, the animals were deprived of food for the 24-hour period prior to the evaluation. On the day of the test, each dog was aseptically catheterized using a peripheral intravenous catheter inserted into the cephalic vein (Angiocath 20GA x 1.16in., Becton Dickinson, USA). Blood samples were taken pre-feeding (baseline sample, time 0) and 5, 10, 15, 30, 60, 120, 180, 240, 300, 360, 420, and 480min post-feeding. The time was computed starting immediately at the end of the meal. The blood was always collected at the same time, beginning at 8:00 am. Each sample (1.5mL) was collected in a Na-heparin tube and centrifuged (2,000 x G for 5min), and then, the plasma was placed in polypropylene tubes and maintained under refrigeration (4ºC) for a maximum of two hours
before analysis. The plasma glucose concentrations were determined with glucose oxidase tests (GOD-ANA, Labtest Diagnóstica S.A., Lagoa Santa, Brasil) using a semi-automated glucose analyser (Labquest model BIO-2000, Labtest Diagnóstica S.A., Lagoa Santa, Brasil). All of the analyses were conducted in
duplicate and were repeated when the coefficient of
variation was greater than 5%.
The changes in the plasma glucose concentrations were calculated for each postprandial period. Comparisons between the responses were made for mean and maximal increases, the mean and maximal incremental increases (the difference between the absolute glucose concentration in the sample and the baseline glucose concentration), and time to peak increase. The integrated areas under the postprandial glucose response curves were calculated using the trapezoidal method. In addition to measuring the total area under the curve (AUC from 0 to 480min), other selected intervals were also calculated. ORIGIN software (Microcal Software, Inc. Version 6.0, USA) was used to compute the AUC values.
Statistical analysis
The data were analyzed using the GLM procedure of the SAS software (Version 8.0, SAS Institute, Cary, NC, USA). The experimental unit was one dog. All of the dogs received all of the combinations of treatments (ZOLMAN, 1993). The model sums of squares were separated into dietary and animal effects and their interactions. The interactions among the variables tested (diet and ingested amount) were analyzed using the SLICE statement. Repeated measures analysis of variance with one inter-animal factor (diet) and one intra-animal factor (time of measurement) was the statistical method chosen to evaluate the effects of diet and time on the postprandial plasma changes. Pair-wise means comparisons were made using the Tukey test when the ANOVA F-test
results were statistically significant. Values of P<0.05 were considered significant.
RESULTS
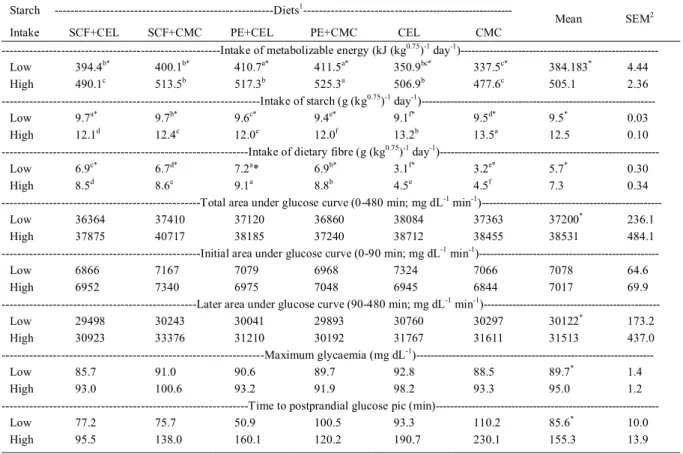
The dogs adequately consumed their diets in the 10min allowed. When the dogs were arbitrarily fed the lower amount of starch (9.5g of starch (kg0.75)-1 day-1), they ingested less energy, starch,
and fibre than when they were fed the higher starch dosage, as expected (P<0.05; Table 2). In addition,
when the dogs were fed with low-fibre diets (CEL and CMC foods), they ingested less fibre than when they
(P<0.05). The faeces production during the study was
adequate, without episodes of diarrhea or soft faeces.
There was no effect of the diet (fibre addition or fibre
type) or of the diet-versus-time interaction for any of the evaluated traits (P=0.7). For this reason, the effect of starch intake amount was evaluated independently
of diet (fibre type or dietary amount). When the dogs
were fed the higher amount of starch (12.5g of starch
(kg0.75)-1 day), regardless of the diet and the fibre
type, they presented a higher glucose AUC from 0-480min, a higher AUC from 90-480min, a higher mean and maximal glycaemia, and a prolonged time
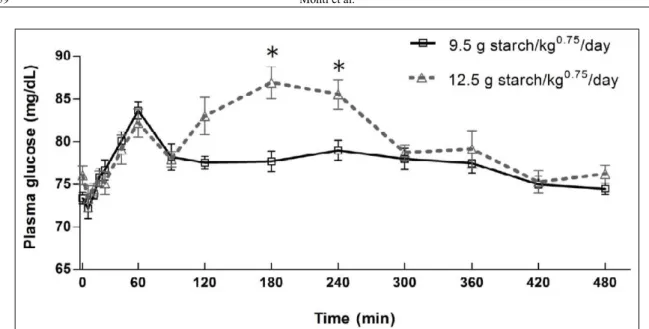
to the glucose peak (P<0.05). An interaction between time and the amount of starch consumed was verified
(P=0.001); at 180min and 240min after the meal, when the dogs had been fed the higher amount of starch, they exhibited a higher level of glycaemia than when they had been fed with the lower amount
of starch (P<0.05; Figure 1).
DISCUSSION
The results showed that changing the
dietary fibre intake from 3.1g (kg0.75)-1 day-1 (CEL diet) to 9.1g (kg0.75)-1 day-1 (PE+CEL diet) did not
change the postprandial glucose response. This intake change is considered a substantial increase because
the high-fibre diets contained approximately 24% dietary fibre. Soluble fibre consumption also did not
change the glucose meal response, even increasing it consumption from 0.7g (kg0.75)-1 day-1 (CEL diet)
to 1.7g (kg0.75)-1 day-1 (SCF+CMC diet) dogs did
not shown alteration in any evaluated parameters.
Other previous studies using dogs also did not find effect of fibre on the postprandial glucose response
(MASKELL et al., 1994; HOENIG et al., 2001). Evaluating beet pulp, guar gum and inulin incorporated in the basal diet of healthy dogs, DIEZ et al. (1998)
did not find any changes on glucose meal response
Table 2 - Nutrient intake and glucose postprandial response of dogs fed with experimental diets with different amounts of fibres of different solubilities, fed to achieve high (12.5g of starch (kg0.75)-1 day) and low (9.5 g of starch (kg0.75)-1 day)-1 starch intake.
Starch ---Diets1
---Intake SCF+CEL SCF+CMC PE+CEL PE+CMC CEL CMC
Mean SEM2
---Intake of metabolizable energy (kJ (kg0.75)-1 day-1
)---Low 394.4b* 400.1b* 410.7a* 411.5a* 350.9bc* 337.5c* 384.183* 4.44
High 490.1c 513.5b 517.3b 525.3a 506.9b 477.6c 505.1 2.36
---Intake of starch (g (kg0.75)-1 day-1
)---Low 9.7a* 9.7b* 9.6c* 9.4e* 9.1f* 9.5d* 9.5* 0.03
High 12.1d 12.4c 12.0e 12.0f 13.2b 13.5a 12.5 0.10
---Intake of dietary fibre (g (kg0.75)-1 day-1
)---Low 6.9c* 6.7d* 7.2a* 6.9b* 3.1f* 3.2e* 5.7* 0.30
High 8.5d 8.6c 9.1a 8.8b 4.5e 4.5f 7.3 0.34
---Total area under glucose curve (0-480 min; mg dL-1 min-1
)---Low 36364 37410 37120 36860 38084 37363 37200* 236.1
High 37875 40717 38185 37240 38712 38455 38531 484.1
---Initial area under glucose curve (0-90 min; mg dL-1 min-1
)---Low 6866 7167 7079 6968 7324 7066 7078 64.6
High 6952 7340 6975 7048 6945 6844 7017 69.9
---Later area under glucose curve (90-480 min; mg dL-1 min-1
)---Low 29498 30243 30041 29893 30760 30297 30122* 173.2
High 30923 33376 31210 30192 31767 31611 31513 437.0
---Maximum glycaemia (mg dL-1
)---Low 85.7 91.0 90.6 89.7 92.8 88.5 89.7* 1.4
High 93.0 100.6 93.2 91.9 98.2 93.3 95.0 1.2
---Time to postprandial glucose pic
(min)---Low 77.2 75.7 50.9 100.5 93.3 110.2 85.6* 10.0
High 95.5 138.0 160.1 120.2 190.7 230.1 155.3 13.9
1 - Diets: SCF+CEL - Addition of sugarcane fibre and cellulose; SCF+CMC – addition of sugarcane fibre and caboxymethilcellulose;
PE+CEL - addition of pea fibre and cellulose; PE+CMC – addition of pea fibre and carboxymethilcellulose; CEL - addition of cellulose;
CMC - addition of carboxymethilcellulose. 2 - Standard error of mean, n=6 animals per diet. *Differences between starch intake amounts
with the supplementation of the fibres in study, and only a reduction on plasma insulin was verified after
guar gum dietary addition. Fibres, however, may have effect when supplemented to dogs with diabetes
mellitus, in such particular health situation high fibre
diets may reduce glucose concentration after the meal, helping the insulin administration in the control of glucose blood concentration (GRAHAM, et al.,
2002). In addition, very high soluble fibre inclusion
can change glucose meal response of health dogs, as demonstrated after the supplementation of 15 to 20% of guar gum (on DM basis) (BLAXTER et al., 1990). Such high inclusion rate, however, is not practical and induces other problems like soft stools, lower nutrient digestibility, and poor diet acceptance by the animal.
When the amount of starch intake increased, nearly all of the evaluated glucose-related traits of the dogs increased. This effect is consistent with what is known for humans (WOLEVER & BOLOGNESI, 1996), and it occurred mainly due to the induction of a second glucose peak in the dogs between 120min and 240min after the meal. This second peak was higher and more prolonged than the
first peak, and similar plasma glucose concentrations
were found only 300min after the meal when the dogs were fed with low and high dosages of starch. This
response was independent of the fibre composition or
amount in the diet; it occurred after the consumption of all of the evaluated diets. The amount of food provided to induce these changes can be considered physiologic because the dogs received the amounts of energy normally used to feed dogs for maintenance.
Previous studies of dogs (NGUYEN et al., 1994; HOENIG et al., 2001; CARCIOFI et al., 2008) evaluated their postprandial blood glucose and insulin responses after the consumption of commercial diets produced using different processing
conditions, starch sources or fibre contents. However,
the amount of starch intake was not different for these diets (CARCIOFI et al., 2008), or it was not described and evaluated in the experiments. NGUYEN et al., (1998b), have studied the effects of carbohydrate, protein and fat on the postprandial plasma glucose response of dogs, and they already concluded that the amount of starch consumed is the major determinant of glucose response to the meal. For humans, the starch intake corresponds to 46% to 64% of the glycaemic variation, being at times even more important than the type of starch or the other dietary compounds consumed (WOLEVER & BOLOGNESI, 1996). The effect of the total amount of starch in a food or a meal is one of the important factors highlighted in the present study that may have several practical considerations for dogs. Replacing
starch with fibre or even protein may be a practical
way to reduce the glucose load of a meal. More than
examining the specific physiological effects of these
macronutrients, the substitution and reduction of the starch content seems to be important for producing foods that induce low glycaemic responses in dogs.
Additionally, diets with low protein, fat and fibre
contents based on starch may predispose dogs to an elevated postprandial glucose response and should be avoided in animals at risk of glucose tolerance
Figure 1 - Postprandial glucose response of dogs fed with experimental diets with different amounts of fibres of different
solubilities, fed to achieve high (12.5g of starch (kg0.75)-1 day-1) and low (9.5g of starch (kg0.75)-1 day-1) starch intake
disturbances, such as those that are obese, have diabetes mellitus, are of old age, and others.
One important limitation of the present study, however, is the measurement of only glucose. Insulin has a primary effect on blood glucose control, and knowing the postprandial pattern of the secretion of this hormone is very important to understanding carbohydrate metabolism (NGUYEN et al., 1994; NGUYEN et al., 1998b; HOENIG et al., 2001; CARCIOFI et al., 2008). It is possible that other responses could have been evaluated and understood if the insulin levels of the dogs had been determined, and this limitation suggests that the data from the present study should be interpreted with caution.
CONCLUSION
The data presented here suggest that
a range in insoluble and soluble fibre intake do
not change postprandial glucose response, and as
verified for humans, the amount of starch intake is a
main factor for the postprandial glucose response of healthy non-obese dogs.
ACKNOWLEDGEMENTS
To Guabi Pet Care, Campinas, SP, Brasil for the financial
and technical support to the Laboratory of Research on Nutrition and Nutritional Diseases of Dogs and Cats, UNESP, Jaboticabal, Brasil,
and Conselho Nacional de Desenvolvimento Científico e Tecnológico
(CPNq) for the scholarship of Mariana Monti (number
832265/1999-3). None of the authors have any conflicts of interest.
BIOETHICS AND BIOSSECURITY COMMITTEE APPROVAL
The Ethics Committee for Animal Well-Being of the College of Agrarian and Veterinary Sciences, Universidade Estadual Paulista approved all of the experimental procedures (Protocol number 0018435-08).
REFERENCES
AOAC (ASSOCIATION OF OFFICIAL ANALYTICAL CHEMISTS). Official methods of analysis. 16.ed. Washington, DC, USA, 1995, p. 1141.
BILIADERIS, C.G. The structure and interactions of starch with food. CanadianJournal of Physiology and Pharmacology, v.69,
p.60-78, 1991. Available from: <http://www.ncbi.nlm.nih.gov/
pubmed/2036603>. Accessed: Jun. 15, 2014. doi: 10.1139/y91-011.
BLAXTER, A.C. et al. Dietary fibre and post prandial
hyperglycaemia in normal and diabetic dogs. Journal of Small Animal Practice, v.31, p.29-233, 1990. Available from: <http://
onlinelibrary.wiley.com/doi/10.1111/j.1748-5827.1990.tb00790.x/ abstract>. Accessed: May 21, 2015. doi: 10.1111/j.1748-5827.1990.tb00790.x.
CARCIOFI, A.C. et al. Effects of six carbohydrates sources on dog diet digestibility and postprandial glucose and insulin response. Journal of Animal Physiology and Animal Nutrition,v.92, p.336-346, 2008.
Available from: <http://www.ncbi.nlm.nih.gov/pubmed/18477314>.
Accessed: Jun. 15, 2014. doi: 10.1111/j.1439-0396.2007.00794.x.
DIEZ, M. et al. The influence of sugar-beet fibre, guar gum and
inulin on nutrient digestibility, water consumption and plasma metabolites in healthy Beagle dogs. Research in Veterinary Science, v.64, p.91-96, 1998. Available from: <http://www.ncbi.
nlm.nih.gov/pubmed/9625462>. Accessed: May 21, 2015. doi: 10.1016/S0034-5288(98)90001-7.
FISCHER, M.M. et al. Fibre fermentability effects on energy and macronutrient digestibility, fecal traits, postprandial metabolite responses, and colon histology of overweight cats. Journal of Animal Science, v.90, p.2233-2245, 2012. Available from: <http://
www.ncbi.nlm.nih.gov/pubmed/22247109>. Accessed: Jun. 15, 2014. doi: 10.2527/jas.2011-4334.
GRAHAM, P.A. et al. Influence of a high fibre diet on glycaemic
control and quality of life in dogs with diabetes mellitus. Journal of Small Animal Practice, v.43, p.67-73, 2002. Available from:
<http://www.ncbi.nlm.nih.gov/pubmed/11873951>. Accessed:
May 15, 2015. doi: 10.1111/j.1748-5827.2002.tb00031.x.
HEATON, K.W. et al. Particle size of wheat, maize, and oat test meals: effects on plasma glucose and insulin responses and on the rate of starch digestion in vitro.American Journal of Clinical Nutrition,
v.47, p.675–682, 1988. Available from: <http://www.ncbi.nlm.nih.
gov/pubmed/2451416>. Accessed: Jun. 15, 2014.
HENDRIX, D.L. Rapid extraction and analysis of nonstructural carbohydrates in plant tissues. Crop Science,v.25, p.1306-1311,
1995. Available from: <http://naldc.nal.usda.gov/download/43385/
PDF>. Accessed: May 21, 2015. doi: 10.2135/cropsci1993.00111 83X003300060037x.
HOENIG, M. et al. Glucose tolerance and lipid profiles in dogs fed different fibre diets. Journal of veterinary pharmacology and therapeutics, v.2, p.160-169, 2001. Available from: <http://www.
ncbi.nlm.nih.gov/pubmed/19753709>. Accessed: Jun. 15, 2014.
LAFLAMME, D. Development and validation of a body condition score system for dogs. Canine Practice, v.22, p.10-15,
1997. Available from: <http://agris.fao.org/agris-search/search.
do?recordID=US9742264>. Accessed: Jun. 15 2014.
MASKELL, I.E. et al. Does the canning process alter the
physiological effects of dietary fibre in the dog? Journal of Nutrition, v.124, p.2704S-2706S, 1994. Available from: <http://
jn.nutrition.org/content/124/12_Suppl/2704S.full.pdf>. Accessed: May 21, 2015. doi: 0022-3166/94.
MASSIMINO, S.P. et al. Fermentable dietary fibre increases
GLP-1 secretion and improves glucose homeostasis despite increased gastrointestinal glucose transportation capacity in healthy dogs. Journal of Nutrition, v.128, p.1786-1793, 1998. Available from:
<http://jn.nutrition.org/content/128/10/1786.long>. Accessed: Jun.
15, 2014. doi: 0022-3166/98.
NGUYEN, P. et al. Composition of meal influences changes
in postprandial incremental glucose and insulin in health dogs. Journal of Nutrition, v.124, p.2707-2711, 1994. Available from:
<http://www.ncbi.nlm.nih.gov/pubmed/7996275>. Accessed: Jun.
NGUYEN, P. et al. Measurement of postprandial incremental
glucose and insulin changes in healthy dogs: influence of food
adaptations and length of time of blood sampling. Journal of Nutrition, v.128, p.2659-2662, 1998a. Available from: <http://
jn.nutrition.org/content/128/12/2659S.full>. Accessed: Jun. 15, 2014. doi: 0022-3166/98.
NGUYEN, P. et al. Glycemic and insulinemic responses after
ingestion of commercial foods in healthy dogs: influence of food
composition. Journal of Nutrition, v.128, p. 2654-2658, 1998b.
Available from: <http://jn.nutrition.org/content/128/12/2654S.
full>. Accessed: Jun. 15, 2014. doi: 0022-3166/98.
NRC (NATIONAL RESEARCH COUNCIL). Nutrient requirements of dogs and cats. Washington, DC: National Academy, 2006, p.424.
SA, F.C. et al. Enzyme use in kibble diets formulated with wheat bran for dogs: effects on processing and digestibility.
Journal of Animal Physiology and Animal Nutrition, v.97,
Supp.1, p.51-59, 2013. Available from: <http://www.ncbi.nlm.
nih.gov/pubmed/23639017>. Accessed: Jun. 15, 2014. doi: 10.1111/jpn.12047.
FEDIAF (EUROPEAN PET FOOD INDUSTRY FEDERATION). Nutritional guidelines for complete and complementary pet food for cats and dogs, 2008. Available from: <http://www.fediaf.
org/self-regulation/nutrition/>. Online. Accessed: Jun. 15, 2015.
WOLEVER, T.M.S.; BOLOGNESI, C. Prediction of glucose and insulin responses of normal subjects after consuming mixed meals varying in energy, protein, fat, carbohydrate and glycemic index. Journal of Nutrition, v.126, p.2807-2812, 1996. Available from:
<http://www.ncbi.nlm.nih.gov/pubmed/8914952>. Accessed: Jun.
15, 2014. doi: 0022-3166/96.