ISSN 1982-4327 (online version)
Psychological Evaluation
1Paper deriving from the doctoral dissertation “Relations between positive personal features and well-being” by the first author, under the advice of the fifth, defended in the Post-Graduate Program in Psychology at the Federal University of Rio Grande do Sul. Support: Natura Cosméticos S. A. and a Doctoral Scholarship from National Council of Scientific and Technological Development (CNPq). 2Correspondence address: Salgado de Oliveira University, Post-Graduation in Psychology, 263, Marechal Deodoro Street, Centro, Niterói-RJ, Brazil. CEP: 24.030-060. E-mail: freitas.cpp@gmail.com
Personal Growth Initiative Scale - II: Adaptation and
Psychometric Properties of the Brazilian Version
1Clarissa Pinto Pizarro Freitas2 Universidade Salgado de Oliveira,
Niterói-RJ, Brazil
Bruno Figueiredo Damásio
Universidade Federal do Rio de Janeiro, Rio de Janeiro-RJ, Brazil
Helder Hiroki Kamei
Natura Innovation, Cajamar-SP, Brazil
Patricia Renovato Tobo
Natura Innovation, Cajamar-SP, Brazil
Sílvia Helena Koller
Universidade Federal do Rio Grande do Sul, Porto Alegre-RS, Brazil
Christine Robitschek
Texas Tech University, Lubbock-TX, United States of America
Abstract: The skills to change beliefs and behaviors in order to adapt to new contexts is identified as Personal Growth Initiative. This study aimed to assess the psychometric properties of the Brazilian Version of the Personal Growth Initiative Scale II (PGIS-II). A nationwide sample of 2,149 subjects (64.8% women, M = 37.91, SD = 10.78) was assessed. Exploratory factor analysis supported
the first-order four-factor structure of the scale (readiness for change, planfulness, using resources, and intentional behavior). Confirmatory factor analyses (CFA) supported the first-order four-factor structure as being the most reliable to the data. Personal Growth Initiative (PGI) dimensions were positively related to optimism, presence of meaning in life, and life satisfaction. PGIS-II presented adequate psychometric properties, suggesting its usefulness in evaluating personal growth initiative.
Keywords: positive psychology, factor analysis, test validity
Escala de Iniciativa ao Crescimento Pessoal - II: Adaptação e
Propriedades Psicométricas da Versão Brasileira
Resumo: As habilidades de modificar crenças e comportamentos a fim de se adaptar a novos contextos são identificadas como Iniciativa ao Crescimento Pessoal. Este estudo objetivou avaliar as propriedades psicométricas da versão brasileira da Escala de Iniciativa ao Crescimento Pessoal - II (ICP-II). Foi avaliada uma amostra nacional de 2.149 participantes (64,8% mulheres,
M = 37,91, DP = 10,78). A análise fatorial exploratória apoiou a estrutura de quatro fatores de primeira ordem da escala (preparação
para mudança, planejamento, comportamento intencional e uso de recursos). A análise fatorial confirmatória (AFC) evidenciou que a estrutura de quatro fatores de primeira ordem seria uma estrutura fidedigna aos dados. As dimensões da Iniciativa ao Crescimento Pessoal (ICP) estiveram positivamente associadas ao otimismo, presença de sentido de vida e satisfação com a vida. A ICP-II apresentou propriedades psicométricas adequadas, indicando sua utilidade para avaliar a iniciativa ao crescimento pessoal.
Palavras-chave:psicologia positiva, análise fatorial, validade do teste
Escala de Iniciativa de Crecimiento Personal - II: Adaptación y
Propiedades Psicométricas de la Versión Brasileña
Resumen: Las habilidades para cambiar creencias y comportamientos para adaptarse a nuevos contextos se identifican como Iniciativa de Crecimiento Personal. Este estudio tuvo como objetivo evaluar las propiedades psicométricas de la versión brasileña de la Escala de Iniciativa de Crecimiento Personal - II (ICP-II). Fue valorada una muestra nacional compuesta por 2149 participantes (64,8% mujeres,
M = 37,91, DE = 10,78). El análisis factorial exploratorio sostuvo la estructura de cuatro factores de primer orden de la escala (preparación
para el cambio, planeamiento, conducta intencional y uso de recursos). Por su parte, el análisis factorial confirmatorio (AFC) evidenció que la estructura de cuatro factores de primer orden sería confiable respecto a los datos. Las dimensiones de la Iniciativa de Crecimiento Personal (ICP) estuvieron positivamente asociadas al optimismo, la presencia del sentido de la vida y la satisfacción con esta. La ICP-II presentó propiedades psicométricas adecuadas, indicando su utilidad para evaluar la iniciativa de crecimiento personal.
Palabras clave: psicología positiva, análisis factorial, validez del test
by cognitive or behavioral changes, which can occur in various dimensions of one’s life. High levels of PGI help the
individual identify or create opportunities that facilitate his/
her positive personal development (Robitschek et al., 2012). PGI includes cognitive and behavioral dimensions.
‘Readiness for change’ and ‘planfulness’ comprise the
cognitive dimensions of PGI. Readiness for change is the ability to identify specific ways in which to grow or change. Planfulness is the person’s ability to organize strategies that enable his/her self-improvement. ‘Intentional behavior’
and ‘using resources’ comprise the behavioral dimensions
of PGI. Intentional behavior is deliberate actions taken to enact plans for self-improvement. Using resources, in turn, involves accessing external resources (e.g., asking for help from others), to be used to promote personal growth (Robitschek et al., 2012).
Studies have shown that individuals with more well
developed PGI skills may be more persistent in the process of environmental exploration, as well as in searching for opportunities for personal growth (Yakunina, I.K. Weigold, & A. Weigold, 2013a). Well-developed PGI
skills are positively related to the development and maintenance of positive interpersonal relations and adaptive coping skills to address stressors and challenges
faced across the lifespan (Robitschek et al., 2012). PGI
dimensions are positively associated with higher levels of
well-being and negatively related to stress (Yakunina et al., 2013). The role of PGI in positive development and its
positive impact on well-being indicates the importance of understanding this construct in depth.
The first scale designed to assess PGI was the Personal Growth Initiative Scale (PGIS). Nine items in a unidimensional structure comprised the scale. The PGIS presented adequate internal consistency (α = .90) and fit indices for the unidimensional structure (c2 (27) = 61.5,
p < .001, CFI = .95, NFI = .93). Furthermore, the PGIS
showed a test-retest reliability index of .74 after a period of two months (Robitschek, 1998).
Despite the adequate psychometric properties of the PGIS, the scale evaluated just the general score of PGI instead of the specific dimensions of the construct (e.g., cognitive
and behavioral). To delineate specific PGI skills, Robitschek et al. (2012) created the Personal Growth Initiative Scale – II (PGIS-II). Sixteen items, divided into the following four factors, comprise the PGIS-II: readiness for change; planfulness; using resources; and intentional behavior. In the development and validation study (Robitschek et al., 2012), the first-order four-factor structure of the PGIS-II showed adequate fit indices S-Bχ2 (33) = 1356.7, p < .001,
SRMR = .09, RMSEA = .07 (90% CI = .07 – .08). Additionally, satisfactory test-retest reliability indices were observed, ranging from .73 (using resources) to .81 (planfulness), including 1-week and 6-week intervals. Internal consistency was also adequate (readiness for change, α = .83, planfulness, α = .84, using resources, α = .80 and intentional behavior, α = .89) (Robitschek et al., 2012).
Studies with various cultural groups (such as African American and International College students) demonstrated that the North American version of the PGIS-II showed a satisfactory first-order four-factor structure for the scale. The four first-order dimensions explained the dimensions readiness for change, planfulness, using resources, and intentional behavior of Personal Growth Initiative (I.K. Weigold, A. Weigold, Russell, & Drakeford, 2014; Yakunina, Weigold, Weigold, Hercegovac, & Elsayed, 2013b). The same first-order four-factor structure of the PGIS-II was also observed in the Chinese and Turkish versions of the scale (Yalçın & Malkoç, 2013; Yang & Chang, 2014).
The results of previous studies (Robitschek et al., 2012; Yakunina et al., 2013; Yang & Chang, 2014) suggest that the PGIS-II is a reliable instrument to evaluate the dimensions of PGI. Therefore, this study aimed to adapt and investigate the psychometric properties of the Brazilian version of PGIS-II.
Method
The adaptation process of the Brazilian version of the PGIS-II was based on the guidelines provided by Borsa, Damásio, and Bandeira (2012). Initially, the questionnaire
was translated from English to Portuguese by two
independent researchers. Two translated versions were synthesized into a preliminary adapted version. This adapted version was evaluated by a target population (n = 12) and by
a group of researchers, psychologists and expertsin the fields
of psychometrics and positive psychology.
This adapted version was then back-translated from Portuguese to English by two other independent translators, and again, the study authors conducted a synthesis of the back-translations. This synthesized back-translated version was evaluated by the group of experts and the author of the original PGIS-II. They verified that the translated and back-translated versions were culturally adapted, as well as semantically and idiomatically equivalent to the original
version of the scale.
Participants
A total of 2149 subjects (64.8% women), aged 18 to 88 years (M = 37.91, SD = 10.78) participated in this study.
in the Northeast, 7% were living in the Central West and 3%
were living in the North.
Instruments
Sociodemographic Questionnaire: This instrument was
developed to assess the sociodemographic characteristics
of the sample (e.g., gender, age, marital status, educational level, financial income, presence or absence of chronic illness and/or special needs).
Personal Growth Initiative Scale – II - PGIS-II
(Robitschek et al., 2012): The PGIS-II is a 16-item Likert-type scale (ranging from 0 – Disagree strongly to 5 – Agree strongly) with four items assessing readiness for change, five items assessing planfulness, three assessing use of resources
and four assessing intentional behavior.
Satisfaction with Life Scale – SWLS (Diener, Emmons,
Larsen, & Griffin, 1985); Brazilian version adapted by Gouveia, Milfont, Fonseca, and Coelho (2009): The SWLS is a 5-item Likert-type scale (ranging from 1 – totally disagree to 7 – totally agree) and assesses life satisfaction by a single-factor solution. In this sample, the following goodness-of-fit indexes of the instrument were excellent, suggesting the adequacy of the scale: CFI = .99; TLI = .99; and RMSEA = .07 (90% CI = .05 – .08).
Life Orientation Test-Revised - LOT-R (Scheier, Carver,
& Bridges, 1994), Brazilian version adapted by Bastianello, Pacico, and Hutz (2014): The LOT-R evaluates one’s levels of optimism. It is comprised of ten items (4 fillers), answered on a five-point Likert scale (0 – totally disagree, 4 – totally agree). In this study, the unifactorial solution presented excellent goodness-of-fit indexes: CFI = .94; TLI = .90; and RMSEA (90% CI) = .17 (.16 – .18).
Meaning in Life Questionnaire – Presence of Meaning subscale - MIL-P (Steger, Frazier, Oishi, & Kaler, 2006),
Brazilian version adapted by Damásio and Koller (2015): The MIL-P is a 5-item instrument that assesses the levels of
meaning in life. Participants answer items through a seven
point Likert-type scale (ranging from 1 – totally false to 7 – totally true). In the current study, the MIL-P presented satisfactory goodness-of-fit indexes: CFI = .99; TLI = .99; and RMSEA = .08 (90% CI = .07 – .10).
Procedure
Data collection. Participants were recruited using
various sources, such as personal and social media invitations, a Market Research Company, recruitment within social and occupational institutions (specifically adults and elderly). Of the total, 60% answered the questionnaires in a web-based platform, whereas the remaining 40% responded to the questionnaires in the paper-and-pencil form. To verify if the participants who answered the questionnaires in a web-based platform were different from participants who answered the questionnaires
in a paper-and-pencil form t tests were used. There were
no significant differences between groups (web-based platform and paper-and-pencil form) for any of the variables investigated in this study (readiness for change, planfulness, using resources, intentional behavior, life satisfaction, presence of meaning in life and optimism). An imputation strategy for the Weighted Least Squares Mean and Variance-Adjusted (WLSMV) estimation method using a polychoric correlation matrix was implemented on participants’ data with at most 10% of missing variables on each questionnaire (Asparouhov & B. Múthen, 2010). According to this procedure, data were imputed for 100 participants (4.7% of the cases).
Data analysis
Exploratory Factor Analysis
To evaluate the factor structure of the PGIS-II, three extraction criteria were utilized: theoretical assumptions (i.e., the PGI construct is constituted by four dimensions); factors’ eigenvalues (i.e., factors with eigenvalue higher than 1), and Parallel Analysis (Hayton, Allen, & Scarpello, 2004). The number of factors to be retained was based on the results of the three extraction criteria, in such a way that, if necessary, more than one model would be assessed.
After deciding the number of factors to be retained, Exploratory Structural Equation Modeling – ESEM (Asparouhov & B. Múthen, 2009), using the Weighted Least Squares Mean and Variance-Adjusted (WLSMV) estimation method with an oblique rotation (Geomin) were performed. The ESEM refers to an analysis that integrates the features of the Exploratory Factor Analyses (EFA) and Confirmatory Factor Analyses (CFA). This
method allows the analysis of different factorial solutions
previously defined through an exploratory analysis. Since the ESEM also covers the CFA features, the measurement error of the model is controlled and the CFA model fit estimates are presented (Asparouhov & B. Muthén, 2009). The WLSMV is an estimation method that is sufficiently robust for ordinal data (L.K. Muthén & B.O. Muthén, 2010). The oblique rotation (Geomin) was applied,
allowing the correlation of factors on the multi-factorial
solution. The number of factors extracted on the ESEM was based on the theoretical assumptions, eigenvalues and
parallel analysis criteria.
Goodness-of-fit of the PGIS-II was assessed through the following fit indices: comparative fit index (CFI), Tucker-Lewis index (TLI), root mean square error of approximation (RMSEA) and standardized root mean square residual (SRMR). According to the guidelines used, CFI and TLI values should be greater than .90, RMSEA values should be less than .08 to indicate acceptable fit (with a 90% confidence interval not greater than .10), and SRMR with values below .80 were considered acceptable. The ESEM was conducted with an independent proportion (n1 = 839)
Confirmatory and Multigroup Factor Analyses
To confirm the most adequate structure of the PGIS-II, three confirmatory factor analyses (WLSMV estimation method) with a second independent sample (n2 = 1249)
of the total sample (n = 2149) were employed. The first
model evaluated the fit indexes of the one-dimension structure, in which the 16 items loaded onto a general PGI factor. The second model assessed a correlated first-order four-factor solution for the PGI (readiness for change, planfulness, using resources, and intentional behavior). The third model was a second-order structure in which all four factors loaded onto a higher-order factor of PGI. These
data analysis procedures were recommended by the scale
author (Robitschek et al., 2012) and were used in previous studies on the PGIS-II factor structure (I.K. Weigold et al., 2014; Yakunina et al., 2013; Yalçın & Malkoç, 2013; Yang & Chang, 2014).
The fit indices were the following: CFI (> .90), TLI (> .90), and RMSEA (< .08, with the 90% confidence interval not exceeding .10). Modification indices (MI > 50.00) were also analyzed to identify the sources of problems in the model specification.
After achieving the most adequate structure of the PGIS-II, multigroup confirmatory factor analyses (MGCFAs) with
the total sample were performed to test the measurement
invariance of the scale for gender (female, n =1393; male,
n =756) and for various age groups (young, n = 838; adult, n = 967; and elderly, n = 344). Measurement invariance was
evaluated by testing configural, metric and scalar invariance, in a hierarchical way, so that a more restricted model was compared to a less restricted model (Damásio & DeSousa, 2015). According to model restriction, the configural model was compared to the metric model, and the metric model was
compared to the scalar model.
The models were evaluated based on the CFI (> .90), TLI (> .90), and RMSEA (< .08, with the 90% confidence interval not exceeding .10) fit indices. Measurement invariance was assessed based on the CFI difference values between the models (ΔCFI). Measurement invariance is achieved if ΔCFIis lower than .01 (ΔCFI < .01) (Damásio
& DeSousa, 2015).
Reliability
The reliability of the scale was assessed using Cronbach’s alpha. Values of Cronbach’s alpha higher than .70 were
considered acceptable.
Convergent Validity
Convergent validity was assessed by correlating
the components of the PGIS-II (readiness for change, planfulness, using resources, and intentional behavior) with life satisfaction, presence of meaning in life, and optimism. The correlations were investigated through a structural equation model to control the measurement
error of the model. Several hypotheses were tested
simultaneously in the correlation analyses. In order to avoid family-wise error the Bonferroni correction was applied. We expected positive and low-to-moderate correlations for the PGI dimensions with life satisfaction, presence of meaning in life, and optimism.
Ethical Considerations
When participants were invited to participate in the
study, they received a copy of the Informed Consent Form,
being informed that their participation was voluntary.
Those individuals who agreed to participate answered the instruments after signing (paper and pen data collection) or agreeing with (online data collection) the Informed
Consent Form. This study received approval from the Ethics Committee of the Institute of Psychology of Federal University of Rio Grande do Sul (UFRGS), in April 11, 2013. The number of the protocol was 243.206.
Results
Exploratory Factor Analysis
The results of the parallel analysis (Hayton et al., 2004) suggested a one-dimensional structure for the PGIS-II as the most reliable to the data, whereas Kaiser’s criterion (eigenvalue > 1) suggested 4 factors. The eigenvalues were: 7.66 for Factor 1; 1.53 for Factor 2; 1.10 for Factor 3; and 1.07 for Factor 4. To identify the most parsimonious model, ESEM evaluated a one-dimensional structure and a four-factor structure for the PGIS-II. The results of the
one-dimensional structure showed that all 16 items loaded
significantly onto the dimension. However, fit indexes were not adequate (Table 1).
Considering this result and considering that
theoretically the PGIS-II must be conceptualized as a four-factor structure, the results of the four-factor model were analyzed to verify the extent to which this solution would match the original structure (Robitschek et al., 2012). The first-order four-factor structure was satisfactory and presented adequate fit indices (Table 1). The items loaded on the expected dimensions, with the exception of items 12 and 13. Item 12, originally in the dimension ‘using resources’, showed higher factor loading on the dimension ‘intentional behavior’. Item 13, originally in the dimension ‘planfulness’, showed higher
factor loading on the dimension ‘readiness for change’.
Additionally, cross-loadings were observed in items 4, 2 and 10 (Table 1). Moreover, the factors were significantly correlated (readiness for change with planfulness,
r = .60, readiness for change with using resources, r = .30,
readiness for change with intentional behavior, r = .57,
planfulness with using resources, r = .52, planfulness
with intentional behavior, r = .30, using resources with
Table 1
Exploratory Factorial Analysis of One-Dimensional Structure and First-Order Four-Factor Structure of the PGIS-II
Items
Model 1 Model 2
Item Loading Item Loading /Factor
PGI RC Pla IB UR
Item 1. Eu estabeleço objetivos realistas sobre o que eu quero mudar em mim mesmo(a) .66* - .08* .73* .06 .05 Item 2. 2. Eu sei quando estou pronto para fazer mudanças específicas em mim mesmo(a) .70* .34* .53* - .04 - .01 Item 3. Eu sei fazer planos realistas para mudar a mim mesmo(a) .80* .11* .84* - .02 - .04 Item 4. Eu aproveito todas as oportunidades que aparecem para crescer .57* - .09* .33* .53* - .05* Item 5. Quando eu tento mudar a mim mesmo(a), faço um plano realista para meu
crescimento pessoal) .81* .02 .77* .14* .04
Item 6. Eu peço ajuda quando tento mudar a mim mesmo(a) .53* - .07* .05* -.02 .83* Item 7. Eu trabalho ativamente para melhorar a mim mesmo(a) .70* .09* .26* .47* .10* Item 8. Eu reconheço o que preciso mudar em mim mesmo(a) .53* .53* - .11* .13* .11* Item 9. Eu estou constantemente tentando crescer como pessoa .63* .11* .01 .72* - .04 Item 10. Eu sei como estabelecer objetivos realistas para mudar a mim mesmo(a) .80* .34* .59* .02 .01 Item 11. Eu sei quando preciso fazer alguma mudança específica em mim mesmo(a) .76* .88* .02 - .01 - .04
Item 12. Eu uso recursos quando tento crescer .66* .24* .20* .30* .17*
Item 13. Eu sei quais são os passos necessaries para mudar a mim mesmo(a) .74* .58* .28* - .01 .02 Item 14. Eu busco ajuda ativamente para mudar a mim mesmo(a) .58* .07* - .03* .02 .91* Item 15. Eu busco por oportunidades para crescer como pessoa .68* .01 - .02 .87* .04 Item 16. Eu sei quando é hora de mudar coisas específicas em mim mesmo(a) .76* .76* .07* .07 - .03
Model 1 - One-Dimensional Structure of the PGIS-II
c2(gl) CFI TLI RMSEA (90% CI) SRMR
3492.42* (104) .83 .80 .20 (.19 – .20) .09
Model 2 - First-Order Four-Factor Structure of the PGIS-II
c2(gl) CFI TLI RMSEA (90% CI) SRMR
447.99* (62) .98 .96 .08 (.08 – .09) .02
Note. *p < .05; n = 839, Model 1 = One-Dimensional Structure of the PGIS-II; Model 2 = First-Order Four-Factor Structure of the PGIS-II;
RC = Readiness for Change; Pla = Planfulness; IB = Intentional Behavior; UR = Using Resources.
Confirmatory Factor Analysis
Based on the inconsistencies of the ESEM results, three models for the PGIS-II were tested in an independent sample (n = 1249): Model 1 assessed a one-dimension
structure, with all 16 items loading onto a general PGI factor; model 2 evaluated the theoretically based first-order four-factor correlated structure, in which the items loaded onto readiness for change, planfulness, using resources, and intentional behavior; and model 3 assessed a second-order structure, with items loading on their expected theoretical dimensions, and the four factors loading onto a higher-order factor of PGI. The second ESEM model previously
achieved was not evaluated, as it does not represent any
theoretical perspective.
The results of the first CFA showed mediocre goodness-of-fit indexes for the PGIS-II unifactorial solution (Table 2). The second model, which assessed a first-order four-factor structure for the PGIS-II, with all 16 items loading on their expected theoretical dimension, allowing the factors to correlate, also presented unacceptable fit indexes (Table 2). The third model (higher-order four-factor solution, in this model the factors were not allowed to correlate), also presented unacceptable fit indexes (Table 2). For all three models, modification indexes suggested
the inclusion of error covariances for the following item pairs:
(MIM1 =173.44, MIM2 = 111.03, MIM3 = 263.91). Both items 6 (‘I
ask for help when I try to change myself’(‘Eu peço ajuda quando tento mudar a mim mesmo(a)’)) and 14 (‘I actively seek help when I try to change myself’(‘Eu busco ajuda ativamente para mudar a mim mesmo(a)’)) refer to the use of external resources in the process of self-improvement. Items 2 (readiness for change – ‘I can tell when I am ready to make specific changes in myself’ (‘Eu sei quando estou pronto para fazer mudanças específicas em mim mesmo(a)’)) and 3 (planfulness – ‘I know how to make a realistic plan to change myself’(‘Eu sei fazer
planos realistas para mudar a mim mesmo(a)’)) aim to evaluate
self-perceptions about the change process of the individual.
The overlap content of these two pairs of items might be an explanation for the residual correlation.
Table 2 shows that the inclusion of error covariance between item pairs 2-3 and 6-14 improved the goodness-of-fit indexes of the three models evaluated. The results indicated that the second model (M2), which assessed the first-order four-factor structure model, presented the best fit index.
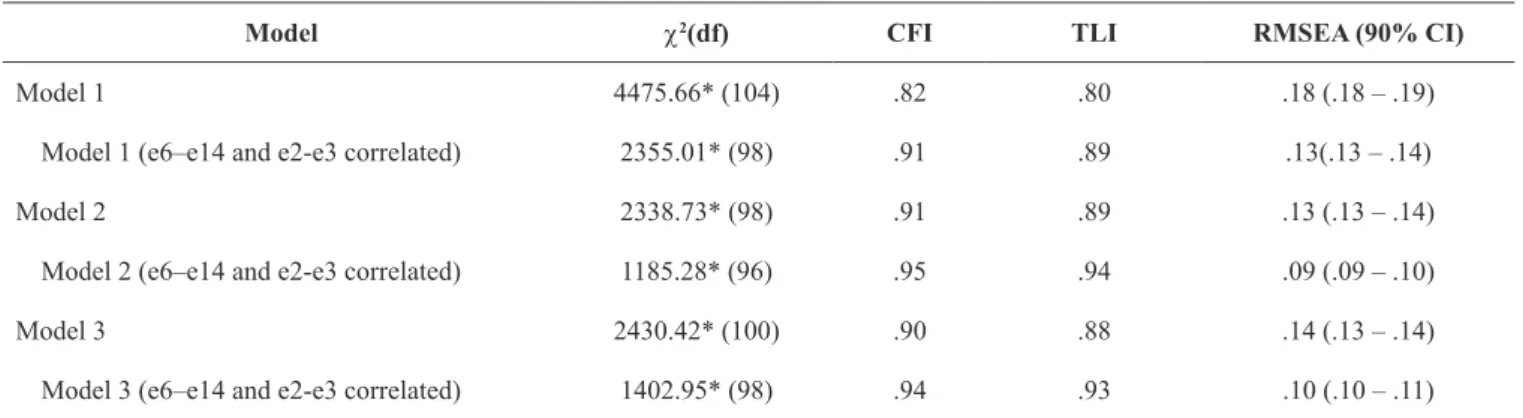
Table 2
Goodness-of-Fit Indexes of the Brazilian Version of PGIS-II (n = 1249)
Model c2(df) CFI TLI RMSEA (90% CI)
Model 1 4475.66* (104) .82 .80 .18 (.18 – .19)
Model 1 (e6–e14 and e2-e3 correlated) 2355.01* (98) .91 .89 .13(.13 – .14)
Model 2 2338.73* (98) .91 .89 .13 (.13 – .14)
Model 2 (e6–e14 and e2-e3 correlated) 1185.28* (96) .95 .94 .09 (.09 – .10)
Model 3 2430.42* (100) .90 .88 .14 (.13 – .14)
Model 3 (e6–e14 and e2-e3 correlated) 1402.95* (98) .94 .93 .10 (.10 – .11)
Note. Model 1 = Model One-dimension; Model 2 = Model First-Order Four-Factor Structure; Model 3 = Higher-Order Four-Factor Structure; *p < .05.
Finally, chi-square difference test analyses (Δc2) were
conducted to verify if goodness-of-fit indexes of model 2 were significantly different from the indexes of models 1 and 3. A comparison of model 1 (considering the correlated errors) with model 2 (considering the correlated errors) and model 3 (considering the correlated errors) showed that model 2 had goodness-of-fit indexes significantly better than the other models (respectively Δc2 = 1161.79 (6), p < .001, Δ c2 = 145.59 (2), p < .001).
Among all the structures investigated, the results suggest that the first-order four-factor structure model (second model; Table 2), with error covariances among items 6-14 and 2-3, constitutes the most reliable solution for the Brazilian version of PGIS-II (Figure 1). All item loadings were satisfactory. The ‘readiness for change’ factor loadings ranged from .55 to .80, the ‘planfulness’ factor loadings ranged from .64 to .84, the ‘using resources’ factor loadings ranged from .47 to .83 and the ‘intentional behavior’ factor loadings ranged from .70 to .80. The PGI factor correlations presented high magnitudes, especially between ‘readiness for change’ and ‘planfulness’ (Figure 1). Additionally, the effect size of the relationships between PGI dimensions varied from medium to large (readiness for change with planfulness, r² = .77, readiness for change with using
resources, r² = .46, readiness for change with intentional behavior, r² = .53, planfulness with using resources, r² = .49, planfulness
with intentional behavior, r² = .61, intentional behavior with
using resources, r² = .64).
Item 2
Item 8
Item 11
Item 16
Item 1
Item 3
Item 5
Item 10
Item 13
Item 6
Item 12
Item 14
Item 4
Item 7
Item 9
Item 15 Readiness for
Change
Planfulness
Using Resources
Intentional Behavior
.88
.68
.70
.80 .78 .73
.76 .60 .83 .83
.66
.66 .66
.81 .84 .84 .79
.51 .84 .65
.68 .79
.79 .75
Figure 1. First-order Four-Factor Structure of the Brazilian
Multigroup Confirmatory Factor Analysis
Goodness-of-fit indexes of the configural model showed that the first-order four-factor structure of the Brazilian version of the PGIS-II was acceptable in the various groups (gender,
female and male; age groups, young, adult and elderly). In considering the ΔCFI criteria (Damásio & DeSousa, 2015), metric and scalar invariance were achieved across all subgroups (male and female, young adults, adults, and the elderly; Table 3).
Table 3
Goodness-of-fit indexes of Brazilian version of PGIS-II of MGCFA to Gender and Age Group (n = 2.149)
Gender measurement invariance RMSEA (90% CI) TLI CFI ΔCFI
Male (n = 756) .09 (.08 - .09) .951 .961
-Female (n = 1393) .10 (.09 - .10) .933 .947
-Unconstrained model .09 (.09 - .10) .938 .950
-Metric invariance .09 (.08 - .09) .946 .954 .004
Scalar invariance .07 (.07 - .08) .965 .962 .008
Age measurement invariance RMSEA (90% CI) TLI CFI ΔCFI
Young (n = 838) .10 (.09 - .10) .939 .951
-Adult (n = 967) .10 (.10 - .11) .946 .932
-Elderly (n = 344) .10 (.09 - .10) .933 .946
-Unconstrained model .09 (.09 - .10) .941 .953
-Metric invariance .08 (.08 - .09) .951 .958 .005
Scalar invariance .07 (.06 - .07) .968 .962 .004
Note. * p < .05
Reliability
Reliability coefficients of the four PGI dimensions were assessed using Cronbach’s alpha. The four dimensions presented satisfactory internal consistency values (readiness for change, a = .86, planfulness, a = .79, readiness for change, a = .78, and using resources, a = .75).
Convergent Validity
Evidence of convergent validity was investigated using
the total sample (n = 2149). As expected, readiness for change,
planfulness, using resources, and intentional behavior were significantly, positively correlated with optimism, presence of meaning in life, and life satisfaction (Table 4). There were medium effect sizes for the relations of readiness for change, planfulness, using resources, and intentional behavior with optimism (r² = .13, r² = .19, r² = .27, r² = .13, respectively),
presence of meaning in life (r² = .20, r² = .25, r² = .19, r² = .26, respectively), and life satisfaction (r² = .10, r² = .14, r² = .10, r² = .16, respectively) (Table 4).
Table 4
Means, Standard Deviation and Correlations (n = 2149)
Variable M (DP) 1 2 3 4 5 6
1. RC 3.7 (0.8) -2. Pla 3.6 (0.9) .88* 3. UR 4.0 (0.8) .71* .72* 4. IB 4.0 (0.8) .72* .75* .82* 5. SWL 4.7 (0.9) .31* .38* .31* .40* 6. PML 3.3 (1.1) .45* .50* .44* .51* .54* 7. Opt 3.9 (0.6) .36* .44* .53* .36* .31* .31*
Note. *p < .001; RC = Readiness for Change; Pla = Planfulness;
IB = Intentional Behavior; UR = Using Resources; SWL = Satisfaction with life; PML = Presence of Meaning in Life; Opt = Optimism.
Discussion
After several factor analyses, a first-order four-factor
structure was indicated as the most reliable for our data.
Future studies, however, should investigate the inclusion of
items more sensitive for this population.
The results of MGCFA indicated that the PGIS-II showed configural, metric and scalar invariance for gender (male and female) and for age group (young adult, adult, and elderly). These findings suggest that the PGIS-II can be employed in Brazilian males and females of various age groups, from young adults to the elderly (Damásio & De Sousa, 2015). The internal consistency of the PGIS-II dimensions indicated
that the scale may be considered a reliable instrument to
evaluate PGI.
The PGIS-II factors had stronger relations with the
presence of meaning in life than with the other variables.
The presence of meaning in life refers to the extent to which people comprehend and see significance in their lives, as
well as the degree to which they perceive themselves to
have a purpose or overarching goal in life (Steger, Shin, Shim, & Fitch-Martin, 2013). Theoretically, it is a future-oriented, cognitive, and motivation-based construct. PGI, in turn, refers to active and intentional engagement in the process of self-improvement (Robitschek et al., 2012). People will use their PGI skills in life domains of greatest importance to them (Freitas, Damásio, Tobo, Kamei, & Koller, 2016). Growth and development that are personally
important should lead to an increased sense of purpose in
life. Although not tested in this study, it is possible that better developed PGI skills promote a greater sense of
meaning in life.
Optimism was positively related to readiness for change, planfulness, using resources, and intentional behavior.
Optimism refers to the tendency of individuals to believe that they will succeed in reaching their goals and will have
positive experiences in life (Scheier et al., 1994). The positive relationships of optimism with the PGIS-II skills support the proposition that PGI skills may have a positive impact on individuals’ evaluations about major changes experienced in their lives (e.g., job promotion) and situations faced in
everyday life (e.g., interpersonal relations) (I.K. Weigold et
al., 2013). For example, persons with higher levels on PGI
dimensions may evaluate adverse situations as challenges
and opportunities to grow as a person (Robitschek et al., 2012; I.K. Weigold et al., 2013).
Finally, the relationships of the PGIS-II skills with SWL indicate that readiness for change, planfulness, using resources, and intentional behavior may impact individual levels of well-being. Furthermore, relationship patterns of PGI with personal features (presence of meaning in life and optimism) suggest that PGI skills may constitute a personal resource (Freitas et al., 2016; I.K. Weigold et al., 2013).
The strengths of the study include the robustness of the data analysis procedures. Exploratory and confirmatory
factor analyses were performed with corrections for data
non-normality, considering the instrument scores as ordinal and non-scalar variables (L.K. Muthén & B.O. Muthén, 2010). Another strength of this study was the diversity of the sample, which included participants from various Brazilian states with ages ranging from 18 to 88 years.
samples from other populations, including predominantly White college students in the United States (Robitschek et al., 2012), international college students fluent in English in the United States (Yakunina et al., 2013), and Turkish (Yalçın & Malkoç, 2013), Chinese (Yang & Chang, 2014), and Afro descendent North American college students (I.K. Weigold et al., 2014). Although a first-order four-factor structure was achieved, modification indexes consistently showed error covariance between items 2 (‘I can tell when I am ready to make specific changes in myself’) and 3 (‘I know how to make a realistic plan to change myself’) and 6 (‘I ask for help when I try to change myself’ and 14 (‘I actively seek help when I try to change myself’).
A qualitative observation of these item pairs suggests that the items were written in a similar fashion, which may have
caused a content overlap between them. Error covariance
of items 6 and 14 was also observed in an Afro descendent North American sample (I.K. Weigold et al., 2014) and in
a predominantly Asian international college student sample
(Yakunina et al., 2013). Those samples share collectivist values in their culture, which may cause a pattern of error covariance. Collectivist cultures value their communities, family unity, and member interdependence. Those values
may foster the development of an interdependent self
(Beilmann & Realo, 2012).
The PGI dimensions showed correlations of high magnitude, as observed in other studies (Robitschek et al., 2012; Yakunina et al., 2013; Yang & Chang, 2014). The effect size of relationships between readiness for change
with planfulness and using resources with intentional
behavior showed a large magnitude. These patterns of
associations evidence the cognitive and behavioral pillars
of PGI, strengthening the multifactorial structure of the PGI construct (Robitschek et al., 2012; I.K. Weigold, Porfeli, & A. Weigold, 2013).
The associations of using resources with the other PGIS-II dimensions in the Brazilian sample showed higher values than the correlations of using resources with other PGIS-II factors observed in other samples (Robitschek et al., 2012; Yakunina et al., 2013; Yang & Chang, 2014). This different
pattern of relationships for using resources may result
from features of Brazilian culture. In general, Brazilians are more emotionally expressive and action-oriented than other groups (e.g., North-American and Asian populations; Fernández, Carrera, Sánchez, Paez, & Candia, 2002). These characteristics of the Brazilian population (e.g.,high
expressiveness and action-oriented behaviors) may cause
these different patterns for using resources with the other
PGIS-II dimensions.
Another important difference in the Brazilian sample was that the mean scores for participants on the four PGI dimensions were high. The mean levels of intentional behavior and using resources suggested a ceiling effect (Table 4). It is possible that the ceiling effects reflect actual highly
developed skills of using resources and intentional behavior
The limitations of this study are the exclusive use of self-report instruments and a non-representative sample. The use
of a non-representative sample may have biased the results.
The use of a convenience sampling technique increases the
probability that participants who were willing to voluntarily collaborate might be the people who are most engaged in the
process of self-improvement and therefore, present higher levels of well-being. Also, the absence of a clinical sample narrows the generalizability of the study results. Further studies aiming to replicate and advance our findings are required. The
use of a longitudinal design may also strengthen the knowledge
of how PGI skills impact other aspects of well-being.
The major contribution of this study was to present evidence on the validity of the Brazilian version of the PGIS-II. Our results demonstrated the adequacy of the construct validity of the measure, suggesting its possible use in future studies. The use of PGIS-II to assess personal growth skills may help researchers to identify to what extent cognitive and
behavioral skills impact the process of self-improvement.
References
Asparouhov, T., & Muthén, B. (2009). Exploratory structural equation modeling. Structural Equation Modeling: A Multidisciplinary Journal, 16(3), 397-438.
doi:10.1080/10705510903008204
Asparouhov, T., & Muthén, B. (2010). Multiple imputation with Mplus: Version 2. Retrieved from http://statmodel2.
com/download/Imputations7.pdf
Bastianello, M. R., Pacico, J. C., & Hutz, C. S. (2014). Optimism, self-esteem and personality: Adaptation and validation of the Brazilian Version of the Revised Life Orientation Test (LOT-R). Psico-USF, 19(3), 523-531.
doi:10.1590/1413-827120140190030
Beilmann, M., & Realo, A. (2012).
Individualism-collectivism and social capital at the individual level.
Trames, 16(3), 205-217. doi:10.3176/tr.2012.3.01
Borsa, J. C., Damásio, B. F., & Bandeira, D. R. (2012).
Cross-cultural adaptation and validation of psychological instruments: Some considerations. Paidéia (Ribeirão Preto), 22(53), 423-432. doi:10.1590/S0103-863X2012000300014
Damásio, B. F., & DeSousa, D. A. (2015). Análise fatorial confirmatória multigrupo: Descrição e aplicação no software Mplus [Multigroup confirmatory factor analysis: Description and application in Mplus software]. In M. C. R. Silva, D. Bartholomeu, C. M. M. Vendramini, & J. M. Montiel (Orgs.), Aplicações de métodos estatísticos avançados à avaliação psicológica e educacional
(pp. 175-192). São Paulo, SP: Vetor.
Damásio, B. F., & Koller, S. H. (2015). Meaning in life questionnaire: Adaptation process and psychometric properties of the Brazilian version. Revista Latinoamericana de Psicología, 47(3), 185-195.
doi:10.1016/j.rlp.2015.06.004
Diener, E., Emmons, R. A., Larsen, R. J., & Griffin, S. (1985). The satisfaction with life scale. Journal of Personality Assessment, 49(1), 71-75. doi:10.1207/
s15327752jpa4901_13
Fernández, I., Carrera, P., Sánchez, F., Paez, D., & Candia, L. (2000). Differences between cultures in emotional verbal
and non-verbal reactions. Psicothema, 12(Supl. 1),
88-92. Retrieved from https://repositorio.uam.es/bitstream/ handle/10486/669180/differences_fernandez_p_2000. pdf?sequence=1
Freitas, C. P. P., Damásio, B. F., Tobo, P. R., Kamei, H. H., & Koller, S. H. (2016). Systematic review about personal
growth initiative. Anales de Psicología, 32(3), 770-782.
doi:10.6018/analesps.32.3.219101
Gouveia, V. V., Milfont, T. L., Fonseca, P. N., & Coelho, J. A. P. M. (2009). Life satisfaction in Brazil: Testing the
psychometric properties of the Satisfaction With Life Scale
(SWLS) in Five Brazilian Samples. Social Indicators Research, 90(2), 267-277. doi:10.1007/s11205-008-9257-0
Hayton, J. C., Allen, D. G., & Scarpello, V. (2004). Factor retention decisions in exploratory factor analysis: A
tutorial on parallel analysis. Organizational Research Methods, 7(2), 191-205. doi:10.1177/1094428104263675
Instituto Brasileiro de Geografia e Estatística. (2010). Censo
Demográfico 2010: Características da população e
dos domicílios - Resultados do Universo [Census 2010:
Population characteristics and household - Universe
Results]. Rio de Janeiro, RJ: IBGE.
Muthén, L. K., & Muthén, B. O. (2010). Mplus: Statistical analysis with latent variables. User’s guide. Los Angeles,
CA: Muthén & Muthén.
Robitschek, C. (1998). Personal growth initiative: The
construct and its measure. Measurement and Evaluation in Counseling and Development, 30(4), 183-198.
Robitschek, C., Ashton, M. W., Spering, C. C., Geiger, N., Byers, D., Schotts, G. C., & Thoen, M. A. (2012).
Development and psychometric evaluation of the Personal
Growth Initiative Scale-II. Journal of Counseling Psychology, 59(2), 274-287. doi:10.1037/a0027310
Scheier, M. F., Carver, C. S., & Bridges, M. W. (1994). Distinguishing optimism from neuroticism (and trait anxiety, self-mastery, and self-esteem): A reevaluation of the Life Orientation Test. Journal of Personality and Social Psychology, 67(6), 1063-1078.
doi:10.1037/0022-3514.67.6.1063
Steger, M. F., Frazier, P., Oishi, S., & Kaler, M. (2006). The meaning in life questionnaire: Assessing the presence of
Steger, M. F., Shin, J. Y., Shim, Y., & Fitch-Martin, A. (2013). Is meaning in life a flagship indicator of well-being? In A. S. Waterman (Ed.), The best within us: Positive psychology perspectives on eudaimonia (pp. 159-182).
Washington, DC: American Psychological Association. Weigold, I. K., Porfeli, E. J., & Weigold, A. (2013).
Examining tenets of personal growth initiative using the Personal Growth Initiative Scale-II. Psychological Assessment, 25(4), 1396-1403. doi:10.1037/a0034104
Weigold, I. K., Weigold, A., Russell, E. J., & Drakeford, N. M. (2014). Examination of the psychometric properties of the Personal Growth Initiative Scale-II in African
American college students. Assessment, 21(6), 754-764.
doi:10.1177/1073191114524019
Yakunina, E. S., Weigold, I. K., & Weigold, A. (2013a).
Personal growth initiative: Relations with acculturative
stress and international student adjustment. International Perspectives in Psychology: Research, Practice, Consultation, 2(1), 62-71. doi:10.1037/a0030888
Yakunina, E. S., Weigold, I. K., Weigold, A., Hercegovac, S., & Elsayed, N. (2013b). International Students’ Personal and Multicultural Strengths: Reducing Acculturative Stress and Promoting Adjustment. Journal of Counseling & Development, 91(2), 216– 223.
doi:10.1002/j.1556-6676.2013.00088.x
Yalçın, İ., & Malkoç, A. (2013). Adaptation of Personal Growth Initiative Scale- II to Turkish and investigation of
psychometric properties. The Journal of Psychiatry and Neurological Sciences, 26(3), 258-266.
Yang, H., & Chang, E. C. (2014). Examining the structure, reliability, and validity of the Chinese Personal Growth Initiative Scale–II: Evidence for the importance of
intentional self-change among Chinese. Journal of
Personality Assessment, 96(5), 559-566. doi:10.1080/00
223891.2014.886256
Clarissa Pinto Pizarro Freitas is a Professor of Pos-Graduation in Psychology of Salgado de Oliveira University.
Bruno Figueiredo Damásio is a Professor of the Department
of Psychometrics of the Institute of Psychology of the Federal University of Rio de Janeiro.
Helder Hiroki Kamei is a Professor of Pos-Graduation in
Positive Psychology of IPOG and Researcher of Natura Innovation - Advanced Research in Sciences of Well-being.
Patricia Renovato Tobo is a Manager of Natura Innovation -
Advanced Research in Sciences of Well-being.
Sílvia Helena Koller is a Professor in Post-Graduate Program in Psychology of the Federal University of Rio Grande do Sul
and Researcher of Optentia Research Focus Area -
North-West University, Vanderbijlpark, South Africa.
Christine Robitschek is a Associate Professor in Psychology
Department of the Texas Tech University and Coordinator of Personal Growth Initiative Lab.
Received: Jun. 22, 2015 1st Revision: Nov. 18, 2015
Approved: Jun. 07, 2016
How to cite this article:
Freitas, C. P. P., Damásio, B. F., Kamei, H. H., Tobo, P. R., Koller, S. H., & Robitschek, C. (2017). Personal Growth Initiative Scale - II: Adaptation and Psychometric Properties of the Brazilian Version. Paidéia (Ribeirão Preto), 28, e2806.