Abstract
Objectives: To identify dietary patterns in pre-school children and to investigate its determinants.
Methods: Cross-sectional study nested in a cohort born between 2004 and 2005 in the municipality of Diamantina, state of Minas Gerais, Brazil. The instrument used to explore the dietary patterns was a frequency questionnaire for food consumption. Factor analysis was used for the identiication of the dietary patterns. The study also assessed personal and socioeconomic data and anthropometric measurements of 232 preschoolers in the period between July 2009 and July 2010. The determinants of food patterns were identiied by logistic regression.
Results: Three patterns were obtained, which were called: “mixed diet,” “snack,” and “unhealthy.” The children of mothers with low education are more likely (odds ratio – OR = 3.80; conidence interval 95% – 95%CI = 1.90‑7.60) to consume food from the “mixed diet” pattern, and less likely (OR = 0.31; 95%CI = 0.15‑0.61) to consume food from the “snack” pattern, while those with higher per capita income are more likely to consume food from the “unhealthy” pattern (OR = 2.43; 95%CI = 1.13‑5.24).
Conclusion: Three dietary patterns were identiied in the studied population, which were determined by the level of maternal education and per capita income.
J Pediatr (Rio J). 2012;88(2):129-36: Dietary patterns, preschoolers, factor analysis, cross-sectional studies.
O
riginala
rticleJornal de Pediatria
Copyright © by Sociedade Brasileira de Pediatria
129 Introduction
Dietary patterns (DP) represent a general proile of food and nutrient consumption, characterized on the basis of the usual eating habits. Thus, the analysis of dietary patterns may better predict the risk of diseases than the analysis of isolated nutrients or foods, once the joint effect of various nutrients involved in a DP would be better identiied.1
DPs can be deined as a priori or a posteriori. When foods are grouped on the basis of previous knowledge of
the combination with healthy outcomes, according to the constitution of a healthy diet or nutritional recommendations, it is said that the pattern was established a priori.2 Diet
variables are normally quantiied and added with the aim to compose a level to assess the quality of the diet.
The dietary patterns deined a posteriori are obtained by statistical analysis, according to the correlations between the variables of the food questionnaires. Factor analysis
Preschool children dietary patterns and associated factors
Luciana N. Nobre,1 Joel A. Lamounier,2 Sylvia C. C. Franceschini3
1. Doutora. Departamento de Nutrição, Universidade Federal dos Vales do Jequitinhonha e Mucuri (UFVJM), Diamantina, MG, Brazil. 2. Doutor. Departamento de Medicina, Universidade Federal de São João del-Rei (UFSJ), Divinópolis, MG, Brazil.
3. Doutora. Departamento de Nutrição, Universidade Federal de Viçosa (UFV), Viçosa, MG, Brazil. No conflicts of interest declared concerning the publication of this article.
Financial support: Fundação de Amparo à Pesquisa do Estado de Minas Gerais (Fapemig) (processo: APQ-00428-08).
Suggested citation: Nobre LN, Lamounier JA, Franceschini SC. Preschool children dietary patterns and associated factors. J Pediatr (Rio J). 2012;88(2):129-36. Manuscript submitted Aug 22 2011, accepted for publication Nov 16 2011.
empirically derive patterns. Factorial analysis converts data into patterns, based on the correlations among the food items, while the cluster analysis employs different individual intake means to perform this transformation.2 For the
extraction of factors performed in the irst analysis, a score is calculated for each subject in the various factors.3
With increased income, the growth of the food industry and the expansion of unhealthy food advertisements in the media, diets rich in complex carbohydrates and iber are being replaced by diets with higher energy density, rich in sugars and lipids.4 According to Millen et al.,5 modern
industrialized societies seem to adhere to this dietary pattern, which, combined with a sedentary lifestyle, has resulted in increased obesity and non-communicable chronic diseases.
Some researches have identiied this type of DP in children6‑9 and adolescents,10,11 which has been associated
to the following characteristics: lower level of maternal education,6,9 longer period spent watching Television,9,11
white-skinned children, larger number of siblings,6 smoking
parents, single parents and, conversely, with families of higher income.11 Oellinggrath et al.8 observed that this
kind of pattern, besides more frequent among children of less educated mothers, it was also more prevalent among children of overweight mothers.
Considering the above aspects, the present study aimed to identify preschoolers’ DPs in the municipality of Diamantina, state of Minas Gerais (MG), and to investigate its determinants.
Methods
Type and location of the study
Cross-sectional study nested in a cohort of children born alive between September 2004 and July 2005 and living in the municipality of Diamantina, which had as an objective the growth and development follow‑up in the irst years of life.12 The newborns were contacted in their irst weeks of
life at their homes. The recruitment was conducted based on records of Born Alive Declarations of two hospitals in the municipality of Diamantina.
The seat of a municipality represents the urban area where the municipal government is established, i.e. the City Hall and the City Council.13
Diamantina is a municipality located at the top of Alto Vale do Jequitinhonha, in the state of Minas Gerais, Brazil. It presents a mortality rate among children younger than 1 year of 32.8/1,000, literacy rate of 83,4%, human development index (HDI) of 0.748 and HDI income of 0.752. Among households, 90.76% are supplied with clean water, 70.7% with sanitary sewer and 69.67% with garbage collection.14
follow-up of children is shown in Figure 1. For this research, preschoolers were recruited from the addresses used in the above cohort. The exclusion criteria were previously deined (Figure 1); to be included in this study, preschoolers had to be eligible for the cohort study and have the permission of the parents.
Subjects
The study included children from the cohort mentioned above. Data collection occurred in households of children and in the premises of the Universidade Federal dos Vales do Jequitinhonha e Mucuri (UFVJM) in the period of 2009 to July 2010 and was conducted by four nutritionists and a student from the Course of Nutrition at UFVJM.
For the identiication of a DP, it is recommended that the number of individuals should be equal or greater than ive for each food/food group on the frequency questionnaire of Food Consumption (FFQ).15 In this study,
24 food groups were identiied; thus, 120 individuals would be necessary (5 x 24 groups). As 232 preschoolers were studied, the sample was considered satisfactory for the present research.
Anthropometric indicator
Weight was measured using a portable electronic digital scale, with a maximum capacity of 150 kg and divisions of 50 g; and height, on a stadiometer with accuracy of 0.1 cm. These measurements were taken according to protocols recommended by Jelliffe,16 in a lab of the Department of
Nursing of UFVJM, in the morning, with fasting children. The cutoff z‑score ≥ 1 identiied overweight children according to body mass index (BMI)/age.17 The softwares
WHO Antro 2005 version 2.0.1 and WHO Antro Plus 2009 version 3 were used to identify the z-score of children.
Mothers of the preschoolers were also assessed for weight and height to obtain the BMI and the body fat measured by bioelectrical impedance analysis (BIA). These evaluations were performed in the morning, in one only occasion, and were measured according to the standardization of Lohman et al.18 and of the manufacturer of the BIA
appliance. Value of BMI ≥ 25 kg/m2 and percentage of
body fat (%BF) greater than 32% were considered high, respectively.18,19 Classiication as overweight occurred
when BMI and %BF were simultaneously high.
Dietary pattern
The DP of this research were identiied a posteriori through a FFQ developed by Sales et al.20 and adapted to
Figure 1 - Flowchart of the cohort formation and follow-up until 5 years old – Diamantina, state of Minas Gerais, 2011
The frequency of consumption of the foods or food groups were summarized in a single value for each preschooler, according to the methodology used by Neumann et al.,21
whose formula for obtaining this measure is:
(Σ of frequency of consumption of foods contained in the food group) / Number of foods from the group * maximum frequency of consumption in the FFQ used
The DPs were presented as a discrete variable, which was obtained by the sum of the frequencies of consumption of foods contained in each DP, and, then, were categorized in dichotomous variable (0 and 1), using the categories of high (1) and low consumption (0) to values above or below the irst quartile, respectively.
Other information
It was also collected information about monthly family income, maternal education and time spent by the child watching television. To this end, a questionnaire was applied to the mother or caretaker of the preschoolers in their homes.
Statistical analysis
For identiication of the DPs, the factor analysis methodology of principal components analysis (PCA) was applied in the answers obtained from the FFQ. Before the
calculation of factor analysis, the coeficient of Kaiser‑ Mayer‑Olkin (KMO) was estimated, and the Bartlett’s test of sphericity was applied to assess the quality of the correlations between variables. The PCA, followed by Varimax orthogonal rotation, was performed to assess the exploratory factorial structure of the FFQ, in which were considered the factor loadings above 0.30. The number of factors to extract was deined according to the screen plot variance of the number of components, in which the points, in the steepest decline, indicated the appropriate number of components (DP) to retain.22 The
internal consistency of the dimensions of the FFQ was also evaluated, and a level of Cronbach’s alpha ≥ 0.60 was considered acceptable.22
The analysis of logistic regression was used to assess the determinants of the DP. The variables that presented value p < 0.2 in bivariate analysis were included in the multivariate analysis, and those with p-value < 0.05 in multivariate analysis were considered to be associated with the DP. The database was built in Excel and analyzed in the Statistical Package for Social Sciences software version 19.0 for Windows.
Group or food Food present in the food frequency questionnaire
Beef and Pork Meatball, cooked beef, pork/chicken sausage, steak and ground beef Chicken and Fish Roasted chicken, stewed chicken, fried or baked ish
Eggs Boiled or fried eggs
Baked beans Baked beans
Milk and derivatives Cow milk, liquid and powder, mozzarella, Minas cheese, liquid chocolate milk and yogurt Rice and roots Angu, rice, boiled yam, boiled manioc, fried manioc, pasta and manioc lour
Farinaceous Neston, Farinha láctea cereal and cereal
Pasta and pastry Pizza, lasagna, chicken croquettes and meat pastry
Sweet and savory biscuits Cream cracker, manioc lour biscuit, maizena biscuits and clube social Cakes Corn lour cake, basic cake and chocolate cake
Stuffed cookies Stuffed cookies
Breads Cheese bread, French bread and bred loaf
Leafy Lettuce, steamed cabbage
Vegetables Eggplant, tomato, pumpkin, cooked carrots, boiled beetroot, steamed green beans, cooked chayote, grated raw carrot, potato, fried sweet potato, sweet potato mash, baked sweet potato, vegetable salad with mayonnaise, vegetable salad without mayonnaise
Fruits Watermelon, guava, tangerine, orange, pineapple, banana, apple, papaya, pear and grape Sweets/desserts Candy, little cashew, dulce de leche/piece, gelatin and guava jelly
Coffee/infusions Teas, coffee
Sodas Soda
Natural juices Juice concentrates and natural juices Artiicial juices Package artiicial juices
Margarine Butter, margarine
Chocolate powder Nescau/Toddy
High-Fat snacks Potato chips, salted popcorn, Cheetos
Sweets Lollipop, candy, gum, sweet popcorn (package)
Results
It can be observed from Figure 1, that there was a loss of 49 preschoolers. To avoid signiicant losses that could invalidate the present study, the choice was to study the preschoolers eligible for the cohort and not only those who were followed in the follow‑up study in their irst years of life, since some children were lost during follow-up.
The values of tests to evaluate the correlation between food items and the appropriateness of using factor analysis to identify the DP were satisfactory and appropriate for the PCA (KMO = 0.697, Bartlett’s test of sphericity = χ² (276) = 888.06 and p = 0.000, determining the correlation matrix = 0.018).
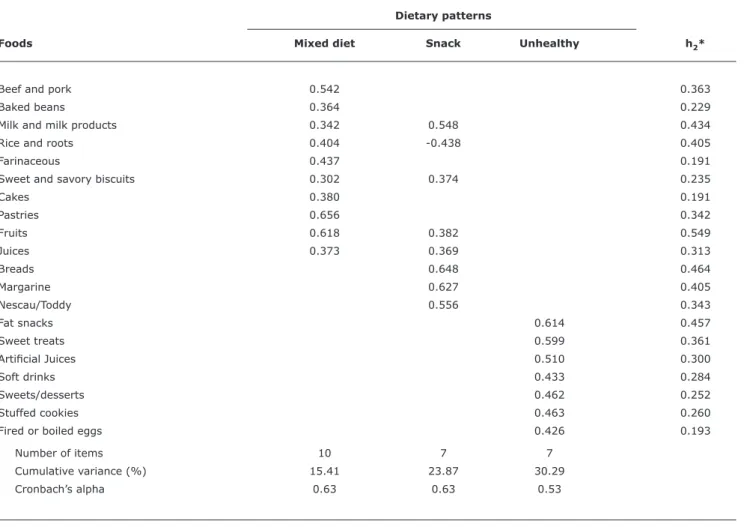
The PCA extracted eight factors with latent roots greater than 1, which explained 56.26% of the variance. However, considering that the screen plot identiied three plot points in the steepest decline, the appropriate number of components to retain was three, which were those which presented largest
combined variance. The extraction of these components explained 30.30% of the variance after the rotation of factors. Of the 24 food items tested, 20 are valid and with saturation values exceeding 0.30 (Table 2).
The indexes relating to the internal consistency (Cronbach’s alpha ≥ 0.6) show that, for the irst two patterns, it was guaranteed an acceptable level of accuracy of measurement of these DPs, thereby conirming, an internal consistence of the FFQ used. The Cronbach’s alpha value for the third pattern, however, was lower than 0.6, what demonstrates that it was not possible to guarantee the internal consistence for this pattern.
Table 2 - Distribution of factor loadings for dietary patterns of preschool children – Diamantina (MG), 2009‑2010
Absolute values lower than 0.30 have been removed for simplification.
* h2 = commonality is the measure of how much variance is explained by the factors derived by factor analysis. Dietary patterns
Foods Mixed diet Snack Unhealthy h2*
Beef and pork 0.542 0.363
Baked beans 0.364 0.229
Milk and milk products 0.342 0.548 0.434
Rice and roots 0.404 -0.438 0.405
Farinaceous 0.437 0.191
Sweet and savory biscuits 0.302 0.374 0.235
Cakes 0.380 0.191
Pastries 0.656 0.342
Fruits 0.618 0.382 0.549
Juices 0.373 0.369 0.313
Breads 0.648 0.464
Margarine 0.627 0.405
Nescau/Toddy 0.556 0.343
Fat snacks 0.614 0.457
Sweet treats 0.599 0.361
Artiicial Juices 0.510 0.300
Soft drinks 0.433 0.284
Sweets/desserts 0.462 0.252
Stuffed cookies 0.463 0.260
Fired or boiled eggs 0.426 0.193
Number of items 10 7 7
Cumulative variance (%) 15.41 23.87 30.29
Cronbach’s alpha 0.63 0.63 0.53
higher percentage of variance explanation, and was considered the one that best represented the food intake of the sample analyzed.
Table 3 presents the result of the bivariate and multivariate analysis of factors associated with the DPs identiied in this study. In bivariate analysis, children of mothers of lower education and per capita income greater than 1/2 minimum wage presented 4-fold higher chance of consuming more often foods from the “mixed diet” pattern. The permanence of the preschoolers for 4 hours in schools was a protective factor of the “mixed diet” pattern and a risk factor for the consumption of “snack.” In relation to the “unhealthy” pattern, the higher chance of consumption occurred among children with per capita income greater than 1/2 the minimum wage.
Even after controlling the multivariate analysis, the risk effect of higher frequency of consumption of “mixed
diet” DP remained among the children of mothers with low education. Due to the inconsistence of this result with the scientiic literature, it was preferred to perform an analysis stratiied by income and considering whether or not the child attends school.
Table 3 - Gross and adjusted odds ratio and respective conidence intervals according to variables associated to the different types of dietary patterns of preschoolers – Diamantina (MG), 2009‑2010
Dietary patterns
Mixed diet* Snackǁ Unhealthy†
Variable OR 95%CI OR 95%CI OR 95%CI
Bivariate analysis Gender
Male 1 1 1
Female 1.22 0.67‑2.23 0.79 0.44‑1.42 1.01 0.55‑1.87
BMI
Not high 1 1 1
High 0.57 0.24‑1.37 1.29 0.59‑2.83 0.97 0.44‑2.14
Time spent watching TV
< 2 hours 1 1 1
≥ 2 hours 1.06 0.58‑1.95 1.26 0.71‑2.24 1.35 0.74‑2.47
Child attends school
Yes 1 1 1
No 0.86 0.33‑2.27 0.62 0.26‑1.46 0.70 0.28‑1.71
Mother schooling years‡
> 9 years 1 1 1
≤ 9 years 3.93* 1.98‑7.78 0.24* 0.12‑0.46 1.38 0.76‑2.52
Overweight mother
No 1 1 1
Yes 0.52** 0.25‑1.05 1.75** 0.90-3.39 1.15 0.59-2.23
Mother works outside
No 1 1 1
Yes 0.63** 0.34‑1.15 1.62** 0.91‑2.87 1.29 0.70‑2.37
Per capita income§
< 1/2 MW 1 1 1
≥ 1/2 MW 4.07* 1.19‑13.87 0.19* 0.05‑0.67 2.52* 1.18-5.40
People living at home
≤ 4 people 1 1 1
> 4 people 1.05 0.58‑1.89 1.25 0.71‑2.21 1.69** 0.92-3.13
Multivariate analysis Years of maternal study‡
> 9 years 1 1
≤ 9 years 3.80 1.90‑7.60 0.31 0.15‑0.61 –
Per capita income§
< 1/2 MW – – 1
≥ 1/2 MW 2.43 1.13‑5.24
‡ Value refers to the median years of schooling. § Value refers to the minimum wage of R$ 510.00.
*,** Significant, respectively, of levels of 5 and 20% of probability of the chi-square test. Multivariate analysis:
*,ǁ Analysis adjusted for child’s time in school, excessive maternal weight, maternal work outside the household and per capita income. † Analysis adjusted to the number of household members.
95%CI = 95% confidence interval; BMI = body mass index; MW = minimum wage; OR = odds ratio. with less education consumed foods from this DP less
frequently. As for the “unhealthy” DP, preschoolers children of families with per capita income exceeding 1/2 the minimum wage presented a 2-fold higher chance of consuming more frequently foods from this DP, when compared to the preschoolers of lower income.
This trend was observed considering that, among the three dietary patterns identiied in this research, one was classiied as “snack” and the other as “unhealthy”, both with foods rich in lipids and sugars.
Among the Brazilian publications on identiication of infant-juvenile DPs, based on the application of statistical models, only two were found.7,10 The irst7 involved preschoolers treated at a basic health care unit in Rio de Janeiro, state of Rio de Janeiro and aimed to asses consumption pattern and risk factors for cardiovascular diseases (CVD). Six groups (DP) were identiied, ive classiied as risk patterns for CVD. The second10 used the
PCA to identify DP of adolescent in the municipality of São Paulo, state of São Paulo, and assess their metabolic consequences. Authors identiied three patterns: traditional, in transition and fast food. The three DP were considered obesogenic, but the fast food seems to be more atherogenic and to promote arterial hypertension.
Some international publications about this theme were developed with children,6,8 adolescents11 and with people
at different stages of life.9 Northstone & Emmett6 studied English children aged 4 and 7 and identiied three dietary patterns: unhealthy, traditional and conscious healthy. Oellingrath et al.8identiied four among Norwegian children
aged 9 and 10: snack, sweets/processed foods, Norwegian variety and diet food.
Ambrosini et al.11 identiied two DP among adolescents,
which were called “western” – consisting of foods such as sodas, candy, French fries, reined grains, whole dairy products and processed meats – and “healthy” – characterized by high consumption of whole grains, fruits, vegetables, and ish.
Five DPs of children, adolescents and young adults in Spain were identiied by Arancetaet al.,9 which were
called: rich in meet, rich in protein, snacks, healthy and little nutritive. The “snack” pattern was characterized by a more frequent and higher consumption of products such as breads, cakes, and biscuits, sweets, snacks and soft drinks. The “healthy” pattern was characterized by a more frequent consumption of fruits, vegetables and ish.
It is observed that the DPs identiied in this study are similar to the mentioned researches. This result is in line with the study of Caetano et al.,24 which identiied
high frequency of inappropriate eating practices and dietary intake in young infants; and with the research on household budget of 2002,25 which found an increase
in the consumption of sugar, total and saturated fats, processed products such as cookies and soda, a reduction in the consumption of rice and beans and insuficient consumption of fruits and vegetables. The unhealthy foods present in the “unhealthy” DP in this research are relatively inexpensive and very accepted by children; they may; still, represent social status, and that may be fostering their consumption.
On the determinants of the “unhealthy” patterns, they have been associated to the lower level of education of mothers,6,8,9 to a longer period of time watching
television,9,11,26 to male children,26 to white-skinned
children, to a greater number of siblings,6 to children of overweight mothers,8 to smoking parents, to single parents
and, inversely, to families of higher income.11
The traditional pattern, similar to the typically Brazilian pattern of “mixed diet,” was associated to the female sex,6,9,11
to children with non vegetarian families and whose mothers had a partner,8 to higher maternal education,9,10,26 to
well-structured families, with married parents, and inversely, associated with the time spent watching television11 and
to the longer duration of sleep.26
The performance of the stratiied analysis, aiming to better understand why in this research, the low maternal education was a determinant factor of higher frequency of consumption of the “mixed diet” dietary pattern, showed that income and the school attendance have a modiication effect in this variable, i.e., it is not exactly the low level of maternal education that has this effect. This result is consistent with a research,27 which identiied that lower income reduces the access to processed foods, often unhealthy and costly, and that attending schools favors the consumption of foods from the different dietary groups and sometimes with a better energy distribution.28 Out of preschoolers that
attend schools, 89.89% study in municipal schools, which are establishments that offer healthy meals planned by nutritionists. These factors, together, may also justify why children of mothers with lower education consume less often foods from the “snack” DP.
The fact that a higher per capita income was a determinant of the “unhealthy” DP denotes that families with such characteristics are acquiring more often less healthy foods, reined and ready for consumption, which may inluence the medium and long-term development of disorders such as excessive weight, anemia, and dyslipidemia.
It is important to highlight that the DP better express the complexity involved in the act of eating, since people do not eat isolated foods or nutrients; besides, they can better support proposals of effective measures to promote health through feeding.29 Sichieri et al.30 also mention that
the pattern of food consumption, more than the absence of speciic nutrients in the diet, express real situations of food availability and different conditions of inclusion or not of the people in different social settings.
16. Jelliffe DB. Evaluación del estado de nutrición de la comunidad. Geneva: Organización Mundial de la Salud; 1968.
17 WHO Multicentre Growth Reference Study Group. WHO Child Growth Standards: length/height-for-age, for-age, weight-for-length, weight-for-height and body mass index-for-age: methods and development. Geneva: World Health Organization; 2006.
18. Lohman TG, Roche AF, Martorell R. Anthropometric standardization reference manual. Abrigged edition. Champaign: Human Kinetics Books; 1991.
19. World Health Organization (WHO). Obesity: preventing and managing the global epidemic. Geneva: Report of a WHO Consultation on Obesity; 1998.
20. Sales RL, Silva MM, Costa NM, Euclydes MP, Eckhardt VF, Rodrigues CM, et al. Desenvolvimento de um inquérito para avaliação da ingestão alimentar de grupos populacionais. Rev Nutr. 2006;19:539‑52.
21. Neumann AI, Martins IS, Marcopito LF, Araujo EA. Dietary patterns associated with risk factors for cardiovascular disease in a Brazilian city. Rev Panam Salud Publica. 2007;22:329‑39.
22. Castell RB. The scree test for number of factors. Multivariate Behav Res. 1966;1:245‑76.
23. World Health Organization (WHO). Diet, nutrition and the prevention of chronic diseases. World Health Organ Tech Rep Ser. 2003;916:i‑149.
24. Caetano MC, Ortiz TT, Silva SG, Souza FI, Sarni RO. Complementary feeding: inappropriate practices in infants. J Pediatr (Rio J). 2010;86:196‑201.
25. Instituto Brasileiro de Geograia e Estatística (IBGE). Pesquisa de orçamentos familiares 2002-2003: primeiros resultados: Brasil e grandes regiões. Rio de Janeiro: IBGE; 2004.
26. Moreira P, Santos S, Padrão P, Cordeiro T, Bessa M, Valente H, et al. Food patterns according to sociodemographics, physical activity, sleeping and obesity in Portuguese children. Int J Environ Res Public Health. 2010;7:1121‑38.
27. de Aquino R de C, Philippi ST. Association of children’s consumption of processed foods and family income in the city of São Paulo,
Brazil. Rev Saude Publica. 2002;36:655‑60.
28. Bernardi JR, Cezaro CD, Fisberg RM, Fisberg M, Vitolo MR. Estimation of energy and macronutrient intake at home and in the kindergarten programs in preschool children. J Pediatr (Rio J). 2010;86:59‑64.
29. Olinto MT. Padrões alimentares: análise de componentes principais. In: Kac G, Sichieri R, Gigante DP, orgs. Epidemiologia nutricional. Rio de Janeiro: Editora Fiocruz/Atheneu; 2007. p. 213‑25. 30. Sichieri R, Castro JF, Moura AS. Factors associated with dietary
patterns in the urban Brazilian population. Cad Saude Publica. 2003;19:S47‑53.
Correspondence: Luciana Neri Nobre
Departamento de Nutrição, Universidade Federal dos Vales do Jequitinhonha e Mucuri (UFVJM)
Campus JK, Rodovia MGT 367, Km 583, no 5000, Alto da Jacuba
CEP 39100-000 – Diamantina, MG – Brazil Fax: +55 (38) 3532.6000
E-mail: [email protected] References
1. Hu FB. Dietary pattern analysis: a new direction in nutritional epidemiology. Curr Opin Lipidol. 2002;13:3-9.
2. Newby PK, Tucker KL. Empirically derived eating patterns
using factor or cluster analysis: a review. Nutr Rev.
2004;62:177‑203.
3. Togo P, Osler M, Sørensen TI, Heitmann BL. Food intake patterns
and body mass index in observational studies. Int J Obes Relat
Metab Disord. 2001;25:1741‑51.
4. Drewnowski A. Nutrition transition and global dietary trends. Nutrition. 2000;16:486‑7.
5. Millen BE, Quatromoni PA, Pencina M, Kimokoti R, Nam BH, Cobain S, et al. Unique dietary patterns and chronic disease risk proiles of adultmen: the Framingham nutrition studies. J Am Diet Assoc. 2005;105:1723‑34.
6. Northstone K, Emmett P. Multivariate analysis of diet in children at four and seven years of age and associations with
socio-demographic characteristics. Eur J Clin Nutr. 2005;59:751‑60.
7. Gama SR, Carvalho MS, Chaves CR. Childhood prevalence of cardiovascular risk factors. Cad Saude Publica. 2007;23:2239‑45.
8. Oellingrath IM, Svendsen MV, Brantsaeter AL. Eating patterns and overweight in 9- to 10-year-old children in Telemark
County, Norway: a cross-sectional study. Eur J Clin Nutr.
2010;64:1272‑9.
9. Aranceta J, Pérez-Rodrigo C, Ribas L, Serra-Majem L. Sociodemographic and lifestyle determinants of food patterns
in Spanish children and adolescents: the enKid study. Eur J Clin
Nutr. 2003;57:S40‑4.
10. Dishchekenian VR, Escrivão MA, Palma D, Ancona-Lopez F, Araújo EA, Taddei JA. Padrões alimentares de adolescentes obesos e diferentes repercussões metabólicas. Rev Nutr. 2011;24:17‑29. 11. Ambrosini GL, Oddy WH, Robinson M, O’Sullivan TA, Hands BP,
de Klerk NH, et al. Adolescent dietary patterns are associated with lifestyle and family psycho-social factors. Public Health Nutr. 2009;12:1807‑15.
12. Lessa AC. Alimentação e crescimento no primeiro ano de vida: um estudo de coorte [tese]. Salvador: Universidade Federal da Bahia; 2010.
13. Ferreira AB. Novo dicionário da língua portuguesa. 2ª ed. Rio de Janeiro: Nova Fronteira; 1986.
14. Wikipédia [internet]. Diamantina. http://pt.wikipedia.org/wiki/ Diamantina. Access: 01/01/2012.