Repositório ISCTE-IUL
Deposited in Repositório ISCTE-IUL: 2018-08-10
Deposited version: Post-print
Peer-review status of attached file: Peer-reviewed
Citation for published item:
Machado, M. J. C. V. & Fortunato, J. A. G. (2018). Sustainable management methods: performance assessment in large companies. International Journal of Business Innovation and Research. 16 (4), 471-485
Further information on publisher's website: 10.1504/IJBIR.2018.093522
Publisher's copyright statement:
This is the peer reviewed version of the following article: Machado, M. J. C. V. & Fortunato, J. A. G. (2018). Sustainable management methods: performance assessment in large companies.
International Journal of Business Innovation and Research. 16 (4), 471-485, which has been published in final form at https://dx.doi.org/10.1504/IJBIR.2018.093522. This article may be used for non-commercial purposes in accordance with the Publisher's Terms and Conditions for self-archiving.
Use policy
Creative Commons CC BY 4.0
The full-text may be used and/or reproduced, and given to third parties in any format or medium, without prior permission or charge, for personal research or study, educational, or not-for-profit purposes provided that:
• a full bibliographic reference is made to the original source • a link is made to the metadata record in the Repository • the full-text is not changed in any way
The full-text must not be sold in any format or medium without the formal permission of the copyright holders. Serviços de Informação e Documentação, Instituto Universitário de Lisboa (ISCTE-IUL)
Av. das Forças Armadas, Edifício II, 1649-026 Lisboa Portugal Phone: +(351) 217 903 024 | e-mail: [email protected]
1
Sustainable management methods: performance assessment in large
companies
Maria João Cardoso Vieira Machado*
Instituto Universitário de Lisboa (ISCTE-IUL) Business Research Unit (BRU-IUL)
Avenida Forças Armadas, 1649-026 Lisboa Portugal
Email: [email protected]
*Corresponding author
Joana Alexandra Guerreiro Fortunato
Caixa Geral de Depósitos
SCS - APF-4 – Avaliação e Metodologias de Projetos Avenida João XXI, nº 63. 1000-300 Lisboa
Portugal
Email: [email protected]
Biographical notes: Maria João Cardoso Vieira Machado (PhD in accounting) is an
Assistant Professor of Accounting Department, at the Business School of the Instituto Universitário de Lisboa (ISCTE–IUL). She is also researcher at the Business Research Unit (BRU-IUL), with research interests in management accounting and tourism (see
https://ciencia.iscte-iul.pt/public/person/mjcvm).
Joana Alexandra Guerreiro Fortunato holds a Master in Accounting and carries on her professional activity in the business environment in the accounting area. She worked for the group Caixa Geral de Depósitos, in the direction of Planning and Financial Control, which performs project evaluation functions and support functions in budgetary control. This research is supported by a grant from the Fundação para a Ciência e Tecnologia (UID/GES/00315/2013)
ABSTRACT
The general objective of this study is to contribute to the understanding of the performance evaluation methods used by large companies. As specific objectives we have the following: to identify the methods used and the importance attributed to them; to analyse their implementation process and the level of success given to it. The data collection method used was a survey to the financial managers of the largest companies in Portugal, which resulted in thirty-five valid responses. The main contributions of this study were the associations found between the following variables: the method used and the level of importance assigned to it; the person in charge of implementing the method and training provided to employees; the method used and the degree of success attributed to its implementation; the degree of resistance to change and the degree of success in implementing the performance evaluation method.
Keywords: performance evaluation methods; sustainable management; Balanced
2
1 – INTRODUCTION
The general objective of this study is to contribute to the understanding of the performance evaluation methods used by large companies. As specific objectives, the following were defined: to identify the methods used, and the importance attributed to them; to analyse their implementation process and the level of success given to it. This subject’s relevance is fundamentally justified by two factors. Firstly, because the current line of research on sustainable management practices argues that the performance evaluation methods are an essential management tool to ensure the strategic objectives and the sustainable management of any organization (Chalmeta and Palomero, 2011; Reefke and Trocchi, 2013; Zavodna, 2013; Ellangovan et al., 2014; Priyadharshini et al., 2015; Sweis et al., 2016), which justifies undertaking new studies on the methods used by the companies. Secondly, because the theory considers the Balanced Scorecard as the most innovative performance evaluation method (Kaplan and Norton, 2001; Tung et al., 2011; Modell, 2012; Nunes and Machado, 2014; Karpagam e Suganthi, 2016), which justifies undertaking studies on the importance assigned to it, and the degree of success of its implementation.
The universe analysed is composed by the 500 largest companies in Portugal with email address. Considering that management accounting practices, particularly performance measurement, are essential to support sustainable decisions (Epstein and Widener, 2011), the choice of a large company universe is justified for this study for two reasons: firstly because it is in these organizations that a greater concern exists regarding the quality of management accounting information (Jha and Nanda, 2013); secondly, because larger companies have in general more technical and financial resources, which facilitates the use of more sophisticated management accounting tools (Bremser et al., 2014). The data were collected through surveys sent to the financial manager of the company, which resulted in thirty-five valid responses.
2 – LITERATURE REVIEW
The current line of research on sustainable management practices considers that all organizations have economic, social and environmental responsibilities (Chalmeta and Palomero, 2011). Regarding the economic responsibility, Reefke and Trocchi (2013) consider that the use of performance evaluation methods is a suitable path towards sustainable management, because only with adequate methods are the companies able to meet the current needs of stakeholders without compromising the satisfaction of their future needs (Reefke and Trocchi, 2013). The performance evaluation methods aim is to provide managers with relevant information for decision-making, as well as help them to monitor, coordinate, control and improve the company’s activities (Elg, 2007). The survival of an organization depends on its ability to evaluate current performance, and identify strategies to improve it in the future (Ismail, 2007).
Initially, the performance evaluation methods were based only on financial measures, but in recent decades new methods were created that include both financial and non-financial measures (Ghosh and Wu, 2012; Machado and Simplício, 2016). Managers have declared themselves dissatisfied with the exclusive use of financial measures, stating them to be out of date regarding decision-making as they are based on past
3
events (Cinquini and Tenucci, 2010; Tung et al., 2011). Several companies choose to use a set of financial and non-financial measures, thus providing a better performance picture and identifying the most critical areas of the organization (Kaplan and Norton, 1992). With the use of non-financial measures, the goal is not to achieve short-term financial goals, but a good organizational performance showing good effectiveness in the long run (Zaman, 2004). Non-financial measures have aroused the interest of researchers (Banker and Mashruwala, 2007), and have in recent years gained some relevance in literature due to the dissatisfaction regarding the exclusive use of financial measures (Said et al., 2003). Despite the importance of non-financial measures in organizational performance, there is little empirical evidence regarding the factors influencing their use (Evans et al., 2010). Said et al. (2003) suggest that one of the main motivations for the use of non-financial measures is the idea that only through their use can the company's performance be properly aligned with its strategic goals.
According to Machado and Simplício (2016), the use of a set of financial and non-financial measures, not arranged in a system or structure of their own, is a alternative that cannot be confused with the use of other methods with their own theoretical support, such as the Tableau de Bord, and the Balanced Scorecard.
Currently, great relevance is given to the Balanced Scorecard, but this approach was not welcome in France where the Tableau de Bord has been used for at least 50 years (Bourguignon et al., 2003; Quesado et al., 2012.) The Tableau de Bord is a strategic measurement system, developed by engineers seeking ways to improve the performance of the production process (Quesado et al., 2012). This tool provides managers with a set of indicators that offers them a comprehensive and quick overview of the business evolution, allowing a comparison with the targets previously set (Bourguignon et al., 2003).
In the 90s, Kaplan and Norton created the Balanced Scorecard (Kaplan and Norton, 1992). This management tool is considered by Modell (2012) one of the most influential innovations for management accounting. It was designed to implement and monitor an organizational strategy, using an appropriate mix of financial and non-financial measures (Biggart et al., 2010). According to Kaplan and Norton (1992; 1994), the Balanced Scorecard aggregates a set of financial and non-financial measures, allowing the top managers to have a broader view of the company's business, as well as controlling its development. An essential aspect of this method is the relationship between performance measures and strategic objectives set by top managers (Banker et al., 2004). The Balanced Scorecard combines measures organized into four perspectives: financial, client, internal processes, and learning and growth. The results of each perspective will always be reflected in the financial perspective, because if a company is successful in satisfying its customers, optimizing the internal processes, and remaining innovative, then it will be successful in financial terms (Butler et al., 2011). This method is based on an interconnected set of consistent measures and objectives, incorporating a complex set of cause-effect relationships between the various measures used in the different perspectives (Kaplan and Norton, 1996b, 1996c). A well-constructed Balanced Scorecard should tell the story of the company's strategy through cause-effect relationships between performance measures and the drivers of these performance results (Kaplan and Norton, 1996b, 1996c).
4
Studies made in several countries have very diverse Balanced Scorecard utilization rates, namely: 65% for companies in Bahrain (Juhmani, 2007); 53% for Swedish companies in various industries (Kraus and Lind, 2010); 48% for Brazilian companies (Amorim and Machado, 2015); 35% for the US public sector (Crabtree and DeBusk, 2008); 24% for companies rated as the best to work for in Portugal (Machado and Simplício, 2016); 19% for large Portuguese companies (Quesado and Rodrigues, 2009); 19% for hotels located in Portugal (Nunes and Machado, 2014); 10% for companies in Madeira (Curado and Manica, 2010); 5% for small and medium-sized industrial companies in Portugal (Machado, 2013). On the other hand, empirical studies on the use of the Tableau de Bord are very scarce. Only in recent years have some studies emerged reporting utilization rates for this method, namely: 29% for hotels located in Portugal (Nunes and Machado, 2014); 23% for companies in Madeira (Curado and Manica, 2010); 3% for companies rated as the best to work for in Portugal (Machado and Simplício, 2016); 0% for Brazilian companies (Amorim and Machado, 2015).
Several authors argue that the successful implementation of a performance evaluation method depends on several factors, including: the person in charge of the design and implementation of the method (Kaplan and Norton, 1996a; Malhotra and Temponi, 2010; Machado, 2016); the development of training programs that allow all employees to know the performance evaluation method’s goals (Kaplan and Norton, 2001); the mobilization of all employees for the change process, thus minimizing implementation problems resulting from employees resisting change (Kaplan and Norton, 2001; Spathis and Ananiadis, 2005).
3 – RESEARCH AND METHODOLOGY ISSUES
Based on the literature review and in order to achieve the objectives proposed, we formulated the following research questions:
Research question 1 - What are the performance evaluation method used, and what importance do you attribute to them?
Research Question 2 - What was the performance evaluation method’s implementation process, and what level of success was attributed to it?
The universe of this study was defined by the top 500 companies operating in Portugal in 2014, based on the turnover disclosed. However, due to the difficulty to get in contact with some of the companies, the universe was reduced to 351 companies.
The data collection method used was the online survey. It was sent by email to the company’s financial manager, accompanied by a letter describing the study and including the hyperlink to the website where the survey was housed. The questions placed to the financial managers are focused on two themes: the performance evaluation method used; and various information about the method’s implementation process, namely who was responsible for its design and implementation, whether any training was provided on the implemented method, what degree of success was attributed to the implementation process, and how were the company's employees characterized in terms of resistance to change.
5
In order to get a higher response rate, we made two mailings and received 39 responses, 4 of which were excluded because they were incomplete, which represents a response rate of approximately 11%.
4 – RESULTS ANALYSIS AND DISCUSSION
4.1 – Importance given to the performance evaluation method used
Table 1 shows the data collected regarding the performance evaluation method used by the companies. Only 20% of the companies use the method considered by the theory as the most appropriate, the Balanced Scorecard. The least used method is a set of exclusively financial measures (8%), which is considered by the theory as inadequate for the strategic management of businesses. The collected data show that the most used method (46%) is a set of financial and non-financial measures (mixed measures) not structured in a Tableau de Bord or a Balanced Scorecard. The utilization rate of the Tableau de Bord (26%) is higher than the Balanced Scorecard’s by 6 percentage points. Table 1 - Performance evaluation method used
Performance evaluation method used Frequencies Percentages (%)
Financial measures 3 8%
Mixed measures 16 46%
Tableau de Bord 9 26%
Balanced Scorecard 7 20%
Total 35 100%
The results allow us to conclude that although the Balanced Scorecard utilization rate is similar to the one found in previous studies carried out in Portugal (Quesado and Rodrigues, 2009; Nunes and Machado, 2014), the Tableau de Bord utilization rate is much higher than the one from other studies conducted in Brazil and Portugal, namely by Amorim and Machado (2015), and Machado and Simplício (2016).
The importance attached by financial managers to the method used in the company was measured using a Likert scale of five points, and the conclusion was that the answers were centred only on the two highest points of the scale. Table 2 shows that all financial managers consider the method used as having moderate importance (46%) or being very important (54%).
Table 2 – Importance attributed to the method used
Importance attributed to the method Frequencies Percentages (%)
No importance 0 0% Little importance 0 0% Neutral 0 0% Moderate importance 16 46% Very important 19 54% Total 35 100%
6
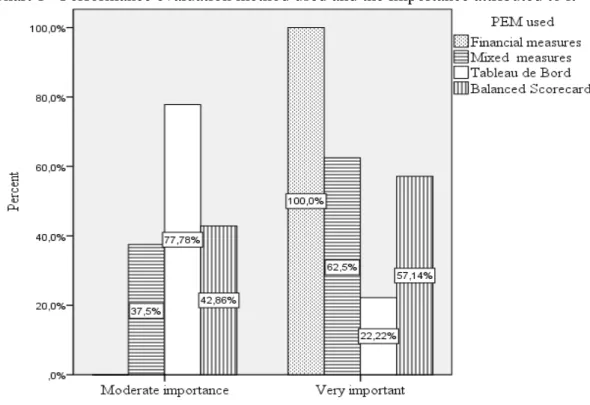
Table 3 shows the association between the method used and the importance assigned to it. Its analysis shows some heterogeneity regarding the importance attached to the method used: most managers from companies using only financial or mixed measures attach great importance to the method used; while most managers from the companies using the Tableau de Bord attach less importance to the method used.
Table 3 - Performance evaluation method used and the importance attributed to it Importance attributed to
the method
Performance evaluation method used TOTAL Financial measures Mixed measures Tableau de Bord Balanced Scorecard Moderate importance 0 6 7 3 16 Very important 3 10 2 4 19 TOTAL 3 16 9 7 35
In order to analyse the association between the performance evaluation methods used and the importance attributed to it, we used the chi-square test of independence, obtaining a value of 6.713 for a p-value of 0.096, which allows us to reject the null hypothesis of variable independence for a 10% error. These results indicate an association between the method used and the importance assigned to it by the financial managers. The strength of this association may be measured by the Cramer’s V coefficient. We obtained a value of 0.438, which in other studies is considered a strong association (Machado, 2016). The analysis of Chart 1 shows that the use of exclusively financial measures and mixed measures is considered proportionally more important than the use of the Balanced Scorecard; the Tableau de Bord is the method considered proportionally less important.
7
4.2 - The method implementation process and its level of success
With regard to the performance evaluation method implementation process, four data were collected from the financial managers: who was in charge of the method’s design and implementation; was training provided on the implemented method; what degree of success do they attribute to the implementation process; how do they characterize the company's employees in terms of resistance to change.
Table 4 presents the data collected regarding those in charge of implementing the method. The data show that most companies resorted to internal resources (66%). Only in 34% of the cases an external consultant was used.
Table 4 – Person in charge of the method’s implementation
Person in charge of the method’s implementation Frequencies Percentages (%)
Internal resources 23 66%
External consultant 12 34%
Total 35 100%
Table 5 shows the data collected regarding training for the method implemented in the company. It allows us to conclude that the majority of the managers state that training was provided (63%). However, in 37% of the companies, the financial managers say that no training was provided for the method implemented, which is a procedure considered as theoretically inadequate (Kaplan and Norton, 2001).
Table 5 – Training for the method implemented
Training for the method Frequencies Percentages (%)
Yes 22 63%
No 13 37%
Total 35 100%
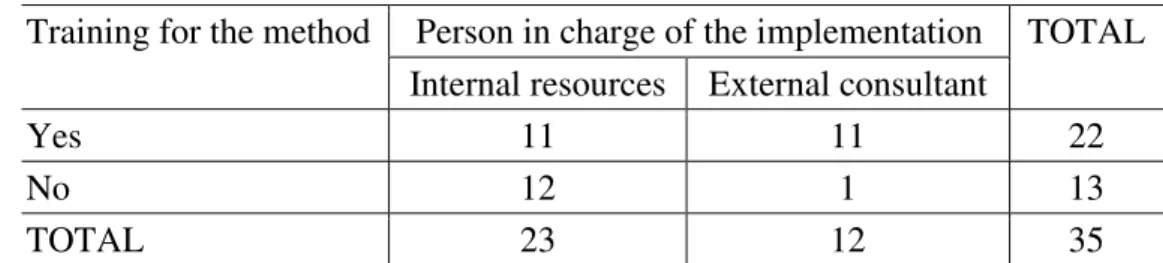
The association between the two variables – who was in charge of the implementation, and training for the method – is shown in Table 6. Its analysis allows us to observe some heterogeneity regarding training: most companies that used external consultants offered training to the employees; in contrast, most of the companies that resorted to internal resources to implement the method did not make training available.
Table 6 – Person in charge of the implementation and training availability
Training for the method Person in charge of the implementation TOTAL Internal resources External consultant
Yes 11 11 22
No 12 1 13
8
The analysis of Chart 2 shows that training is proportionately more provided to the employees when the method is implemented by external consultants, than when the company uses internal resources.
Chart 2 – Person in charge of the implementation and availability of training
In order to analyse the association between the person in charge of the implementation and the training provided, we used the chi-square independence test obtaining a value of 6.492 for a p-value of 0.011, which allows us to reject the null hypothesis of variable independence for a 5% error. These results indicate an association between the person in charge of the implementation and the training provided. The strength of this association can be measured by the Cramer's V coefficient, where we obtained a value of 0.431, which is considered a strong association.
Regarding the degree of success of the method’s implementation, Table 7 shows the results obtained that lead to the conclusion that none of the managers considered the implementation as having little or no success. However, a significant percentage (23%) chose the mid-point of the Likert scale, classified as a neutral level of success. The next level, classified as moderate success, was chosen by the majority of the respondents (66%). Only 11% chose the highest level of success.
Table 7 - Degree of success of the method’s implementation
Degree of success - method implementation Frequencies Percentages (%)
No success 0 0% Little success 0 0% Neutral 8 23% Moderate success 23 66% Great success 4 11% Total 35 100%
9
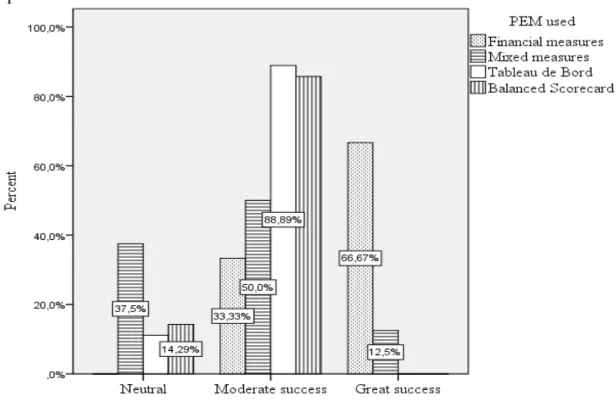
The association between the performance evaluation method used and the degree of success attributed to its implementation is presented in Table 8. Its analysis shows some heterogeneity regarding the degree of success: the higher degree of success was only chosen in companies using the simpler methods, composed solely by financial measures or mixed measures. The implementation process for the Tableau de Bord and the Balanced Scorecard was not considered by any financial manager as having a high degree of success.
Table 8 - Performance evaluation method used and the degree of success of its implementation
Degree of success - method implementation
Performance evaluation method used TOTAL Financial measures Mixed measures Tableau de Bord Balanced Scorecard Neutral 0 6 1 1 8 Moderate success 1 8 8 6 23 Great success 2 2 0 0 4 TOTAL 3 16 9 7 35
The analysis of Chart 3 shows that in most companies using the Tableau de Bord (89%) or the Balanced Scorecard (86%) the managers attribute a moderate success to the implementation of the method; while most companies using a method based solely on financial measures (67%) the managers attribute great success to the method’s implementation. These results indicate that the degree of success when implementing the simplest methods is proportionally higher than when implementing the Tableau de Bord and the Balanced Scorecard.
Chart 3 – The Performance evaluation method used and the degree of success of its implementation
10
In order to analyse the association between the method used and the degree of success of its implementation, we used the chi-square independence test having obtained a value of 15.051 for a p-value of 0.018, which allows us to reject the null hypothesis of variable independence for a 5% error. These results indicate an association between the method used and the success of its implementation. The strength of the association can be measured by the Cramer's V coefficient, where we obtained a value of 0.464, which is considered a strong association.
Finally, regarding the way financial managers characterize the company's employees in terms of resistance to change, Table 9 shows the results obtained. None of the managers chose the first point of the Likert scale, rated as no resistance to change. The second point in the scale, classified as little resistance to change, was chosen by 17% of the managers. Most managers (63%) chose the neutral point in the scale. The last two levels of the Likert scale were chosen by 20% of the managers: those who believe there is a moderate resistance to change (17%); and the 3% who report the existence of great resistance to change.
Table 9 - Degree of resistance to change
Degree of resistance to change Frequencies Percentages (%)
No resistance 0 0% Little resistance 6 17% Neutral 22 63% Moderate resistance 6 17% Great resistance 1 3% Total 35 100%
We analysed also the association between the degree of resistance to change and the degree of success assigned to the performance evaluation method’s implementation. Given the response dispersion along the various levels of the Likert scale, the variable resistance to change was transformed into a categorical variable. According to Machado (2011) categorizing a quantitative variable into two categories – higher values and lower values – may be done using the median. Thus, the new variable resistance to change presents two response categories: the first category includes the lower values (up to the median); the second includes the higher values (above the median). The association between the degree of resistance to change and the degree of success attributed to the performance evaluation method’s implementation is shown in Table 10.
Table 10 – Degree of resistance to change and degree of success of the performance evaluation method’s implementation
Degree of success - method implementation
Degree of resistance to change TOTAL Up to the median Above the median
Neutral 4 4 8
Moderate success 20 3 23
Great success 4 0 4
11
Its analysis shows some heterogeneity regarding the degree of success: the highest degree of success regarding the implementation was only awarded in companies with the lowest degree of resistance to change. In order to analyse the association between the degree of resistance to change and the degree of success of the performance evaluation method’s implementation, we used the chi-square independence test having obtained a value of 6.196 for a p-value of 0.053, which allows us to reject the null hypothesis of variable independence for a 10% error. These results indicate that there is an association between the degree of resistance to change and the degree of success in implementing the method. The strength of the association can be measured by the Cramer's V coefficient, where we obtained a value of 0.421, which is considered a strong association. The analysis of Chart 4 shows that in the majority of the companies with a lower degree of resistance to change, the managers attribute some level of success to the method’s implementation (86%); while in the majority of the companies with a higher degree of resistance to change, the managers attribute a neutral level of success to the method’s implementation (57%). These results indicate that the degree of success in implementing the performance evaluation method is higher the lower the degree of resistance to change.
Chart 4 – Degree of resistance to change and degree of success in implementing the performance evaluation method
5 – CONCLUSION
This study has the following objectives: to identify the performance evaluation methods used, and the importance attributed to them; to analyse their implementation process, and the level of success given to it.
Regarding the first objective, the results showed the following: the Balanced Scorecard s used in about one-fifth of the companies, which agrees with previous studies; the
12
Tableau de Bord is used in more than a quarter of the companies, a rate higher than the Balanced Scorecard’s. All financial managers consider that the method used has some level of importance, but we found a strong and statistically significant association between the method used and the level of importance assigned to it, more specifically in the sense that the Tableau de Bord is the method the managers attribute less importance to. These results allow us to conclude that the companies analyzed do not use the most appropriate performance evaluation methods to ensure sustainable management, since the method considered by the theory as the most appropriate, the Balanced Scorecard, is only used by one fifth of the companies.
Regarding the performance evaluation method’s implementation process, the second objective of this study, the data collected allow us to conclude the following: most companies resorted to internal resources to implement the method; in most cases training for the implemented method was provided to the employees; the majority of the managers attributes to the implementation process a moderate level success; about one-fifth of them considers that employees have some level of resistance to change. A strong and statistically significant association was found between the person in charge of the implementation and the training provided in the following sense: proportionately more training is provided to the employees when the method is implemented by external consultants, than when the company uses internal resources. It was also found a strong and statistically significant association between the method used and the degree of success attributed to its implementation in the following sense: the degree of success in implementing the simplest methods is proportionally higher than in the implementation of the Tableau de Bord and the Balanced Scorecard. We also found a strong and statistically significant association between the degree of resistance to change and the degree of success in implementing the performance evaluation method, in the following sense: the degree of success in implementing the method is higher the lower the degree of resistance to change.
As main limitations of this study we recognize the following: the small number of respondent companies; the fact that the data collection method used did not allow the clarification of doubts regarding the questions asked. However, we consider that this study offers five contributions. The first is the fact that we found, in large companies, a utilization rate of the Tableau de Bord higher than the Balanced Scorecard’s. The remaining four contributions result from the fact that we found associations, never previously studied, between the following variables: the method used and the level of importance assigned to it; the person in charge of implementing the method and the training provided to the employees; the method used and the degree of success attributed to its implementation; the degree of resistance to change and the degree of success of the method’s implementation.
For future research, we suggest new studies analysing the apparent paradox between the high Tableau de Bord utilization rate and the fact that the financial managers consider it the least important method. We also suggest the replication of this study in other companies, so that the associations found can be generalized.
REFERENCES
Amorim, D. and Machado, M. (2015) ‘Balanced Scorecard: Empirical Study in Brazil’, The Social Sciences, Vol. 10, No. 6, pp. 723-733.
13
Banker, R., Chang, H. and Pizzini, M. (2004) ‘The Balanced Scorecard: Judgmental Effects of Performance Measures Linked to Strategy’, The Accounting Review, Vol. 79, No. 1, pp. 1-23.
Banker, R. and Mashruwala, R. (2007) ‘The Moderating Role of Competition in the Relationship Between Nonfinancial Measures and Future Financial Performance’, Contemporary Accounting Research, Vol. 24, No. 3, pp. 763-793. Biggart, T., Burney L., Flanagan, R. and Harden, J. (2010) ‘Is a Balanced Scorecard Useful in a Competitive Retail Environment?’, Management Accounting Quarterly, Vol. 12, No. 1, pp. 1-13.
Bourguignon, A., Malleret, V. and Nørreklit, H. (2003) ‘The American Balanced Scorecard versus the French Tableau de Bord: the ideological dimension’,
Management Accounting Research, Vol. 15, No. 2, pp. 107-134.
Bremser, K., Alonso-Almeida, M. and Gohlich, V. (2014), ‘The relevance of organizational characteristics for crisis planning’, Business and Management Research, Vol. 3, No. 4, pp. 26-33.
Butler, J., Henderson, S. C. and Rainborn, C. (2011) ‘Sustainability and the Balanced Scorecard: Integrating Green Measures Into Business Reporting’, Management Accounting Quarterly, Vol. 12, No. 2, pp. 2-11.
Chalmeta R. and Palomero, S. (2011) ‘Methodological proposal for business sustainability management by means of the Balanced Scorecard’, Journal of the Operational Research Society, Vol. 1, No. 62, pp. 1344–1356.
Cinquini, L. and Tenucci, A. (2010) ‘Strategic Management Accounting and Business Strategy: A Loose Coupling?’, Journal of Accounting & Organizational Change, Vol. 6, No. 2, pp. 228-259.
Crabtree, A. and DeBusk, G. (2008) ‘The effects of adopting the Balanced Scorecard on shareholder returns’, Advances in Accounting, Vol. 24, No. 1, pp. 8–15.
Curado, C., and Manica, J. (2010) ‘Management control systems in Madeira island largest firms: Evidence on the balanced scorecard usage’, Journal of Business Economics and Management, Vol. 11, No. 4, pp. 652–670.
Elg, M. (2007), ‘The Process of Constructing Performance Measurement’, The TQM Magazine, Vol. 19, No. 3, pp. 217-228.
Ellangovan, K., Sai, L. and Kamalanabhan, T. (2014) ‘An importance performance analysis of performance dimensions in public hospitals’, International Journal of Business Innovation and Research, Vol. 8, No. 6, pp. 613-633.
Evans, J., Kim, K., Nagarajan, N. and Patro, S. (2010) ‘Nonfinancial Performance Measures and Physician Compensation’, Journal of Management Accounting Research, Vol. 22, No. 1, pp. 31-56.
Epstein, M. and Widener, S. (2011) ‘Facilitating Sustainable Development Decisions: Measuring Stakeholder Reactions’, Business Strategy and the Environment, Vol. 20, No. 1, pp. 107–123.
Ghosh, D. and Wu, A. (2012) ‘The Effect of Positive and Negative Financial and Nonfinancial Performance Measures on Analysts' Recommendations’, Behavioral Research in Accounting, Vol. 24, No. 2, pp. 47-64.
14
Ismail, T. (2007) ‘Performance Evaluation Measures in the Private Sector: Egyptian Practice’, Managerial Auditing Journal, Vol. 22, No. 5, pp. 503-513.
Jha, J. and Nanda, J. (2013) ‘Corporate social responsibility: employee perspective’, International Journal of Productivity and Quality Management, Vol. 11, No. 3, pp. 311-333.
Juhmani, O. (2007) ‘Usage, motives and usefulness of the balanced scorecard (BSC): evidence from Bahrain’, International Journal of Business Research, Vol. 7, No. 5, pp. 106–117.
Kaplan, R. and Norton, D. (1992) ‘The Balanced Scorecard - Measures that Drive Performance’, Harvard Business Review, Vol. 70, No. 1, pp. 71-79.
Kaplan, R. and Norton, D. (1994) ‘Devising a Balanced Scorecard Matched to Business Strategy’, Planning Review, Vol. 22, No. 5, pp. 15-48.
Kaplan, R. and Norton, D. (1996a) The Balanced Scorecard: Translating Strategy into action, Boston, Harvard Business School Press, Boston.
Kaplan, R. and Norton, D. (1996b) ‘Strategic Learning & the Balanced Scorecard’, Strategy & Leadership, Vol. 24, No. 5, pp. 18-24.
Kaplan, R. and Norton, D. (1996c) ‘Linking the Balanced Scorecard to Strategy’, California Management Review, Vol. 39, No. 1, pp. 53-79.
Kaplan, R. and Norton, D. (2001) ‘Transforming the BSC from Performance Measurement to Strategic Management: Part II’, Accounting Horizons, Vol. 15, No. 2, pp. 147-160.
Karpagam, P. and Suganthi, L. (2016) ‘Exploring the critical success factors affecting the performance of management institutions’, International Journal of Business Innovation and Research, Vol. 10, No. 4, pp. 453-477.
Kraus, K. and Lind, J. (2010) ‘The Impact of the Corporate Balanced Scorecard on Corporate Control - A Research Note’, Management Accounting Research, Vol. 21, No. 4, pp. 265-277.
Machado, M. (2011) ‘Variáveis contingenciais aos métodos de valoração dos produtos: estudo empírico em PME’s industriais portuguesas’, Revista Brasileira de Gestão de Negócios, Vol. 13, No. 41, pp. 396-414.
Machado, M. (2013) ‘Balanced Scorecard: An Empirical Study of Small and Medium Size Enterprises’, Revista Brasileira de Gestão de Negócios, Vol. 15, No. 46, pp. 129-148.
Machado, M. (2016) ‘Management Accounting Software and Accounting Practices: Empirical Study on SME Enterprises’, Transactions on Business and Economics, Vol. 13, No. 1, pp. 94-103.
Machado, M. and Simplício, P. (2016) ‘Instruments of sustainable management: the Balanced Scorecard in the best companies where to work in Portugal’, Transactions on Environment and Development, Vol. 12, No. 1, pp. 65-75. Malhotra, R. and Tempori, C. (2010) ‘Critical decisions for ERP integration: Small
business issues’, International Journal of Information Management, Vol. 30, No. 1, pp. 28-37.
15
Modell, S. (2012) ‘The Politics of the Balanced Scorecard’, Journal of Accounting & Organizational Change, Vol. 8, No. 4, pp. 475-489.
Nunes, C. and Machado, M. (2014) ‘Performance evaluation methods in the hotel industry’, Tourism & Management Studies, Vol. 10, No. 1, pp. 24-30.
Priyadharshini, S., Kamalanabhan, T. and Madhumathi, R. (2015) ‘Human resource management and firm performance’, International Journal of Business Innovation and Research, Vol. 9, No. 2, pp. 229-251.
Quesado, P. and Rodrigues, L. (2009) ‘Fatores Determinantes na Implementação do Balanced Scorecard em Portugal’, Revista Universo Contábil, Vol. 5, No. 4, pp. 94 - 115.
Quesado, P., Guzmán, B. and Rodrigues, L. (2012) ‘O Tableau de Bord e o Balanced Scorecard: Uma Análise Comparativa’, Revista de Contabilidade e Controladoria, Vol. 4, No. 2, pp. 128-150.
Reefke, H. and Trocchi, M. (2013) ‘Balanced scorecard for sustainable supply chains: design and development guidelines’, International Journal of Productivity and Performance Management, Vol. 62, No. 8, pp. 805-826
Said, A., HassabElnaby, R and Wier, B. (2003) ‘An Empirical Investigation of the Performance Consequences of Nonfinancial Measures’, Journal of Management Accounting Research, Vol. 15, No. 1, pp. 193-223.
Spathis, C. and Ananiadis, J. (2005) ‘Assessing the benefits of using an enterprise system in accounting information and management’, The Journal of Enterprise Information Management, Vol. 18, No. 2, pp. 195-210.
Sweis, R., Ahmad, K., Al-Dweik, G., Alawneh, A. and Hammad, A. (2016) ‘The relationship between total quality management practices and organisational performance at Jordanian hospitals’, International Journal of Business Innovation and Research, Vol. 10, No. 4, pp. 519-542.
Tung, A., Baird, K. and Schoch, H. (2011) ‘Factors influencing the effectiveness of performance measurement systems’, International Journal of Operations & Production Management, Vol. 31, No. 12, pp. 1287–1310.
Zaman, M. (2004) ‘The Role of Financial and Non-Financial Evaluation Measures in the Process of Management Control Over Foreign Subsidiaries - Empirical Evidence in Slovene Multinational Companies’, Management, Vol. 9, No. 2, pp. 53-73.
Zavodna, L. (2013) ‘Sustainability as a part of Balanced Scorecard’, Global Economic Observer, Vol. 1, No. 1, pp. 110-116.