Introduction
There has been an increased interest in research related to sedentary behavior (SB) and its correlates around the world1, 2.
SB, typically deined as activities that do not increase energy expenditure substantially above the resting level (≤1.5 METs) while in a sitting or reclining posture such as sleeping, sitting, lying down, and watching television, and other forms of screen-based entertainment3, has been measured by accelerometry as
an objective approach and self – or proxy-report questionnaires, as a subjective approach4.
Currently, media, from television to the “newmedia”, in-cluding cell phones, tablets, and social media, are a dominant force in children’s lives5. Therefore, international guidelines recommend that children and adolescents should minimize the time they spend being sedentary each day to reduce health risks. This may be achieved by limiting the amount of total
entertainment screen time (ST) to <1 to no more than 2 h/day, keeping the TV set and internet-connected electronic devices out of the child’s bedroom and break up long periods of sitting as often as possible5, 6.
A systematic review examining the relationship between ST and health indicators in school-aged children and adoles-cents suggested that daily TV viewing in excess (≥2 hours) was associated with reduced physical and psychosocial health, and that lowering sedentary time leads to reductions in BMI7.
This was true for all study designs, involving 39 countries, using both direct and indirect measurements, and regardless of participant sample size7. An updated publication with data
from 71 different countries showed that higher duration of TV viewing and/or ST (e.g., TV, computer, electronic games) was associated with unfavorable health8. A gradient was observed
across health indicators, indicating that less SB, especially ST, was associated with better health8. Further, the overall indings Original Article (short paper)
Screen time between Portuguese and Brazilian
children: a cross-cultural study
Amanda Santos Sandra Silva-Santos
Faculdade de Desporto da Universidade do Porto, Porto, Portugal
Alynne Andaki
Edmar Lacerda Mendes
Faculdade de Desporto da Universidade do Porto, Porto, Portugal
Universidade Federal do Triângulo Mineiro, Uberaba, MG, Brasil
Susana Vale
Faculdade de Desporto da Universidade do Porto, Porto, Portugal
Instituto Politécnico do Porto, Porto, Portugal
Jorge Mota
Faculdade de Desporto da Universidade do Porto, Porto, Portugal
Abstract — Aims: To verify differences in screen time (ST) (hours watching TV, using computer and/or video game)
and to compare the percentage of meeting ST recommendation between Portuguese and Brazilian children. Methods:
The sample comprised 369 children aged 9 year-old from Portugal (n=95) and Brazil (n=274). ST average (h/day), physical activity (PA) and socioeconomic status (SES) were estimated by parental-report questionnaire. The Student t
test or the Mann-Whitney U test and binary logistic regression analysis were used to verify differences and associations
on ST (<2h/day) between cities. All analyses were stratiied by gender and adjusted for age, BMI, PA and SES. Results:
The prevalence of meet ST recommendation was 66.7% and 55.3% between Portuguese girls and boys and 25.0% and 16.4%between Brazilian girls and boys. Portuguese girls (1.58±0.84vs3.40 ± 1.76h/day, p<0.05) and boys (1.74 ± 1.18 vs 4.20 ± 2.30 h/day, p<0.05) had signiicantly less ST than their Brazilian counterparts. Brazilian girls (OR=7.593;
p=0.0001) as well as Brazilian boys (OR=6.564; p=0.0001) were more likely to do not meet ST recommendation, compared with their Portuguese counterparts. Conclusions: Portuguese children were approximately seven times more
likely to meet ST recommendation than Brazilian children. Differences between countries should be considered in public policy strategies to reduce ST.
from a global matrix comparing 15 countries suggested that when SB was high, physical activity (PA) levels are lower, along with a signiicant global variation in SB9, suggesting that international comparisons can illustrate potentially important patterns and trends on SB9. The current globalized society, un-healthy behaviors can easily be set up in the person’s lifestyle. Therefore, a cross-cultural vision may be particularly useful in understanding differences in lifestyle behaviors, and help to understand how different environments and diverse cultures may impact on ST. It is also worthy to contribute for assist interventions and policy recommendations.
In a population surveillance, 58.2% of the Brazilian chil-dren up to 9 year-old and 58.8% of the Brazilian adolescents aged 10-17 year-old spent more than 3h/day watching TV 10. The Brazilian National School-Based Health Survey (Pesquisa Nacional de Saúde do Escolar – PeNSE) showed that 60.0% of
adolescents spend ≥ 2 h/day watching TV all over the country during weekdays and when asked about the time they were seated in a common weekday not only watching TV but performing other activities such as using the computer, playing video games or doing other sitting activities, 56.1% reported getting more than three hours sitting11. In parallel, approximately 60% of Portuguese
children aged11-year-old watched TV for ≥2h on weekdays12,
while 12.2% of children aged between 6-13 year-oldspent less than 1.5 hours watching TV and playing video games, either on weekdays or weekends13. Thus, we target to contribute in this
ield of knowledge, pointing out differences between distant countries geographically and culturally that should be considered whereas worldwide studies are recently paying attention on the increased prevalence of ST among children and adolescents14-16 and it has been reported with negative health outcomes1, 17-19. Therefore, this study aimed to verify differences in ST (i.e. hours watching TV, using computer and/or video game) and to compare the percentage of Portuguese and Brazilian children meeting the ST recommendation (< 2 h/day).
Methods
Participants
In this school-based cross-sectional study, a convenience sample of 369 out of 1.021 children aged 9.83 ± 0.65 year-old was se-lected from Matosinhos, Portugal(n=95), and Uberaba, Brazil (n=274). Data from Portugal derived from the longitudinal project named Preschool Physical Activity, Body Composition and Lifestyle Study (PRESTYLE) and it was collected in the fall of 2013 and 2014. Data from Brazil derived from the cross-sectional study named “Infância Ativa” and it was collected in the
spring of 2011 and 2012. It was scheduled meeting with school principals and it was presented the objectives and measures of the study for their agreement to participate. After informed written consent from parents or guardian consent children were evaluated during school days by trained professionals.
The comparison in the current study was between two dif-ferent cities from very diverse cultural, social, and environmen-tally countries. Portuguese data were collected in Matosinhos,
included in the metropolitan area of Porto located in the North region of the country. It has 62,2 km² of area, 175.478 inhabitants and 2821 inhabitants/km² as demographic density20. Portugal’s Human Development Index (HDI) value for 2014 was 0.830, which put the country in the very high human development category, positioning it at 43° out of 188 countries and territo-ries21. Brazilian data were collected in Uberaba located in the
South-Eastern region of the country. It has 4533.81 km² of area, 295.988 inhabitants and 65.29 inhabitants/km² as demographic density22. Brazil’s HDI value for 2014 was 0.755, in the high
human development category and 75° position21.
Anthropometry
Body mass was obtained by digital electronic scale with a150 kg maximum capacity and 100 g accuracy (Plena, modelo ICE, Brazil;Tanita Inner Scan BC 532, Portugal). The height was obtained using a portable stadiometer with a 2 m length and a scale of 0.1 cm (Welmy, Brazil; Holtain, Portugal). The aver-age of two measurements was used for both height and weight. Body mass index (BMI) was calculated by dividing body mass (kg) by square of height (m).
Socioeconomic status
Parents’ education level was used as measure of socioeconomic status23based on the Portuguese and Brazilian educational system.
The SES was categorized as low (9 years’ education or less sub secondary level), middle (10–12 years’ education-secondary level) and high education (higher education). The highest level of education from mother or father and the children’s principal guardian for mono-parental families were selected.
Lifestyle questionnaire
Statistical Analysis
The Kolmogorov Smirnov test was used to verify the normal distribution of variables. Subsequently, Independent Student t
test or Mann-Whitney U test were used to examine differences
between cities and gender. Chi-square test evaluated the dif-ference in prevalence between parental education and physical activity between countries. Binary logistic regression analysis was used to evaluate the magnitudes of the associations between ST recommendation and cities. Overall analyses were adjusted for age, BMI, PA and socioeconomic status, within genders. Data analysis was performed using SPSS version 22. The level of signiicance was set at 0.05.
Results
The descriptive characteristics of the sample are shown in Table 1. For total sample, the variables of age (9.43 ± 0.45 vs 9.97 ± 0.66; p < 0.05), BMI (19.07 ± 3.29 vs 18.22 ± 3.90; p < 0.05) and ST (1.66 ± 1.02 vs 3.79 ± 2.08; p < 0.05) were signiicantly different between Portuguese and Brazilian children, respec-tively. There was no difference in parental education prevalence
between the two countries (χ2 = 4,23; p = 0,121) and Portuguese
children participated in organized sports outside school signii-cantly more than Brazilian children (χ2 = 32,30; p = 0.0001). ST
was signiicantly lower in Portuguese children than Brazilian children, regardless of gender. BMI was signiicantly higher in Portuguese than Brazilian boys.
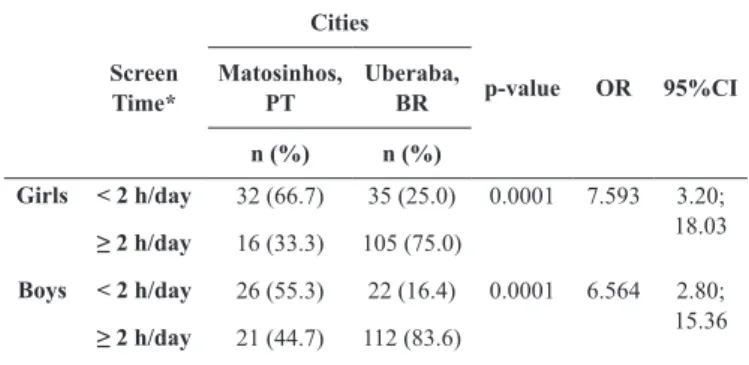
The binary logistic regression analysis pointed out the rela-tionship between ST and cities, by gender (Table 2). Regarding the ST, the prevalence of meet the recommendation (< 2 h/day) was 66.7% and 55.3% between Portuguese girls and boys and 25.0% and 16.4% between Brazilian girls and boys, respectively. Further, our data also showed that Brazilian girls (OR=7.593; p=0.0001) as well as Brazilian boys (OR=6.564; p=0.0001) were more likely to do not meet ST recommendation, compared with Portuguese girls and boys, respectively.
Table 2. Association between screen time recommendation and cities, by gender, in children from Matosinhos, Portugal and Uberaba, Brazil
Screen Time*
Cities
p-value OR 95%CI
Matosinhos, PT
Uberaba, BR
n (%) n (%)
Girls < 2 h/day 32 (66.7) 35 (25.0) 0.0001 7.593 3.20;
18.03
≥ 2 h/day 16 (33.3) 105 (75.0)
Boys < 2 h/day 26 (55.3) 22 (16.4) 0.0001 6.564 2.80;
15.36
≥ 2 h/day 21 (44.7) 112 (83.6)
*Adjusted by age, body mass index, physical activity and socioeconomic status.
Discussion
This study aimed to verify differences in ST and to compare the percentage of Portuguese and Brazilian children meeting the ST recommendation (<2 h/day). Our major inding was that Portuguese girls and boys presented signiicantly lower time spent in ST than Brazilian children. The majority of Portuguese chil-dren meet the ST recommendation (61.1%) while the Brazilian children (20.8%) did not. Brazilian girls were 7.4 times more likely to do not meet the ST recommendations than Portuguese girls while Brazilian boys were 6.7 times more likely to do not meet the ST recommendation than Portuguese boys. These data may be important in understanding cultural differences and assist ST recommendation between children from different geographical locations.
Culturally, Brazilian children have only a half-day period at school (morning or afternoon). Given that organization, Brazilian children spent approximately only four hours at schools while the remaining time might easily be spent at home with access to TV, computer and video games. Further, signiicant differences between SES groups was found for sedentary behavior with higher SES groups spending less time watching TV than low SES groups25. Additionally, parental education maybe inversely related with your child ST when considered correlates as presence
Table 1. Descriptive characteristics (mean (standard deviation) or percentage)
Girls
Matosinhos,
Portugal Uberaba, Brazil
(n=48) (n=140)
Age (years) 9.40 (0.29) 9.99 (0.67)*
BMI (kg/m2) 19.12 (3.41) 18.20 (3.60)
ST (hours/day) 1.58 (0.84) 3.40 (1.76)*
Parental Education (%)
Low 54.2 47.1
Medium 27.1 39.3
High 18.7 13.6
Physical Activity (%)
Yes 43.7 12.1
No 56.3 87.9
Boys Matosinhos,
Portugal Uberaba, Brazil
(n=47) (n=134)
Age (years) 9.46 (0.57) 9.94 (0.64)*
BMI (kg/m2) 19.02 (3.21) 18.23 (4.21)*
ST (hours/day) 1.74 (1.18) 4.20 (2.30)*/**
Parental Education (%)
Low 44.7 58.2
Medium 34.0 32.1
High 21.3 9.7
Physical Activity (%)
Yes 51.1 23.9
No 48.9 76.1
ST: screen time; BMI: body mass index.
of TV in the child’s bedroom, eating meals in front of a TV, parental modeling for TV/DVD and parental co-viewing26. This scenario contributes for children to stay in front of screens and often without adult supervision even during their leisure time. Rather, the Portuguese educational system provides full-time schools which reduce the time available for ST. Suggesting a potential impact of the time organization and management which lies on social, geographic and cultural environmental factors that should be considered. However, it seems that a single strategy to reduce sedentary behavior measured by accelerometer27 and
ST may be unlikely to be effective across many countries1.
Guidelines or recommendations are not common in develop-ing countries yet and it seems that public health messages about limiting ST, in particular, may be important as there are changes in lifestyles occurring throughout all over the world9. Additionally, in Portuguese schoolchildren, the prevalence of overweight is high28, 29,around 30.0%30-32 and it is among the highest in Europe31. However, stabilization seems to have
oc-curred during the last decade29, 32, 33. Increased BMI have been observed in the Brazilian population, even in comparison to children from other countries34, although there are variations in
the prevalence rates of overweight and obesity in the different regions of Brazil, the values identiied are high and worrying35.
Few international studies involving data from Portugal showed that 45% of girls and 52% of boys aged 11 year-old did not meet the ST recommendation36 and it was found ST prevalence between 14.5 to 17.5 h/week in children aged 6-8year-old37. The ISCOLE was the only study that compared
data from Portugal and Brazil adding interesting indings in-cluding Portugal among the countries with high level of sitting time assessed by accelerometer (9.2 h/day) and with ST values below the ISCOLE average (2.3 h/day) while Brazil showed sitting time values below the ISCOLE average (8.3 h/day) and it had the lowest percent of participants meeting the ST guidelines (27.6%)1.
The lower values of ST and high prevalence of meet the ST recommendation in Portuguese children can be found in other studies with Portuguese samples, such as data from Portuguese Prevalence Study of Obesity in Childhood, with 1.517 children aged 7-10 year-old, found around only 28% of boys and 26% of girls watched≥2 h of TV38, while data from Braga, North of
Portugal, in children aged 8-10 year-old showed 1.4 h/day ST39, 40. However, higher values of ST in Portuguese youngsters were also described approaching our Brazilian outcomes. For instance, data from urban and rural communities in the Portuguese Midlands comprising 100 boys and 115 girls aged 13-14 year-old found 3.34 ± 1.79 h/day and 2.63±1.39 h/day of ST, respectively41.
Recently, a systematic review described the methodological characteristics and assessed variables associated with SB among Brazilian children and adolescents and identiied a great number of cross-sectional studies around the country42. Besides a global
matrix comparing 15 countries suggest that SB in general are better in low-income countries9, we found high ST values (Girls: 3.36 ± 1.83; Boys: 4.2 ± 2.28 h/day; p<0.05) and prevalence of ST ≥2 h/day (Girls: 81.0%; Boys: 76.4%). Despite that, our data seems to be in accordance with recent studies. For instance, data from 879 adolescents aged 14-19 year-old from São José, Santa
Catarina, showed that they spent 6.5 ± 4.9 hours (85.4% ≥2 h/ day) in front of TV, computer and videogame, 7.0 ± 4.9 h (90.3% ≥2 h/day) among boys and 5.9 ± 4.8 h (81.2% ≥2 h/day)among girls43. Data from 515 boys and 716 girls aged 14-17 year-old
from Londrina, Paraná, found that most adolescents (93.8% of boys and 87.2% of girls) spent ≥2 h/day in ST44. Data from the
1993 Pelotas birth cohort study showed that the frequency of adolescents that did not accomplished the ST recommendation was 75% (median 4.5 h/day), 80.2% (median 5.5 h/day) and 77.4% (median 4.5 h/day) at 11, 15 and 18 year-old, respectively. Those values were very similar between boys (75.6 %, 82.3% and 78.8% at 11, 15 and 18) and girls (74.5%, 78.3% and 76% at 11, 15 and 18)45.
In addition to these igure, the ST can happen in different ways in their assessments. A representative sample of 8,610 Portuguese adolescents aged 11-17 year-old, from three dif-ferent cohorts in 2002, 2006, and 2010 found that for the two screen-based media assessed there was a trend reversal. Time spent watching TV/video/DVD decreased signiicantly from 2002 to 2010 for boys and girls. Conversely, time spent on the computer increased signiicantly over the years for boys and girls46. In Brazil, a comparative analysis of two cross-sectional surveys including 5.028 and 6.529 students in 2001 and 2011, aged 15–19 year-old from Santa Catarina state found a decrease in TV watching after a decade and this appears to be compensated by the increased time spent in computer/video game use, either in boys orgirls47. Therefore, children may behave differently
according to the different screens/devices and we must take this into account.
Our study has some limitations that should be mentioned. The cross-sectional design provides associations but not causal relationships. The sample contains information of only one city of each country, so the results here should be interpreted with caution and attention to generalizations. Measures of ST and PA relied on parent-report and were possibly biased. Unfortunately, there are not yet, self-report or proxy-report sedentary behavior questionnaires for children and adolescents available that are both valid and reliable48. Besides that, we did not evaluate the
use of new media such as handheld videogames, cell phones and music devices that recently has contributed to increased screen time49.
Conclusions
Portuguese children were approximately seven times more likely to meet the ST recommendations than Brazilian children. Difference between countries should be considered in public policy strategies to reduce ST. More research is needed to con-irm and expand this data.
References
International Study of Childhood Obesity, Lifestyle and the Environment. PloS one. 2015;10(6):e0129622.
2. Atkin AJ, Sharp SJ, Corder K, van Sluijs EM, International Children’s Accelerometry Database C. Prevalence and correlates of screen time in youth: an international perspective. Am. J. Prev. Med. 2014;47(6):803-7.
3. Pate RR, O’Neill JR, Lobelo F. The evolving deinition of “sed-entary”. Exerc Sport Sci Rev. 2008;36(4):173-8.
4. Atkin AJ, Gorely T, Clemes SA, Yates T, Edwardson C, Brage S, et al. Methods of Measurement in epidemiology: sedentary Behaviour. Int J Epidemiol. 2012;41(5):1460-71.
5. Children, Adolescents, and the Media. Pediatrics. 2013;132(5):958-61.
6. Tremblay MS, Leblanc AG, Janssen I, Kho ME, Hicks A, Murumets K, et al. Canadian sedentary behaviour guidelines for children and youth. Appl Physiol Nutr Metab. 2011;36(1):59-64; 5-71.
7. Tremblay MS, LeBlanc AG, Kho ME, Saunders TJ, Larouche R, Colley RC, et al. Systematic review of sedentary behaviour and health indicators in school-aged children and youth. Int J Behav Nutr Phys Act. 2011;8:98.
8. Carson V, Hunter S, Kuzik N, Gray CE, Poitras VJ, Chaput J-P, et al. Systematic review of sedentary behaviour and health indica-tors in school-aged children and youth: an update. Appl Physiol Nutr Metab. 2016;41(6 (Suppl. 3)):S240-S65.
9. Tremblay MS, Gray CE, Akinroye KK, Harrington DM, Katzmarzyk PT, Lambert EV, et al. Physical activity of children: A global matrix of grades comparing 15 countries. J Phys Act Health. 2014;11(Supp 1):113-25.
10. PNAD. Pesquisa Nacional por Amostra de Domicílios: Um panorama da saúde no Brasil. Acesso e utilização de serviços, condições de saúde e fatores de risco e proteção à saúde 2008: Instituto Brasileiro de Geograia e Estatística Rio de Janeiro; 2010. 11. Pesquisa nacional de saúde do escolar: 2015. Rio de Janeiro. 2016. 12. Currie C. Social determinants of health and well-being among
young people: Health Behaviour in School-aged Children (HBSC) study: international report from the 2009/2010 survey2012. 13. Vasques C, Mota M, Correia T, Lopes V. Prevalence of
over-weight/obesity and its association with sedentary behavior in children. Rev Port Cardiol. 2012;31(12):783-8.
14. Santaliestra-Pasias AM, Mouratidou T, Verbestel V, Bammann K, Molnar D, Sieri S, et al. Physical activity and sedentary behaviour in European children: the IDEFICS study. Public Health Nutr. 2014;17(10):2295-306.
15. Rey-López JP, Vicente-Rodriguez G, Ortega FB, Ruiz JR, Martinez-Gómez D, De Henauw S, et al. Sedentary patterns and media availability in European adolescents: The HELENA study. Preventive Medicine. 2010;51(1):50-5.
16. Bucksch J, Sigmundova D, Hamrik Z, Troped PJ, Melkevik O, Ahluwalia N, et al. International Trends in Adolescent Screen-Time Behaviors From 2002 to 2010. J Adolesc Health. 2016;58(4):417-25.
17. Stamatakis E, Coombs N, Jago R, Gama A, Mourao I, Nogueira H, et al. Associations between indicators of screen time and adiposity indices in Portuguese children. Prev Med. 2013;56(5):299-303.
18. Stamatakis E, Coombs N, Jago R, Gama A, Mourao I, Nogueira H, et al. Type-speciic screen time associations with cardiovascular risk markers in children. Am. J. Prev. Med. 2013;44(5):481-8. 19. Dutra GF, Kaufmann CC, Pretto AD, Albernaz EP. Television
viewing habits and their inluence on physical activity and child-hood overweight. J Pediatr (Rio J). 2015;91(4):346-51.
20. INE. Censos 2011 Portugal: Instituto Nacional de Estatística; 2011 [Available from: http://censos.ine.pt/xportal/xmain?xpid=CENS OS&xpgid=censos2011_apresentacao.
21. UNDP. Human Development Index (HDI): United Nations Development Programme; 2014 [Available from: http://hdr.undp. org/en/content/human-development-index-hdi.
22. IBGE. Censo Demográico 2010: Instituto Brasileiro de Geograia e Estatística; 2010 [Available from: http://www.ibge.gov.br/home/ default.php.
23. Francisco R, Espinoza P, Gonzalez ML, Penelo E, Mora M, Roses R, et al. Body dissatisfaction and disordered eating among Portuguese and Spanish adolescents: The role of individual char-acteristics and internalisation of sociocultural ideals. J Adolesc. 2015;41:7-16.
24. Marques A, Ekelund U, Sardinha LB. Associations between or-ganized sports participation and objectively measured physical activity, sedentary time and weight status in youth. Journal of science and medicine in sport / SMA. 2016;19(2):154-7. 25. Drenowatz C, Eisenmann JC, Pfeiffer KA, Welk G, Heelan K,
Gentile D, et al. Inluence of socio-economic status on habitual physical activity and sedentary behavior in 8 – to 11-year old children. BMC Public Health. 2010;10(1):214.
26. Gebremariam MK, Altenburg TM, Lakerveld J, Andersen LF, Stronks K, Chinapaw MJ, et al. Associations between socioeco-nomic position and correlates of sedentary behaviour among youth: a systematic review. Obesity Reviews. 2015;16(11):988-1000. 27. Sedentary Behaviour Research N. Letter to the Editor:
Standardized use of the terms “sedentary” and “sedentary behav-iours”. Appl Physiol Nutr Metab. 2012;37(3):540-2.
28. Pedrosa C, Correia F, Seabra D, Oliveira BM, Simoes-Pereira C, Vaz-de-Almeida MD. Prevalence of overweight and obe-sity among 7-9-year-old children in Aveiro, Portugal: com-parison between IOTF and CDC references. Public Health Nutr. 2011;14(1):14-9.
29. Wijnhoven TM, van Raaij JM, Spinelli A, Starc G, Hassapidou M, Spiroski I, et al. WHO European Childhood Obesity Surveillance Initiative: body mass index and level of overweight among 6-9-year-old children from school year 2007/2008 to school year 2009/2010. BMC Public Health. 2014;14:806.
30. Santos R, Moreira C, Ruiz JR, Vale S, Soares-Miranda L, Moreira P, et al. Reference curves for BMI, waist circumference and waist-to-height ratio for Azorean adolescents (Portugal). Public Health Nutr. 2012;15(1):13-9.
31. Padez C, Fernandes T, Mourão I, Moreira P, Rosado V. Prevalence of overweight and obesity in 7-9-year-old Portuguese children: trends in body mass index from 1970-2002. 2004.
33. Martin L, Oepen J, Reinehr T, Wabitsch M, Claussnitzer G, Waldeck E, et al. Ethnicity and cardiovascular risk factors: evaluation of 40,921 normal-weight, overweight or obese chil-dren and adolescents living in Central Europe. Int J Obes (Lond). 2015;39(1):45-51.
34. Filho VC, Lopes Ada S, Fagundes RR, de Campos W. [Anthropometric indices among schoolchildren from a munici-pality in Southern Brazil: a descriptive analysis using the LMS method]. Rev Paul Pediatr: orgao oicial da Sociedade de Pediatria de Sao Paulo. 2014;32(4):333-41.
35. Niehues JR, Gonzales AI, Lemos RR, Bezerra PP, Haas P. Prevalence of overweight and obesity in children and adolescents from the age range of 2 to 19 years old in Brazil. Int J Pediatr. 2014;2014:583207.
36. Inchley J, Currie D, Young T, Samdal O, Torsheim T, Augustson L, et al. Growing up unequal: gender and socioeconomic dif-ferences in young people’s health and well-being. Copenhagen: WHO Regional Ofice for Europe 2016.
37. Mantziki K, Vassilopoulos A, Radulian G, Borys JM, Du Plessis H, Gregorio MJ, et al. Inequities in energy-balance related behaviours and family environmental determinants in European children: baseline results of the prospective EPHE evaluation study. BMC Public Health. 2015;15:1203.
38. Jago R, Stamatakis E, Gama A, Carvalhal IM, Nogueira H, Rosado V, et al. Parent and child screen-viewing time and home media environment. Am J Prev Med. 2012;43(2):150-8.
39. Silva C, Fassnacht DB, Ali K, Goncalves S, Conceicao E, Vaz A, et al. Promoting health behaviour in Portuguese children via Short Message Service: The eficacy of a text-messaging programme. J Health Psychol. 2015;20(6):806-15.
40. Fassnacht DB, Ali K, Silva C, Goncalves S, Machado PP. Use of text messaging services to promote health behaviors in children. J Nutr Educ Behav. 2015;47(1):75-80.
41. Machado-Rodrigues AM, Coelho ESMJ, Mota J, Padez C, Martins RA, Cumming SP, et al. Urban-rural contrasts in itness, physical activity, and sedentary behaviour in adolescents. Health Promot Int. 2014;29(1):118-29.
42. Guerra PH, Farias Junior JC, Florindo AA. Sedentary behavior in Brazilian children and adolescents: a systematic review. Rev Saude Publica. 2016;50:9.
43. Goncalves EC, Silva DA. [Factors associated with low levels of aerobic itness among adolescents]. Rev Paul Pediatr: orgao oicial da Sociedade de Pediatria de Sao Paulo. 2016;34(2):141-7. 44. Christofaro DG, De Andrade SM, Mesas AE, Fernandes RA, Farias
Junior JC. Higher screen time is associated with overweight, poor dietary habits and physical inactivity in Brazilian adolescents, mainly among girls. Eur J Sport Sci. 2016;16(4):498-506.
45. Bergmann GG, Bertoldi AD, Mielke GI, Camargo AL, Matijasevich A, Hallal PC. [Physical activity, screen time, and use of medicines among adolescents: the 1993 Pelotas (Brazil) birth cohort study]. Cad Saude Publica. 2016;32(4):e00011715. 46. Marques A, Gaspar De Matos M. Trends and correlates of over-weight and obesity among adolescents from 2002 to 2010: a three-cohort study based on a representative sample of Portuguese adolescents. Am J Hum Biol. 2014;26(6):844-9.
47. Lopes AS, Silva KS, Barbosa Filho VC, Bezerra J, de Oliveira ES, Nahas MV. Trends in screen time on week and weekend days in a representative sample of Southern Brazil students. J Public Health (Oxf). 2014;36(4):608-14.
48. Hidding LM, Altenburg TM, Mokkink LB, Terwee CB, Chinapaw MJM. Systematic Review of Childhood Sedentary Behavior Questionnaires: What do We Know and What is Next? Sports Med. 2016:1-23.
49. Dumuid D, Olds TS, Lewis LK, Maher C. Does home equipment contribute to socioeconomic gradients in Australian children’s physical activity, sedentary time and screen time? BMC Public Health. 2016;16(1):736.
Acknowledgment
The group thanks to the children, their parents, as well as the staff from all schools. This study was supported by CIAFEL (Faculty of Sport, University of Porto) and by the following Portuguese Foundation for Science and Technology (FCT) grants: UID/DTP/00617/2013; SFRH/BD/86538/2012; And sponsorship grant by Coordi-nation for the Improvement of Higher Education Personnel (CAPES) Nº 6099/13-0.
Corresponding author
Amanda Santos. 65 St. Professor Mendes Correia 2nd left. Porto, Portugal.
Email: amanda637@hotmail.com
Manuscript received on October 11, 2016 Manuscript accepted on December 13, 2016