Introduction
The definition of excess body fat is not well established, especially in the adolescence period where the level of adiposity may vary widely with respect to age sex and maturational status.[1] Several methods can be used for the assessment of body composition, and the use of anthropometry is especially important during adolescence to allow the evaluation of changes resulting from growth and maturation.[2]
According to the World Health Organization (WHO), the recommended anthropometric methods to assess the weight status of adolescents include body mass index (BMI) and triceps and subscapular skinfold thickness (ST).[3] However, the study of Glaber et al.[4] found that both BMI and waist circumference (WC) are good predictors of excess adiposity in adolescents.
The BMI is a reliable indicator of body fat for most adolescents, but in spite of its high sensitivity and specificity, a high number of adolescents classified as overweight or obese do not have high body fat. The relationship between BMI and components of fat and lean mass are not well established in adolescents due to different growth and maturation levels,[1] thus the prediction of excess fat through the definition of BMI cutoff points is still under discussion.
The measurement of ST shows a good correlation to body composition obtained with the direct measurements of
Prevalence of Overweight and Obesity in
Portuguese Adolescents: Comparison of Different
Anthropometric Methods
Beatriz Minghelli, Carla Nunes
1, Raul Oliveira
2School of Health Jean Piaget Algarve, Piaget Institute, Portugal, 1National School of Public Health - NOVA University of Lisbon, 2Faculty of Human Kinetics, University of Lisbon, Lisbon, Portugal
Abstract
Background: The recommended anthropometric methods to assess the weight status include body mass index (BMI), skinfold thickness, and waist circumference. However, these methods have advantages and disadvantages regarding the classification of overweight and obesity in adolescents. Aims: The study was to analyze the correlation between the measurements of BMI, skinfold thickness and waist circumference to assess overweight and obesity in Portuguese adolescents. Materials and Methods: A sample of 966 students of Portugal was used. Of them, 437 (45.2%) were males and 529 (54.8%) were females aged between 10 and 16 years. The evaluations included BMI calculation, skinfold thickness, and waist circumference measurements. Results: This study revealed a high prevalence of overweight and obesity with values ranging from 31.6%, 61.4%, and 41.1% according to the measurement of BMI, skinfold thickness, and waist circumference, respectively. The results found a high level of correlation between BMI and skinfold thickness (P < 0.001, r = 0.712), between BMI and
waist circumference (P < 0.001, r = 0.884), and waist circumference and skinfold thickness (P < 0.001, r = 0.701). Conclusions: This study
revealed a high prevalence of overweight and obesity in Portuguese adolescents using three different anthropometric methods, where the BMI showed the lowest values of prevalence of overweight and obesity and the skinfold thickness showed the highest values. The three anthropometric methods were highly correlated.
Keywords:
Adolescent, BMI, Obesity, Skinfold thickness,Waist circumferenceAddress for correspondence: Dr. Beatriz Minghelli, Instituto Piaget - Escola Superior de Saúde Jean Piaget / Algarve – Enxerim – 8300-025, Silves, Portugal. E-mail: [email protected]
Access this article online
Quick Response Code:
Website: www.najms.org
DOI:
10.4103/1947-2714.122309
fat.[5] Measurement of ST is usually considered as a better method to evaluate body fat in adolescents compared with BMI, due to the fact that subcutaneous fat (40-60% of total body fat) can be directly measured with a caliper. However, this measurement in adolescents who have a high adiposity index can lead to discrepancies in the results where it is difficult to separate subcutaneous fat from muscles.[1,6] In addition, the validation of
these equations relating these measurements for each population is mandatory.[6]
WC is considered as highly sensitive and specific to assess the central body fat and may be useful in identifying overweight adolescents.[7] However, there are few accepted cutoff values for classifying overweight and obesity based on WC measures in adolescents.[8,9]
Considering the advantages and disadvantages of each method of anthropometric classification of excess adiposity in adolescents, reliable measurements of body fat and its distribution become necessary to obtain credible clinical and epidemiological data susceptible of being submitted to comparison studies allowing the population management of the consequences of overweight and obesity in adolescents. Thus, the aim of this study was to analyze the correlation between the measurements of BMI, ST, and WC to assess overweight and obesity in Portuguese adolescents.
Materials and Methods
The design of this epidemiological study was observational, analytical, and cross-sectional. The study was approved by the Ethics Committee of the Regional Health Administration of the Algarve, the Regional Directorate of Education of the Algarve, the Directorate General for Innovation and Curriculum Development, the Ministry of Education and Science and the directors of Schools that participated in the project.
The population involved students enrolled in public schools (26,217 students between the fifth and ninth grades) from all municipalities of the Algarve, from both sexes, aged between 10 and 16 years. Considering the population, the minimum sample size was defined as 777, considering an estimate of the annual prevalence of overweight of 25%, reported in national and international studies, and with an error margin of 3%.[8,10-14]
Students were divided into two groups: group 1 consisted of students aged 10-12 years and group 2 consisted of students aged 13-16 years. This division took into account the different phases of the growth period, where the individuals from the first group have not yet entered a period of pronounced growth,
primarily boys aged 13-16 years, when adolescents are in a period of accelerated pubertal growth.[15] The criteria of inclusion involved the students who were present on the data collection days, who had brought the parental or guardian consent and who wanted to participate.
A stratified random sample was used, where the target population was divided into subgroups considered homogeneous and then a sample from each stratum was randomly selected. That is, within each municipality schools were randomly selected (if there was more than one school in the municipality), and in each school some classes were selected to obtain the desired number of students per school. The sample distribution by the municipalities took into account the distribution of students enrolled in public schools.
Measurements
Body mass index
For the body weight measurement, we used a SECA 780 digital scale with a 150 kg capacity and a 100 g precision, and the height measurement was performed using a 200 cm stadiometer. In both measurements, students were standing upright, with no shoes and clothes of the day. For height measurement, students had their backs turned to the instrument, and their heads were positioned in the Frankfurt horizontal plane according to standard procedures.[2]
BMI was calculated and the adolescents were classified as thin, normal weight, overweight, and obese, according to the limits proposed by the WHO.[16]
The WHO uses the z-score, where a score below -2 classifies individuals as thin, a score higher than 1 and below 2 means overweight, and individuals with a score above 2 are considered obese. Adolescents with a z-score between -2 and 1 are considered to have a normal weight.[16]
Skinfold thickness
ST measurements were performed with the patient standing upright using a Slim Guide caliper with a 10 g/mm2 constant pressure on the tissue being measured. ST measurements were taken in triceps and in the subscapular region, in accordance with the procedures and criteria described by the WHO.[2] These measurements were made by two trained evaluators, with experience in these measurements, where one evaluator demarcated sites to be pinched and the other evaluator performed the measurement.
made of each ST and the average was obtained. This value was used in order to calculate the percentage of body fat, according to Lohman’s formula, and individuals were considered to have very low, low, adequate, moderately high, high, and excessively high fat percentage.[6]
Waist circumference
WC measurement was performed in the horizontal plane, with individuals standing upright, naked at the abdomen, and after normal expiration. Two consecutive measurements were made and the average was obtained. This measurement was always performed by a single evaluator.
A 150 cm inelastic and flexible measuring tape with 1 mm resolution was used, and it was positioned at the midpoint between the last rib and the upper edge of the iliac crest.
WC was related to the abdominal percentile table set for Portuguese adolescents.[17] Abdominal obesity was defined with a value of abdominal percentile equal to or above percentile 90. A value between percentile 75 and percentile 90 was defined as a high value of WC.[18] Thinness was identified by WC equal to or less than percentile 5.[19]
Statistical study
After a descriptive approach, to analyze correlations between the measurements obtained (in their quantitative form), we used Spearman’s coefficients, given the fact that the Gaussian distributions cannot be assumed (evaluated by Kolmogorov-Smirnov test).
After recoding the measurements using the already described approaches, the chi-square independency test was used in order to evaluate the difference between the weight status defined by BMI, ST, and WC. To ensure the applicability conditions of this test, the fat percentage classification was recoded into four categories: Thinness (very low and low fat percentage), normal weight, overweight (moderately high fat percentage) and obesity (high and excessively high fat percentage). The chi-square independency test was also used to determine differences between anthropometric methods and the sex and age of the students.
The statistical analysis was performed with the Statistical Package for Social Sciences (SPSS) version 19.0. Statistical significance was set at 0.05.
Results
From the 16 municipalities of the Algarve, only 2 of them refused to participate in the study. The minimum number
set for the sample size with an error margin of 3% was exceeded, with a sample of 966 students aged between 10 and 16 years (12.24 ± 1.53 years), where 437 (45.2%) were males and 529 (54.8%) were females (corresponding to an error of 2.68%). The students were divided into 2 predefined age groups, 574 (59.4%) of them were aged 10-12 years and 392 (40.6%) aged 13-16 years.
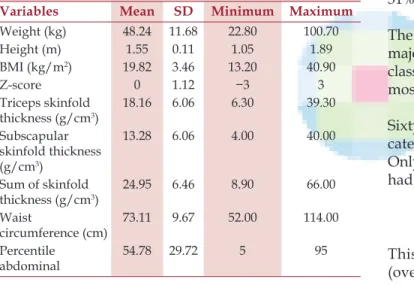
Table 1 shows the descriptive statistics of weight, height, BMI, z-score, triceps and subscapular ST, sum of ST, WC, and abdominal percentile.
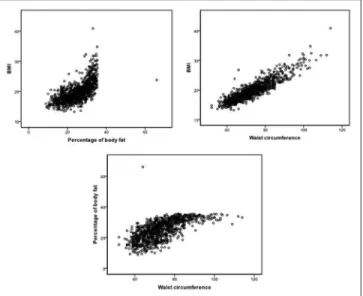
The relationship between BMI and ST showed a high level of correlation (P < 0.001, r = 0.712), the association between BMI and WC showed a high level of correlation as well (P < 0.001, r = 0.884), and high correlation was also observed between WC and ST (P < 0.001, r = 0.701) [Figure 1].
According to BMI, 81 students (8.4%) were classified as thin, 580 students (60%) as normal weight, 200 students (20.7%) as overweight and 105 students (10.9%) as obese. The chi-square independency test was used to determine differences between BMI and the sex and age of the students. The 10- to 12-year-old age group presented 41 students (50.6%) classified as lean, 132 students (66%) as overweight, and 84 students (80%) as obese (P < 0.01). Compared with boys, girls showed higher prevalence of thinness, observed in 50 girls (61.7%), whereas 116 girls (58%) were overweight and 57 girls (54.3%) were obese (P = 0.34) [Table 2].
The fat percentage was rated very low in only 2 (0.2%) students, low in 8 (0.8%), adequate in 363 (37.6%), moderately high in 253 (26.2%), high in 300 (31.1%) and very high in 40 (4.1%) students. The chi-square independency
test was also used to determine differences between classification weight status by ST and the sex and age of the students. In the 10- to 12-year-old age group, 6 students (60%) were classified as lean, 142 (56.1%) were overweight, and 211 (62.1%) were obese (P = 0.55). The highest prevalence of thinness was observed in girls, where 6 (60%) were classified as lean. The same was observed regarding excess adiposity, where 149 girls (58.9%) were overweight and 199 (58.5%) were obese (P = 0.018) [Table 2].
Considering the evaluation of WC, it was found that 24 students (2.5%) were classified as lean, 545 (56.4%) as normal weight, 182 (18.8%) as overweight, and 215 students (22.3%) were classified as obese. The chi-square independency test was used to determine differences between classification weight status by WC and the sex and age of the students. Most students classified as lean (66.7%), overweight (51.1%), and obese (70.2%) were included in the 10- to 12-year-old age group (P < 0.01). Girls showed higher adiposity, where 96 (52.7%) were
overweight and 148 (68.8%) were obese. The highest prevalence of thinness was observed in males, where 15 boys (62.5%) were classified as lean (P < 0.01) [Table 2].
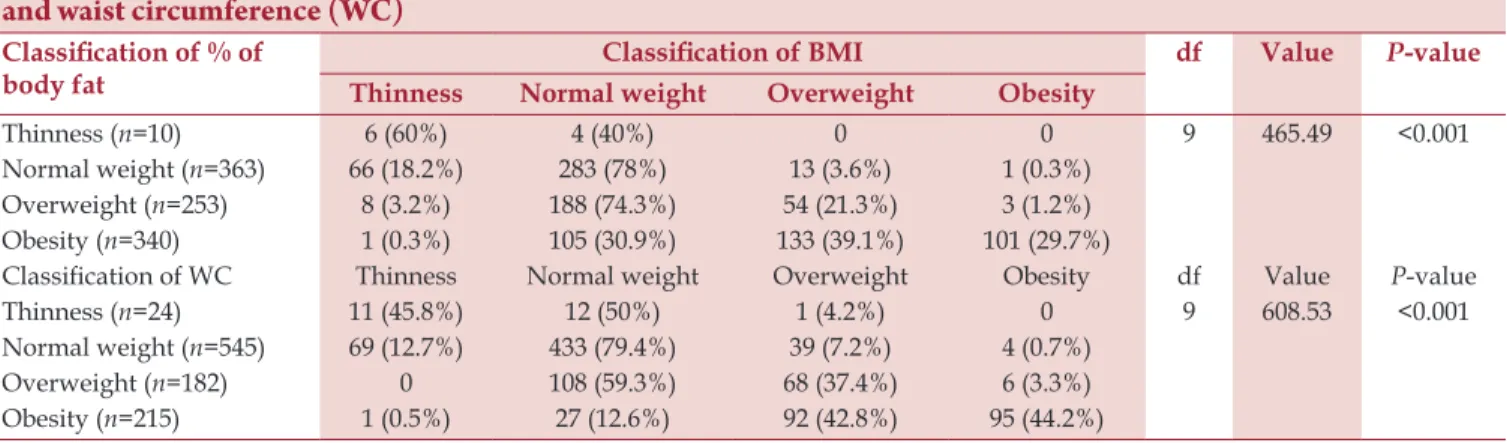
The relationship between the variables BMI and body fat percentage revealed that the majority of individuals classified as overweight in ST had already been rated overweight in BMI (P < 0.001) [Table 3].
About 46% of the subjects were classified in the same category according to BMI and ST classifications. Only 2% had higher ratings in BMI than in ST and 52% had higher ratings in ST than in BMI.
The association between the classification of BMI and WC revealed that the majority of students classified as overweight in BMI were obese in WC. However, most of the subjects classified as obese in BMI were also classified as obese in WC (P < 0.001) [Table 3].
Sixty-three percent of the subjects were classified in the same category according to the classification of BMI and WC. Only 6% had higher ratings in BMI than in WC and 31% had higher ratings in WC than in BMI.
The association between ST and WC revealed that the majority of students classified as overweight in ST were classified as normal weight in WC. Obesity was observed mostly in WC (P < 0.001) [Table 4].
Sixty percent of the subjects were classified in the same category according to the assessment of WC and ST. Only 6% had higher ratings in WC than in ST and 34% had higher ratings in ST than in WC.
Discussion
This study revealed a high prevalence of adiposity (overweight and obesity) in a representative sample of
Table 2: Cross tab between weight status classifications with gender and age group Classifications of weight
status
Gender Age group Total
Male Female dfvalueP-value 10-12 years 13-16 yearsdf value P-value
BMI Thinness 31 (38.3%) 50 (61.7%) 3 3.38 0.34 41 (50.6%) 40 (49.4%) 3 30.09 <0.01 81 (100%)
Normal weight 274 (47.2%) 306 (52.8%) 317 (54.7%) 263 (45.3%) 580 (100%)
Overweight 84 (42%) 116 (58%) 132 (66%) 68 (34%) 200 (100%)
Obesity 48 (45.7%) 57 (54.3%) 84 (80%) 21 (20%) 105 (100%)
% of body fat Thinness 4 (40%) 6 (60%) 3 10.09 0.018 6 (60%) 4 (40%) 3 2.13 0.55 10 (100%)
Normal weight 188 (51.8%) 175 (48.2%) 215 (59.2%) 148 (40.8%) 363 (100%) Overweight 104 (41.1%) 149 (58.9%) 142 (56.1%) 111 (43.9%) 253 (100%) Obesity 141 (41.5%) 199 (58.5%) 211 (62.1%) 129 (37.9%) 340 (100%) WC Thinness 15 (62.5%) 9 (37.5%) 3 24.11 <0.01 16 (66.7%) 8 (33.3%) 3 16.91 <0.01 24 (100%)
Normal weight 269 (49.4%) 276 (50.6%) 314 (57.6%) 231 (42.4%) 545 (100%) Overweight 86 (47.3%) 96 (52.7%) 93 (51.1%) 89 (48.9%) 182 (100%) Obesity 67 (31.2%) 148 (68.8%) 151 (70.2%) 64 (29.8%) 215 (100%)
Table 1: Descriptive Statistics of quantitative variables
Variables Mean SD Minimum Maximum
Weight (kg) 48.24 11.68 22.80 100.70
Height (m) 1.55 0.11 1.05 1.89
BMI (kg/m2) 19.82 3.46 13.20 40.90
Z-score 0 1.12 −3 3
Triceps skinfold thickness (g/cm3)
18.16 6.06 6.30 39.30
Subscapular skinfold thickness (g/cm3)
13.28 6.06 4.00 40.00
Sum of skinfold thickness (g/cm3)
24.95 6.46 8.90 66.00
Waist
circumference (cm) 73.11 9.67 52.00 114.00 Percentile
adolescents living in the south of Portugal, with values ranging from 31.6%, 61.4%, and 41.1% according to BMI, ST, and WC measurements, respectively.
Similar results were obtained by Coelho et al.,[10] who
evaluated 1875 students in Lisbon, aged 5-17 years and found that 30.5% of the subjects were overweight and obese in BMI according to the WHO criteria, the same used in this study. Ferreira[11] also obtained similar values for overweight and obesity (30.4%) in the assessment of BMI in 5708 students aged between 10 and 18 years from various regions of Portugal. However, the study used different criteria compared with the present study, using the classification of the International Obesity Task Force (IOTF).[19,20] Marques-Vidal et al.[21] (also in the Lisbon area) evaluated 5013 individuals aged 10-18 years and obtained a higher prevalence of overweight and obesity, 46.9%, using the IOTF criteria. Another national study[12] evaluated 22,048 individuals aged 10-18 years and found a prevalence of overweight and obesity of 22.6% and 31.7% according to the IOTF and the WHO criteria, respectively.
Amaral et al.[22] revealed a prevalence of overweight and obesity lower than that obtained in the present study, displaying a value of 17.1% obtained in the evaluation of BMI in 7563 adolescents in northern Portugal. However, the study used the IOTF criteria. Sikdar’s study revealed a prevalence of overweight even lower in individuals 10 years of age according to WHO criteria (9.6% in boys and 8% in girls).[23]
The reasons for the value differences observed in the classifications for overweight and obesity between studies can be explained by the methods used to construct the various references, especially the populations in which they are based, the cutoff points used, the methods used in curve construction, and the criteria used to specify the cutoff. For example, several studies have found that the WHO cutoffs produced higher values of prevalence of overweight and obesity compared with the IOTF.[12,24]
The highest prevalence of overweight and obesity was found in girls, according to three anthropometric methods. These data differ from those obtained in the Ferreira[11] study where the prevalence of overweight and obesity was higher in boys. In the Marques-Vidal et al.[21] study, only overweight was more prevalent in girls, with obesity being more prevalent in boys. However, the study of Merhi et al. did not find significant difference in BMI between the sexes.[25]
A possible explanation for higher prevalence of adiposity in females might be due to the greater amount of fat mass presented by adolescent girls compared with boys. In girls, regardless of chronological age, the pubertal development and the early menarche are associated to an increase in body fat.[1]
Regarding thinness, higher prevalence was found also in girls according to the three methods used, which might be related to a greater concern with body image in this sex.[26]
Table 3: Cross tab between weight status classifications, using Body Mass Index (BMI), body fat percentage, and waist circumference (WC)
Classification of % of
body fat Classification of BMI df Value
P-value
Thinness Normal weight Overweight Obesity
Thinness (n=10) 6 (60%) 4 (40%) 0 0 9 465.49 <0.001
Normal weight (n=363) 66 (18.2%) 283 (78%) 13 (3.6%) 1 (0.3%)
Overweight (n=253) 8 (3.2%) 188 (74.3%) 54 (21.3%) 3 (1.2%)
Obesity (n=340) 1 (0.3%) 105 (30.9%) 133 (39.1%) 101 (29.7%)
Classification of WC Thinness Normal weight Overweight Obesity df Value P-value
Thinness (n=24) 11 (45.8%) 12 (50%) 1 (4.2%) 0 9 608.53 <0.001
Normal weight (n=545) 69 (12.7%) 433 (79.4%) 39 (7.2%) 4 (0.7%)
Overweight (n=182) 0 108 (59.3%) 68 (37.4%) 6 (3.3%)
Obesity (n=215) 1 (0.5%) 27 (12.6%) 92 (42.8%) 95 (44.2%)
Table 4: Cross tab between weight status classifications, using body fat percentage and waist circumference (WC) Classification of % of
body fat Classification of WC df Value
P-value
Thinness Normal weight Overweight Obesity
Thinness (n=10) 0 10 (100%) 0 0 478.82 9 <0.001
Normal weight (n=363) 21 (5.8%) 312 (86%) 26 (7.2%) 4 (1.1%)
Overweight (n=253) 2 (0.8%) 154 (60.9%) 75 (29.6%) 22 (8.7%)
The highest prevalence of thinness, overweight, and obesity was also observed in students in the 10- to 12-year-old age group. The same result was obtained in the Ferreira[11] study where the highest prevalence of overweight and obesity was present in younger adolescents, aged between 10 and 13 years. The decline in overweight and obesity with increasing age is expected, since excess weight can be compensated by moderate growth.[26]
As mentioned earlier, the highest prevalence of overweight and obesity was obtained with the evaluation of ST and the lowest with BMI. The BMI values are higher in boys while triceps ST is higher in girls, as boys have increased weight gain during adolescence due to improved lean body mass and girls have higher weight gain due to increased fat mass.[27]
Despite the different values of the prevalence of overweight and obesity presented with the use of the three anthropometric methods, these reported a high level of correlation, the highest value obtained being the one regarding the correlation between BMI and WC (r = 0.884). Daniels et al.[7] compared WC, ST and BMI with DEXA in 201 individuals aged 717 years and found that WC was the best method (r = 0.80) as it was the least affected by gender, ethnicity and general adiposity. However, the Sardinha et al.[27] study evaluated methods for detecting obesity in 328 adolescents aged 10 and 15 years old and the results showed that the BMI and triceps ST measurements were moderately successful in the detection of obesity in this population, and that triceps ST provided the best results for obesity screening.
Ferreira et al.[28] evaluated 1550 Brazilian subjects aged between 7 and 11 years and concluded that BMI, according to the criterion of the Centers for Disease Control and Prevention, compared to WC and triceps and gastrocnemius ST, showed significant correlations in different classifications of overweight and obesity (r = 0.898, r = 0.86, respectively).
This study revealed that both BMI and other indicators of body fat are suitable to stratify the weight classifications in the analyzed population. However, we suggest new studies involving adolescents from other regions of the country and other ethnicities. Regarding the reliability of the anthropometric measures there was no process of reliability and this may have been a limitation of this study.
Since currently there are no values of BMI cutoff points defined for the Portuguese population, and the acquisition of a caliper to measure ST requires some costs and an experienced evaluator, we suggest the use
of WC in the evaluation of weight status in Portuguese adolescents, as it implies lower costs and currently there are reference values for the classification of overweight and obesity for this group.
Conclusions
This study has revealed a high prevalence of overweight and obesity in a representative and stratified sample of 966 adolescents residing in the south of Portugal using three different anthropometric methods: BMI, ST, and WC. By correlating these three anthropometric methods to the classification of weight status, there was a high level of correlation between them, and we can conclude that any of these methods can be used to assess the weight status of adolescents, the WC evaluation being considered the measurement with the highest agreement level with the other two methods. In addition, the classification of weight status by BMI calculation reveals the lowest prevalence of overweight and obesity, whereas through ST measurement the prevalence was the highest. Thus, the anthropometric method used should be taken into account when comparing the results between studies.
References
1. Rodríguez G, Moreno LA, Blay MG, Blay VA, Garagorri JM, Sarría A, et al. Body composition in adolescents:
Measurements and metabolic aspects. Int J Obes Relat Metab Disord 2004;28:S54-8.
2. World Health Organization. Physical Status: The use and interpretation of anthropometry. Report of a WHO Expert Committee. Geneva: WHO Technical Report Series no. 854; 1995.
3. De Onis M, Habicht JP. Anthropometric reference data for international use: Recommendations from a World Health Organization Expert Committee. Am J Clin Nutr 1996;64:650-8. 4. Glaber N, Zellner K, Kromeyer-Hauschild K. Validity of body
mass index and waist circumference to detect excess fat mass in children aged 7-14 years. Eur J Clin Nutr 2011;65:151-9. 5. American College of Sports Medicine (ACSM). Pre-exercise
evaluations. In: ACSM, editor. Guidelines for exercise testing and prescription. USA: Lippincott Willians and Wilkins; 2006. p. 39-54.
6. Fragoso I, Vieira F. Morfologia e crescimento. Lisboa: Faculty of human kinetics (FMH); 2000.
7. Daniels SR, Khourty PR, Morrison JA. Utility of different measures of body fat distribution in children and adolescents. Am J Epidemiol 2000;152:1179-84.
8. Lobstein T, Baur L, Uauy R; IASO International Obesity TaskForce. Obesity in children and young people: A crisis in public health. Obes Rev 2004;5(Suppl 1):4-85.
9. McCarthy HD, Jarrett KV, Crawley HF. The development of waist circumference percentiles in British children aged 5.0 ± 16.9 y. Eur J Clin Nutr 2001;55:902-7.
11. Ferreira J. Prevalência de obesidade infanto-juvenil: Associação com os hábitos alimentares, actividade física e comportamentos sedentários dos adolescentes escolarizados de Portugal Continental. Lisboa: Escola Nacional de Saúde Pública, Lisboa: Doutoramento em Saúde Pública, Universidade Nova de Lisboa; 2010.
12. Sardinha LB, Santos R, Vale S, Silva AM, Ferreira JP, Raimundo AM, et al. Prevalence of overweight and obesity
among Portuguese youth: A study in a representative sample of 10-18-year-old children and Adolescents. Int J Pediatr Obes 2011;6:e124-8.
13. Wang Y, Lobstein T. Worldwide trends in childhood overweight and obesity. Int J Pediatr Obes 2006;1:11-25. 14. European Environment and Health Information System.
Prevalence of overweight and obesity in children and adolescents. Geneva: World Health Organization; 2009. 15. Dandurand F, Shultz T. Automatic detection and quantification
of growth sports. Behav Res Methods 2010;42:809-23. 16. de Onis M, Onyango AW, Borghi E, Siyam A, Nishida C,
Siekmann J. Development of a WHO growth reference for school-aged children and adolescents. Bull World Health Organ 2007;85:660-7.
17. Sardinha LB, Santos R, Vale S, Coelho e Silva MJ, Raimundo AM, Moreira H, et al. Waist circumference percentiles for
Portuguese children and adolescents aged 10 to 18 years. Eur J Pediatr 2012;171:499-505.
18. Li C, Ford E, Mokdad AH, Cook S. Recent trends in waist circumference and waist-height ratio among US children and adolescents. Pediatrics 2006;118:e1390-8.
19. Cole TJ, Flegal KM, Nicholls D, Jackson AA. Body mass index cut offs to define thinness in children and adolescents: International survey. BMJ 2007;335:194.
20. Cole TJ, Bellizzi MC, Flegal KM, Dietz WH. Establishing a standard definition for child overweight and obesity worldwide: International survey. BMJ 2000;320:1240-3.
21. Marques-Vidal P, Ferreira R, Oliveira JM, Paccaud F. Is thinness more prevalent than obesity in Portuguese adolescents? Clin Nutr 2008;27:531-6.
22. Amaral O, Pereira C, Escoval A. Prevalência de obesidade em adolescentes do distrito de Viseu. Rev Port Saúde Pública 2007;25:47-58.
23. Sikdar M. Prevalence of malnutrition among the mising children of Northeast India: A comparison between four different sets of criteria. N Am J Med Sci 2012;4:305-9. 24. Twells LK, Newhook LA. Obesity prevalence estimates in a
Canadian regional population of preschool children using variant growth references. BMC Pediatr 2011;11:21.
25. Merhi BA, Al-Hajj F, Al-Tannir M, Ziade F, El-Rajab M. A survey of blood pressure in Lebanese children and adolescence. N Am J Med Sci 2011;3:24-9.
26. Pelegrini A, Silva DS, Gaya AC, Petroski EL. Comparison of three criteria for overweight and obesity classification in brazilian adolescents. Nutr J 2013;12:5.
27. Sardinha LB, Going SB, Teixeira PJ, Lohman TG. Receiver operating characteristic analysis of body mass index, triceps skinfold thickness, and arm girth for obesity screening in children and adolescents. Am J Clin Nutr 1999;70:1090-5. 28. Ferreira AP, Ferreira CB, Mota MR, Fonseca RM, Nóbrega
OT, Oliveira RJ, et al. Comparação entre o critério do CDC
e outros indicativos de gordura corporal para avaliação do estado nutricional. Arq Ciênc Saúde 2008;15:75-81.
How to cite this article: Minghelli B, Nunes C, Oliveira R. Prevalence of overweight and obesity in portuguese adolescents: Comparison of different anthropometric methods. North Am J Med Sci 2013;5:653-9.
Source of Support: Program to Support Advanced Training of Teachers of the Higher Polytechnic Education by Foundation for Science and Technology - FCT (SFRH/PROTEC/67663/2010). Conflict of Interest: None.
Announcement
iPhone App