ABSTRACT: Objective:To measure the delays in tuberculosis (TB) suspicion and diagnosis and to identify factors related. Methods: We deined the delay in TB suspicion as the time between the perception of the symptoms by the patient and the search for health-care service and the diagnosis, as the time between the irst visit to the health-care service and the diagnosis. We interviewed 100 patients treated at the health services in São José do Rio Preto that were diagnosed and reported/notiied in 2008 and 2009, and the delays were quantiied. We obtained the possible explanatory variables from interviews and secondary information available in the surveillance system. The addresses of TB patients and health-care services were geocoded. Variables were assessed by multiple linear regression analysis and, when spatial dependency was detected, by spatial regression. Results: The median values for the delays in TB suspicion and diagnosis were both 15 days. The irst was modeled by linear regression and a positive relationship was found with the distances covered by the patients in order to get primary health-care service. The last was modeled by spatial regression and a positive relationship was found with the age and the frequency with the patients sought health-care services and a negative relationship with the pulmonary clinical form. Conclusion: The study revealed the existence of gaps in TB control activities related to the patients and the organization of the health-care services and showed the importance of taking into account the spatial dependence of the phenomena analyzed.
Keywords: Tuberculosis. Diagnosis. Health care (public health). Accessibility. Geographic information systems. Spatial analysis.
Delays in tuberculosis suspicion
and diagnosis and related factors
Atrasos na suspeita e no diagnóstico de tuberculose e fatores relacionados
Natália Sperli Geraldes Marin dos Santos SasakiI, Maria de Lourdes Sperli Geraldes dos SantosII, Silvia Helena F. VendraminiII, Antonio Ruino-NettoIII, Teresa Cristina Scatena VillaIV,
Francisco Chiaravalloti-NetoV
IUnião das Faculdades dos Grandes Lagos – São José do Rio Preto (SP), Brazil. IISchool of Medicine of São José do Rio Preto – São José do Rio Preto (SP), Brazil. IIISchool of Medicine of Ribeirão Preto, Universidade de São Paulo – Ribeirão Preto (SP), Brazil. IVNursing School of Ribeirão Preto, Universidade de São Paulo – Ribeirão Preto (SP), Brazil. VSchool of Public Health of Universidade de São Paulo – São Paulo (SP), Brazil.
Corresponding author: Francisco Chiaravalloti-Neto. Avenida Doutor Arnaldo, 715, CEP: 01246-904, Cerqueira César, São Paulo, SP, Brasil. E-mail: [email protected]
Conlict of interests: nothing to declare – Financial support: FAPESP (process No. 2008/07904-4) and CNPQ — Edital MCT/ CNPq/CT-Saúde/MS/SCTIE/DECIT (process No. 034/2008).
INTRODUCTION
Early diagnosis and appropriate treatment are essential to reduce the spread of tubercu-losis (TB). The detection of cases depends on the passive search for respiratory symptoms, the visit by the patient to the health-care service (HCS), and on the fast suspicion by the service so that they ask for a smear for the diagnosis1. The efective control of the disease
depends on the search for primary health care (PHC), by the patient, within the period of 2–3 weeks2,3 and the action of the PHC as a gateway for the services; facilitating the access
and promoting full quality care; aiming at promoting, protecting, and recovering health4.
Accessibility, understood as the adjustment degree between the HCS and the population in search for health care, is connected to the conception and the way of coping with the disease, deined by dif-ferent dimensions: organizational, sociocultural, economical, and geographical5. The inequalities of
access, the behavior of the population, the lack of professional qualiication, and the structural problems of the HCSs are factors that interfere in the efectiveness of policies in the ight against TB6 and delay
the suspicion and diagnosis of TB to beyond what is considered appropriate for an efective control7.
The access to diagnosis depends on the access to the HCSs4,5, which are under the
inlu-ence of the infrastructure, transportations and distances traveled by the patients, resulting in delays in the suspicion by the patients (delay in suspicion) and in the suspicion and con-irmation by the service (delay in diagnosis), both being important aspects of accessibility8.
The measuring of these delays and the identiication of factor that act on them may contrib-ute for the understanding of the phenomenon and the improvement of access to the services. Thus, the objectives of this study were to measure the delays in suspicion and diagnosis of TB and to identify factors related to those.
RESUMO: Objetivo: Medir os atrasos na suspeita e no diagnóstico de tuberculose (TB) e identiicar fatores relacionados. Métodos: O atraso na suspeita foi deinido como o tempo entre a percepção, pelo doente, dos sintomas até a procura pelo primeiro atendimento e no diagnóstico, como o tempo entre o primeiro atendimento até a realização do diagnóstico. Foram entrevistados 100 doentes, diagnosticados e notiicados em 2008 e 2009, atendidos em serviços de saúde (SSs) de São José do Rio Preto, para os quais foram quantiicados os atrasos. As possíveis variáveis explicativas foram obtidas das entrevistas e de informações secundárias disponíveis no sistema de vigilância. Os endereços dos casos e dos serviços de saúde foram geocodiicados. As variáveis foram analisadas por regressão linear múltipla e, quando da identiicação de dependência espacial dos seus resíduos, por regressão espacial. Resultados: As medianas, tanto para o atraso na suspeita como no diagnóstico, foram 15 dias. O atraso na suspeita foi modelado por regressão linear e mostrou-se associado positivamente com as distâncias percorridas pelos doentes para obter o primeiro atendimento e negativamente com a religião (não cristã). O atraso no diagnóstico foi modelado por regressão espacial e mostrou-se associado positivamente com idade e número de vezes que o doente procurou o SS e negativamente com a classiicação do caso (TB pulmonar). Conclusão: O estudo revelou lacunas nas ações de controle da TB relacionadas aos doentes e à organização dos serviços e mostrou a importância de se levar em conta a dependência espacial dos fenômenos analisados.
METHODS
The study about the factors involved in the delayed suspicion and diagnosis of TB was carried out in São José do Rio Preto, using a cross-sectional design. The city located in the northwest region of the state of São Paulo, had, in 2010, 408,258 inhabitants, with good socioeconomic conditions9 and is classiied as a priority in the state for the control of TB10.
A sample of 100 patients was taken among all diagnosed and notiied cases, December 2008 onward, living in the municipality, who sought for health care in the HCS, older than 18 years of age, out of the prison system, without mental disorders, and according to partic-ipate in the research. Abandonment, death, and change of diagnosis were exclusion criteria. The data were obtained through the use of a structured questionnaire based on the instru-ment proposed by Villa and Ruino-Netto11, previously tested and validated. The patients
were selected based on information from the Notiiable Diseases Information System (Sistema de Informação de Agravos de Notiicação – SINAN). Secondary sources were used based on the medical records and data from SINAN.
The analysis of the accessibility to the diagnosis was performed through geocoding of the addresses of the TB cases and of the HCSs. The distances traveled by the patients between their residence to the irst HCS sought, after the perception of the disease until the diagnosis in the service, were obtained.
It was identiied, based on the clinical form of the disease10 and on the areas covered by
the PHC, the service the patient should look for, which was compared to the services sought for the irst time and the one that made the diagnosis. These comparisons produced dichot-omous variables representing the care provided, or not, in the recommended locations and in or out of the areas covered by the PHC.
The classiication of the TB case was used in order to deine the ideal path to be taken by the patient, compared to the path taken in various situations (irst service sought when one felt sick, diagnosis service), calculating the real (RD) and ideal distance (ID). The RD is the one that the patient traveled for the irst service care and for the diagnosis of the TB. It was considered as the ID that should be traveled taking into account the territory which the patient belonged to and the classification of the case. For the coinfected patients with the human immunodeiciency virus (HIV), the specialized care service, which con-ducts the monitoring of the HIV, was considered the gateway to the service and, for the rest of them, the PHC. In performing the diagnosis, for extrapulmonary cases, the second-ary services were also considered.
The RD and ID values were obtained by the ArcGIS 10.1 software. The diference between them represented the variables “diference of the traveled distances in regarding the irst care and diagnosis,” categorized in: negative or null diference (RD ≤ ID: the patient traveled a shorter or equal distance to the ideal one) and positive diference (RD > ID: the traveled distance was further than the ideal one).
performed relating dichotomized dependent variables in lower or higher or equal values to the respective medians, once these last ones are a sign of excessive delay in the suspicion by the patient and in the diagnosis of TB1,2.
In the multiple linear regression analysis, dependent variables were considered as con-tinuous (days of delay) and their normality was assessed through the Komolgorov–Smirnov test. The distal variables of gender and age were considered control variables and the oth-ers independent variables were included in the models when the respective p-values were lower or equal to 0.05.
Once obtained the models of multiple linear regression for the delays, their respective residues, and overall Moran indexes were calculated, using the neighboring matrix obtained by the GeoDa software (four closest neighbors). The regression model of delays, which showed a signiicant result for the overall Moran index (p < 0.05), was tested based on the following spatial model:
Y = Xβ + λWY + u, sendo u = ρWu + ε e ε ∼N* (0,σ2)
where Y is the dependent variable; X, the matrix with the values of the independent vari-ables; β, the vector with the regression coeicients; W, the neighbor matrix; λ and ρ are the spatial autocorrelation coeicient; u is the noise or disruption; and ε, the random error. The existing spatial dependency may be attributed to Y and to be included in the model with the term λWY. Another possibility, which may be considered along with the irst one, is to treat the spatial efects such as the noise to be removed, which may be associated to the error and represented by ρWu13.
One approach, to this model, based on estimators of generalized moments and semi parametric methods for the estimation of coeicients of the variance–covariance matrix, allowing at the same time the testing of hypothesis that the dependent variable (spatial lag model) and that the error term (spatial error model) are spatially correlated13. This
model-ing was carried out in the sphet Pack of the R program14.
This research was evaluated and approved by the Research Ethics Committee of the School of Medicine of São José do Rio Preto (FAMERP).
RESULTS
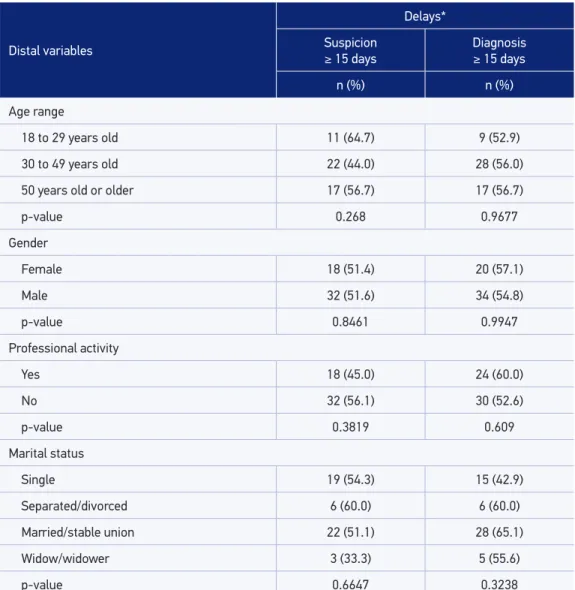
Table 1. Bivariate analysis of the relation between the distal explainable variables of age, gender, professional activity and marital status and delay in the suspicion and diagnosis of tuberculosis
longer or equal to 15 days, São José do Rio Preto, São Paulo, 2009.
Distal variables
Delays*
Suspicion
≥ 15 days
Diagnosis
≥ 15 days
n (%) n (%)
Age range
18 to 29 years old 11 (64.7) 9 (52.9)
30 to 49 years old 22 (44.0) 28 (56.0)
50 years old or older 17 (56.7) 17 (56.7)
p-value 0.268 0.9677
Gender
Female 18 (51.4) 20 (57.1)
Male 32 (51.6) 34 (54.8)
p-value 0.8461 0.9947
Professional activity
Yes 18 (45.0) 24 (60.0)
No 32 (56.1) 30 (52.6)
p-value 0.3819 0.609
Marital status
Single 19 (54.3) 15 (42.9)
Separated/divorced 6 (60.0) 6 (60.0)
Married/stable union 22 (51.1) 28 (65.1)
Widow/widower 3 (33.3) 5 (55.6)
p-value 0.6647 0.3238
*Percentages calculated on the total lines and refering to the delays ≥ 15 days.
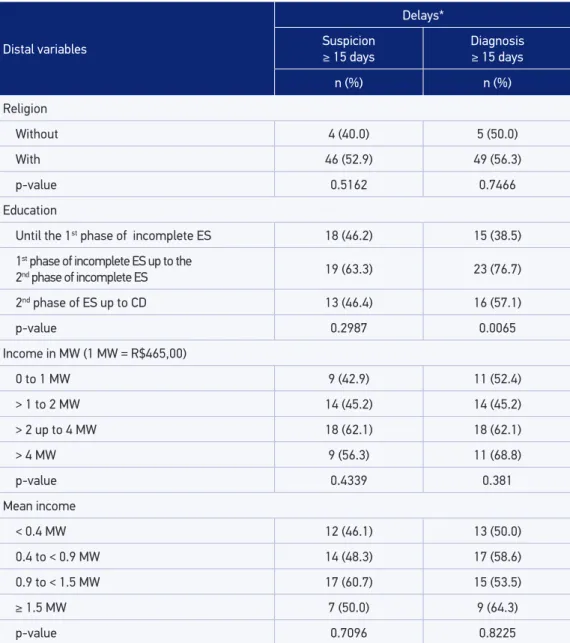
Table 2. Bivariate analysis of the relation between the distal explanatory variables of religion, education and income and the delay in the suspicion and diagnosis of tuberculosis longer or
equal to 15 days, São José do Rio Preto, São Paulo, 2009.
Distal variables
Delays*
Suspicion
≥ 15 days
Diagnosis
≥ 15 days
n (%) n (%)
Religion
Without 4 (40.0) 5 (50.0)
With 46 (52.9) 49 (56.3)
p-value 0.5162 0.7466
Education
Until the 1st phase of incomplete ES 18 (46.2) 15 (38.5)
1st phase of incomplete ES up to the
2nd phase of incomplete ES 19 (63.3) 23 (76.7)
2nd phase of ES up to CD 13 (46.4) 16 (57.1)
p-value 0.2987 0.0065
Income in MW (1 MW = R$465,00)
0 to 1 MW 9 (42.9) 11 (52.4)
> 1 to 2 MW 14 (45.2) 14 (45.2)
> 2 up to 4 MW 18 (62.1) 18 (62.1)
> 4 MW 9 (56.3) 11 (68.8)
p-value 0.4339 0.381
Mean income
< 0.4 MW 12 (46.1) 13 (50.0)
0.4 to < 0.9 MW 14 (48.3) 17 (58.6)
0.9 to < 1.5 MW 17 (60.7) 15 (53.5)
≥ 1.5 MW 7 (50.0) 9 (64.3)
p-value 0.7096 0.8225
*Percentages calculated on the total line and regarding the delays ≥ 15 days.
MW: minimum wage; ES: elementary school; CD: college degree.
the HCS that performed the most diagnosis of the disease was the hospital (46%), followed by the PHC (38%).
Table 3. Bivariate analysis of the relation between medial explanatory variables and the delay in the suspicion and diagnosis of tuberculosis longer or equal to 15 days, São José do Rio Preto, São Paulo, 2009.
Medial variables
Delays*
Suspicion
≥ 15 days
Diagnosis
≥ 15 days
n (%) n (%)
Tests performed in the location
Yes 31 (47.7) 33 (50.8)
No 19 (59.4) 21 (65.6)
p-value 0.3862 0.2430
Nº of times one sought for the HCS
1 – 8 (26.7)
2 – 8 (42.1)
3 and 4 – 13 (61.9)
5 or more – 25 (92.6)
p-value – 0.0000
Type of HCS to be sought**
Polyclinic 8 (34.8) –
SCS/TCP/UU 7 (50.0) –
PHC 17 (58.6) –
PHC-F 8 (66.7) –
p-value 0.2330 –
First care in the recommended HCS**
Yes 5 (31.3) –
No 35 (56.5) –
p-value 0.1291 –
Diference of the traveled distances in relation to the irst**
RD ≤ ID 17 (42.5) –
RD > ID 23 (60.5) –
p-value 0.1721 –
Diagnosis in the recommended HCS**
Yes – 15 (53.6)
No – 28 (56.0)
p-value – 0.9757
Diference in the distances traveled for the diagnosis**
RD ≤ ID – 19 (57.5)
RD > ID 24 (53.3)
p-value – 0.8873
*Percentages calculated on the total lines and refering to the delays ≥ 15 days; **Tabulation based on the 78 cases of
geocoded TB.
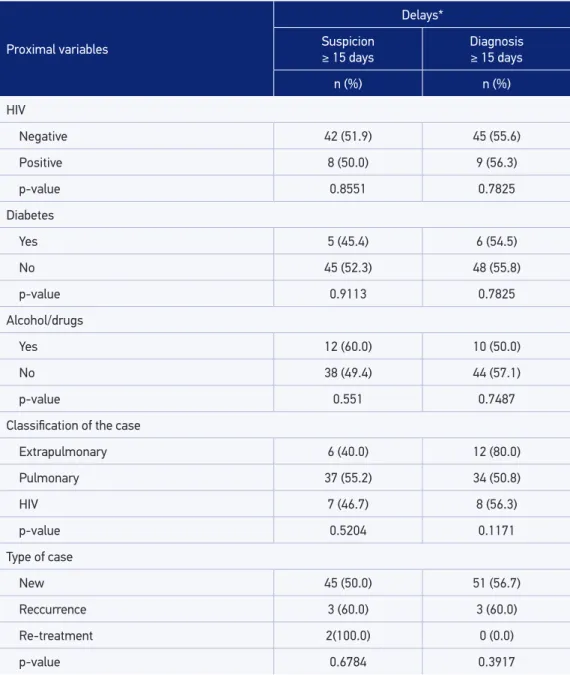
Table 4. Bivariate analysis of the relation between proximal explanatory variables and delay in
the suspicion and diagnosis longer or equal to 15 days, São José do Rio Preto, São Paulo, 2009.
Proximal variables
Delays*
Suspicion
≥ 15 days
Diagnosis
≥ 15 days
n (%) n (%)
HIV
Negative 42 (51.9) 45 (55.6)
Positive 8 (50.0) 9 (56.3)
p-value 0.8551 0.7825
Diabetes
Yes 5 (45.4) 6 (54.5)
No 45 (52.3) 48 (55.8)
p-value 0.9113 0.7825
Alcohol/drugs
Yes 12 (60.0) 10 (50.0)
No 38 (49.4) 44 (57.1)
p-value 0.551 0.7487
Classiication of the case
Extrapulmonary 6 (40.0) 12 (80.0)
Pulmonary 37 (55.2) 34 (50.8)
HIV 7 (46.7) 8 (56.3)
p-value 0.5204 0.1171
Type of case
New 45 (50.0) 51 (56.7)
Reccurrence 3 (60.0) 3 (60.0)
Re-treatment 2(100.0) 0 (0.0)
p-value 0.6784 0.3917
*Percentage calculated on the total lines and refering to the delays ≥ 15 days.
HIV: human immunodeiciency virus.
patients whose address could be geocoded were considered. The reasons for non-geocod-ing were livnon-geocod-ing in the rural area or invalid address.
The Kolmogorov-Smirnov normality test showed that the delay in the suspicion and diagnosis do not show normal behavior. After transformation by the use of the neperian logarithm plus one-tenth, due to some null values, they have presented normal approximate behavior (Kolmogorov-Smirnov tests, p = 0.1107 and p = 0.3453, respectively).
*Gender Female as category base; **extrapulmonary TB as category base. TB: tuberculosis; HIV: human immunodeiciency virus; HCS: health care service.
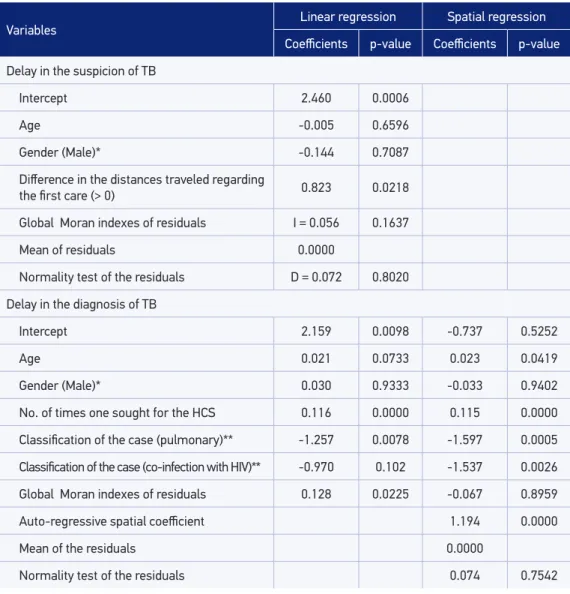
Table 5. Model of multiple linear regression and spatial regression of the delay in the suspicion and diagnosis of tuberculosis, global Moran índex, medians and normality tests of the regression
residuals, São José do Rio Preto, São Paulo, 2009.
Variables Linear regression Spatial regression
Coeicients p-value Coeicients p-value
Delay in the suspicion of TB
Intercept 2.460 0.0006
Age -0.005 0.6596
Gender (Male)* -0.144 0.7087
Diference in the distances traveled regarding
the irst care (> 0) 0.823 0.0218
Global Moran indexes of residuals I = 0.056 0.1637
Mean of residuals 0.0000
Normality test of the residuals D = 0.072 0.8020
Delay in the diagnosis of TB
Intercept 2.159 0.0098 -0.737 0.5252
Age 0.021 0.0733 0.023 0.0419
Gender (Male)* 0.030 0.9333 -0.033 0.9402
No. of times one sought for the HCS 0.116 0.0000 0.115 0.0000
Classiication of the case (pulmonary)** -1.257 0.0078 -1.597 0.0005
Classiication of the case (co-infection with HIV)** -0.970 0.102 -1.537 0.0026
Global Moran indexes of residuals 0.128 0.0225 -0.067 0.8959
Auto-regressive spatial coeicient 1.194 0.0000
Mean of the residuals 0.0000
Table 5 presented the multiple linear regression models obtained and the overall Moran indexes calculated for the residue of both models (suspicion and diagnosis), considering it was not signiicant for the delay in the suspicion, but it was signiicant for the diagnosis. Once obtained the linear regression model for the delay in the diagnosis and identiied the need of considering the existence of spatial dependency, the tests of hypothesis performed showed that there was a need of considering in the regression model a spatial lag term (λ = 1.194; p = 0.000), but there would be no need to consider a representative term of spatial error (p = 0; p > 0.05).
The model obtained for the delay in suspicion has shown that the distance traveled by the patient (controlled by age and gender) was higher than the ideal one, with an increase of this type of delay. The residuals of this model presented mean equal to zero, normal dis-tribution and constant variance. The model obtained to the delay in the diagnosis showed that the number of times a patient sought for the HCS and having pulmonary TB (in rela-tion to extrapulmonary TB) presented, respectively, positive and negative relarela-tion with this delay, with results also controlled by age and gender. After the introduction of the spatial lag term in the model (1.194 Wy), its residuals presented mean equal to zero, normal distribu-tion, and constant variance. Comparing this spatial model to the multiple linear regression model, alterations in the values of the coeicients of regression of some of the variables were veriied (Table 5).
DISCUSSION
The early detection and the eicient treatment of pulmonary TB represent the main measure in order to interrupt the transmission chain of the disease1,3 and are indicatives of
a successful program15. An acceptable recommended time interval for the onset of
symp-toms up to the diagnosis was not found in the literature; however, some authors considered the reported mean or median of the times of delay for the diagnosis as a parameter2,16-22.
This study considered the median, given that “time” is an asymmetric variable1,20,22. In
rela-tion to the suspicion by the patient and the operarela-tional aspects (diagnosis), in this study, both medians were 15 days.
The delay in the suspicion of TB by the patient may be inluenced by the organiza-tion of diferent systems of health care, being lower when easily accessible and provided for free1. Despite the global availability of care in HCS, negative social factors tend to
con-strain the access to less favored segments of the community8,20,22,23. Patients spend a great
deal of time and money searching for alternative solutions in order to alleviate the signs and symptoms before starting the treatment, and, many times, they do not get an efective diagnosis or tretament19.
such as poverty, the lack of knowledge about TB, education, and distance from the resi-dence to the HCSs19,21.
The time of delay must be considered for the diagnosis in a few days, once that the smear microscopy must be performed immediately. Literature shows that it revolves around 3–4 weeks, being three the maximum recommended time3,21,24, and studies show a delay in
the diagnosis, after the search by the patient in the irst care unit3,19,24.
The HCSs must be organized for one of the main challenges in the control of TB, which is to improve the detection of cases, through the active search for respiratory symptoms, despite the usual practice, which is using passive search. In this sense, it is noteworthy the importance of the PHC in this early diagnosis, by being the main gateway for the Uniied Health System (Sistema Único de Saúde – SUS) and using health technologies that are able to solve the higher frequency and relevant problems in their territory. The literature shows laws in the struc-ture and functioning of the current health model, situations that represent the most important factor in the delay of the diagnosis of TB, and attributes this fact to the dysfunctions in the lev-els of health care, having a strong impact on the access of patients to these places. The great barriers are identiied in the access to health care, in the relation between the team and the patient and in the organization of the services for the control of TB3,8,24.
The variable “diference of the traveled distances related to the irst care,” positively and signiicantly associated in this study to the delay in the suspicion with the “irst care in the recommended HCS,” even if not considered as a model. The negative response means higher proportions in the delay of suspicion and probable larger traveled distances. Traveling a dis-tance farther than the ideal one may also be related to geographic barriers that interfere in the search and choice for the irst care3,19.
Among those who traveled a farther distance than the ideal one, we may identify the search for an urgency unit instead of a PHC and the search for another PHC service other than the recommended one (by higher ainity, greater proximity to the workplace, easier to access in relation to the recommended PHC, schedule, availability for appointments, among others). Even among those in which the traveled distance was the same as the ideal one, when searching for polyclinics (PHC and urgency unit), they preferred the urgency unit as a gateway. Many studies with similar results have attributed this reality to the lack of comprehension of the patient about the entry door and the factors related to the orga-nization of the PHC services, with a restricted schedule, scheduling criteria, and lack of classiication of urgency and emergency risk25,26.
From the variables associated to the delay in the diagnosis, the “classiication of the case” is related to the fact that the diagnosis of extrapulmonary forms is made from clinical evi-dences and laboratory indings suggesting active forms in patients with at least one positive culture for Mycobacterium tuberculosis in extrapulmonary material27. There is diiculty in the
clinical diagnosis, once that the symptoms are not speciic and insidious, being, many times, made by exclusion of other diseases23,28,29. Another important factor is related to the search
for the patient after worsening of the clinical condition23,29.Both situations correspond to
In relation to the “number of times the patient sought for the HCS,” the many visits made, by the patient, to the HCSs until they got the diagnosis may be related to the dii-culty by the health professional in dealing with TB, with few diagnoses made in the irst consultation28. This situation produces the worsening of the clinical condition and results,
many times, in the hospitalization of the patient, whose diagnosis is made in hospitals, as shown in the result of this research.
Once that the TB cases are in the geographic space and the variables related to them may have spatial autocorrelation, the evaluation of the factors related to the delays demands the use of spatial analysis technology which, along with the Geographic Information Systems (GIS), contribute to the evaluation and planning of health actions in order to identify access diiculties to the HCSs30.
The knowledge and understanding of the spatial distribution of phenomena, especially for diseases and illnesses which afect human beings, and the incorporation of space in the analysis to be performed have always been on the agenda, as demonstrated by the studies of John Snow, in the nineteenth century, in order to elucidate the mechanisms of chol-era transmission31,32. However, the speed of this merger has been diferent in the areas of
knowledge; in health, its implementation in the studies of diseases and conditions has been happening in a slower speed than in other areas33. Another important matter to be
consid-ered, even with the advances in the use of GISs and spatial analysis, is that not all studies dealing the space information take into account the possibility of the analyzed information being spatially autocorrelated34.
In this sense, 12 studies on the occurrence of TB were selected in the literature in geo-graphic locations of diferent scales (place of residence, census sectors, neighborhoods, districts, municipalities, regions, and countries), which used some kind of regression analy-sis. Of these, nine did not consider in the modeling the possibility of spatial autocorrelation of the dependent variables and/or resulting residuals35. Only in the studies developed by
Ng et al.36, Liu et al.37, and Antunes and Waldman30, there was this concern. In the
remain-ing38-46, this possibility was not considered and models with non-independent residuals may
have been produced, with not properly estimated regression coeicients (super- or sub-di-mensioned, or even with sense inversion)35.
In the study developed by Ng et al.36, the procedures used were the same as the ones in
the delay study. The authors, after the carrying out a OLS (Ordinary least squares) model, identiied the spatial dependency of the residuals. After modeling by spatial regression, a spa-tial lag parameter was introduced in the model and the regression coeicients sufer changes in their values. Ng et al.36 concluded that the incidence of TB of a determined municipality
sufered the inluence of these rates observed in their neighbors. A similar approach was used by Antunes and Waldman30 in order to study the relation between mortality by TB in
the districts of São Paulo municipality.
The studies developed by Liu et al.37 combined models of regression by minimum
the possible existence of spatial dependency in the variables involved in the multire-sistant phenomenon.
In the study of the delay in the TB suspicion, the OLS model was proven adequate, once that its residuals were independent, with mean equal to zero and constant variance35.
In the delay of the TB diagnosis, after the detection of spatial dependency in the residuals of OLS regression and the performing of the spatial regression analysis, it was obtained, as seen, a new model. In the case of this model, the spatial dependency found may be related to endogenous factors, once that it was assigned to the dependent variable35.
The results obtained in this study and in the studies developed by Ng et al.36, Liu et al.37,
and Antunes and Waldman30 showed that, in studies evaluating phenomena that occur on
the space, the use of modeling by regression without considering the spatial dependency of the dependent variables or the regression residuals may not be appropriate, resulting in models that violate the assumptions of this kind of modeling34,35.
CONCLUSION
It is concluded in this study that in the municipality of São José do Rio Preto (SP), the median time in delay in the suspicion and diagnosis of TB was, for both aspects, equal to 15 days and the factors that contributed for the increased delays were, in case of suspicion, the patient traveling a distance farther than the ideal one (diference of the traveled distances in relation to the irst care) and, in case of diagnosis, the patient having sought for the HCS for more than once and having extrapulmonary TB extrapulmonar, revealing gaps in the control actions of TB related to patients and the organization of the services.
The consideration of the spatial dependency of the phenomena studied and the use of modeling by spatial regression contribute for obtaining of more accurate models in an attempt of inding explanatory factors of the variability of the delays, which allows prop-erly directing of resources in order to improve the TB control actions.
1. Van Der Werf MJ, Chechulin Y, Yergorova OB, Marcinuk T, Stopolyanskiy A, Voloschhuk V, et al. Health care seeking behavior for tuberculosis symptoms in Kiev City, Ukraine. Int J Tuberc Lung Dis 2006; 10: 390-5. 2. Sreeramareddy CT, Panduru K, Menten V, Joris, Van
den Ende J. Time delays in diagnosis of pulmonary tuberculosis: a systematic review of literature. BMC Infec Dis 2009; 9: 91.
3. Yimer S, Bjune G, Alene G. Diagnostic and treatment delay among pulmonary tuberculosis patients in Ethiopia: a cross sectional study. BMC Infect Dis 2005; 5: 112.
4. Starfield B. Atenção primária: equilíbrio entre necessidades de saúde, serviços e tecnologia. Brasília: UNESCO/Ministério da Saúde; 2002.
5. Fekete MC. Estudo da Acessibilidade na Avaliação dos Serviços de Saúde. In: Santana JP, Santos I, Fekete MC, Galvão EA, Mandelli MJ, Penna MFL, et al. Desenvolvimento Gerencial de Unidades Básicas do Sistema Único de Saúde (SUS). Brasília: OPS; 1997. 6. Lienhardt C, Ogden JA. Tuberculosis control in
resource-poor countries: have we reached the limits of the universal paradigm? Trop Med Int Health 2004; 9: 833-41.
7. Sá LD, Rodrigues DCS, Barrêto AJR, Oliveira AAV, Pinheiro PGOD, Nogueira JA. A organização da estratégia saúde da família e aspectos relacionados ao atraso do diagnóstico da tuberculose. Cogitare Enferm 2011; 16: 437-42.
8. Hane F, Thiam S, Fall AS, Vidal L, Diop AH, Ndir M, Lienhardt C. Identifying barriers to effective tuberculosis control in Senegal: an anthropological approach. Int J Tuberc Lung Dis 2007; 11: 539-43. 9. São José do Rio Preto. Secretaria Municipal de
Planejamento e Gestão Estratégica. Conjuntura Econômica; 2008.
10. Brasil. Secretaria de Vigilância em Saúde. Departamento de Vigilâncias das Doenças Transmissíveis. Programa Nacional de Controle da Tuberculose. Nota técnica 15 CGPNCTIDEVEP/SVS/MS. Brasília: Secretaria de Vigilância em Saúde; 2011.
11. Villa TCS, Ruino-Netto A. Questionário para avaliação de desempenho de serviços de atenção básica no controle da tuberculose no Brasil. J Bras Pneumol 2009; 35: 610-12.
12. Victora CG, Huttly SR, Fuchs SC, Olinto MT. The role of conceptual frameworks in epidemiological analysis: a hierarchical approach. Int J Epidemiol 1997; 26: 224-7.
13. Kelejian HH, Prucha IR. Speciication and estimation of spatial autoregressive models with autoregressive and heteroskedastic disturbances. J Econometrics 2010; 157: 53-67.
14. Piras G. Estimation of spatial autoregressive models with and without heteroskedastic innovations; 2013. Available from: https://cran.r-project.org/web/ packages/sphet/sphet.pdf. (Acessado em 8 de julho de 2014).
15. Ibrahim S, Van der Loef MS, Mubiru M, Konde-Lule J, Cobelens F. Long delays and missed opportunities in diagnosing smear-positive pulmonary tuberculosis in kampala, uganda: a cross-sectional study. PLoS ONE 2010; 5: 14459.
16. Maior ML, Guerra RL, Cailleaux-Cezar M, Golub JE, Conde MB. Tempo entre o início dos sintomas e o tratamento de tuberculose pulmonar em um município com elevada incidência da doença. J Bras Pneumol 2012; 38: 202-9.
17. Silva-Sobrinho RA, Andrade RLP, Ponce MAZ, Wysocki AD, Brunello ME, Scatena LM, et al. Retardo no diagnóstico da tuberculose em município da tríplice fronteira Brasil, Paraguai e Argentina. Rev Panam Salud Publica 2012; 31: 461-8.
18. Souza KMJ de, Villa TCS, Assolini FEP, Beraldo AA, França UM, Protti ST, et al. Atraso no diagnóstico da tuberculose em sistema prisional: a experiência
do doente apenado. Texto Contexto - Enferm 2012; 21: 17-25.
19. Bawankule S, Quazi SZ, Gaidhane A, Khatib N. Delay in DOTS for new pulmonary tuberculosis patient from rural area of Wardha District, India. Online J Health Allied Scs 2010; 9(1): 5.
20. Chang CT, Esterman A: Diagnostic delay among pulmonary tuberculosis patients in Sarawak, Malaysia: a cross-sectionalstudy. Rural Remote Health 2007; 7: 667.
21. Mesfin MM, Newell JN, Walley JD, Gessessew A, Madeley RJ. Delayed consultation among pulmonary tuberculosis patients: a cross sectional study of 10 DOTS districts of Ethiopia. BMC Public Health 2009; 9: 53.
22. Pehme L, Rahu K, Altraja A. Factors related to helath system delays in the diagnosis of pulmonary tuberculosis in Estonia. Int J Tuberc Lung Dis 2007; 7(3): 687-707.
23. Leung ECC, Leung CC, Tam CM. Delayed presentation and treatment of newly diagnosed pulmonary tuberculosis patients in Hong Kong. Hong Kong Med J 2007; 13: 221-7.
24. Gaviria MB, Henao HM, Martínez T, Bernal E. Papel del personal de salud en el diagnóstico tardío de la tuberculosis pulmonar en adultos de Medellín, Colombia. Rev Panam Salud Publica 2010; 27: 83-92. 25. Oliveira LH, Mattos RA, Souza AIS. Cidadãos
peregrinos: os “usuários” do SUS e os signiicados de sua demanda a prontos-socorros e hospitais no contexto de um processo de reorientação do modelo assistencial. Ciênc Saúde Colet 2009; 14: 1929-38. 26. Zerbini E, Chirico MC, Salvadores B, Amigot B,
Estrada S, Algorry G. Delay in tuberculosis diagnosis and treatment in four provinces of Argentina. Int J Tuberc Lung Dis 2008; 12: 63-8.
27. Bianco SR, Gurgel RL, Tavares MA. Aspectos radiológicos da tuberculose primária da mama: relato de caso e revisão de literatura. Rev Soc Bras Med Trop 2009; 42: 203-5.
28. Bento J, Silva AS, Rodrigues F, Duarte R. Métodos diagnósticos em tuberculose. Acta Med Port 2011; 24: 145-54.
29. Odusanya OO, Babafemi JO. Patterns of delays amongst pulmonary tuberculosis patients in Lagos, Nigeria. BMC Public Health 2004; 4: 18.
30. Antunes JLF, Waldman EA. The impact of AIDS, immigration and housing overcrowding on tuberculosis deaths in São Paulo, Brazil, 1994-1998. Soc Sci Med 2001; 52: 1071-80.
32. Câmara G, Monteiro AM, Druck S, Carvalho MS. Análise Espacial e Geoprocessamento. In: Druck S, Carvalho MS, Câmara G, Monteiro AMV. Análise espacial de dados geográicos. Planaltina: Embrapa; 2004. p. 21-52. 33. Hino P, Santos CB dos, Villa TCS. Evolução espaço-temporal dos casos de tuberculose em Ribeirão Preto (SP), nos anos de 1998 a 2002. J Bras Pneumol 2005; 31: 523-7. 34. Bailey TC, Gatrell AC. Interactive Spatial Data Analysis.
Harlow: Prentice Hall; 1995.
35. Bivand RS, Pebesma EJ, Gómez-Rubio V. Applied Spatial Data Analysis with R. Lexington: Springer; 2008. 36. Ng IC, Wen TH, Wang JY, Fang CT. Spatial dependency
of tuberculosis incidence in Taiwan. PLoS ONE 2012; 7: e50740.
37. Liu Y, Jiang S, Liu Y, Wang R, Li X, Yuan Z, et al. Spatial epidemiology and spatial ecology study of worldwide drug-resistant tuberculosis. Int J Health Geogr 2011; 10: 50. 38. Hawker JI, Bakhshi SS, Ali S, Farrington CP. Ecological
analysis of ethnic differences in relation between tuberculosis and poverty. BMJ 1999; 319: 1031-4. 39. Parslow R, El-Shimy N A, Cundall DB, McKinney PA.
Tuberculosis, deprivation, and ethnicity in Leeds, UK, 1982–1997. Arch Dis Child 2001; 84: 109-13. 40. Baker M, Das D, Venugopal K, Howden-Chapman P.
Tuberculosis associated with household crowding in a developed country. Epidemiol Community Health2008; 62: 715-21.
41. Quijano ED de, Brugal MT, Pasarín MI, Galdós-Tangüís H, Caylà J, Borrell C. Inluencia de las desigualdades sociales, la conlictividad Social y la pobreza extrema sobre la morbilidad por Tuberculosis en la ciudad de Barcelona. Rev Esp Salud Pública 2001; 75: 517-27. 42. Culqui D, Zavaleta C, Romero J, Bonilla C, Trujillo
O, Cueva N. Tuberculosis en poblaciones indígenas del Perú: Los Aimaras del Perú, 2000-2005. Rev Peru Epidemiol 2009; 13: 1-6.
43. Kistemann T, Munzinger A, Dangendorf F. Spatial patterns of tuberculosis incidence in Cologne (Germany). Soc Sci Med 2002; 55: 7-19.
44. Ponticiello A, Sturkenboom MCJM, Simonetti A, Ortolani R, Malerba M, Sanduzzi A. Deprivation, immigration and tuberculosis incidence in Naples, 1996 –2000. Eur J Epidemiol 2005; 20: 729-34. 45. Myers WP, Westenhouse JL, Flood J, Riley LW. An
ecological study of tuberculosis transmission in California. Am J Public Health 2006; 96: 685-90. 46. Manfré LA, Lourenço RW, Donalisio MR. Distribuição
espacial da tuberculose no município de Sorocaba, São Paulo, Brasil, 2000 – 2007. Rev Caminhos Geogr 2010; 11: 29-43.
Received on: 12/18/2014