ABSTRACT
Comparison between two tomographic sections
in the diagnosis of external root resorption
Cláudio Afonso LERMEN1, Gabriela Salatino LIEDKE2, Heloísa Emília Dias da SILVEIRA3, Heraldo Luis Dias da SILVEIRA4, Alessandro André MAZZOLA5, José Antônio Poli de FIGUEIREDO6
1-BDS, MSc Postgraduate student, Department of Surgery and Orthopedics, School of Dentistry, Federal University of Rio Grande do Sul, Porto Alegre, RS, Brazil. 2-BDS, Postgraduate student, Department of Surgery and Orthopedics, School of Dentistry, Federal University of Rio Grande do Sul, Porto Alegre, RS, Brazil. 3-BDS, PhD, Associate Senior Lecturer, Department of Surgery and Orthopedics, School of Dentistry, Federal of University of Rio Grande do Sul, Porto Alegre, RS, Brazil.
4-BDS, PhD, Lecturer, Department of Surgery and Orthopedics, School of Dentistry, Federal of University of Rio Grande do Sul, Porto Alegre, RS, Brazil. 5-MSc, Physicist and Coordinator of the Imaging Center of ‘Moinhos de Vento’ Hospital, Porto Alegre, RS, Brazil.
6- !"#$%"&#$'(!#$")*+,-$.)&/0-)-$,1$2*3,3,*/,4,56$7*3$!)7*$,1$/()$',8/5-7307/)$'-,5-79$+*$!)*/+8/-6#$',*/+:&74$;7/(,4+&$<*+=)-8+/6$,1$>+,$?-7*3)$3,$
Sul, Porto Alegre, RS, Brazil.
Corresponding address: José Antonio Poli de Figueiredo - Coordenador Programa de Pós-Graduação em Odontologia - Pontifícia Universidade Católica do Rio Grande do Sul - PUCRS - Av. Ipiranga, 6681 - Prédio 6 - sala 206 - 90619-900 - Porto Alegre - RS - Brasil - Phone: +55-51-3320-3500 - Ramal: 4307
!"!#$!%&'()$!*+!,'-.'/001'2'3)%#4"56#)7&'89:9;6'<<.'/001'2'8""!=6!%&'>"6)+!,'1.'/00?
O
bjectives: To assess the accuracy of coronal and sagittal CT sections to detect cavities simulating root resorption. Material and Methods: 60 mandibular incisors were embedded in plaster bases, and cavities with 0.6, 1.2 or 1.8 mm in diameter and 0.3, 0.6 or 0.9 mm in depth (small, medium and large cavities) were drilled on the buccal surfaces with high-speed round burs with diameters of 0.6, 1.2 and 1.8 mm to simulate external!"#$$#%&'()'&&%)'*+&',% &!-). $/0#% &!+) !)%1*)2*'3 2#04)$ 550*)#!5)#, 2#0)%1 '5+)&6)*#21)
tooth root were made randomly. The Dental Scan software was used to obtain 1-mm-thick axial images from direct scanning, which were reconstructed in the coronal and sagittal planes using 3D software (Syngo FastView). Each series was loaded into the software. Fourteen images of each tooth were reconstructed in the coronal plane and 14 in the sagittal plane. A total of 1,652 images were obtained for analysis. Series information, tooth number and the plane reconstructed were stored. The images generated were saved on a CD-ROM together with the visualization software (Syngo FastView). Images were analyzed by a previously calibrated blinded, radiologist. Cochran’s Q test was conducted separately
6&')*#21)'*7 &!)#!#0(8*5)6&00&9*5):(),# ';9 +*)2&$,#' +&!):()%1*)<2=*$#')%*+%)>,?@-@AB-) C*+/0%+D)=&)+%#% +% 2#00()+ 7! E2#!%)5 66*'*!2*)>,F@-@AB)9#+)&:+*'3*5) !)%1*)5 #7!&+ +)&6)
simulated resorption between the apical, middle, and coronal thirds. When the axial plane was assessed separately, diagnoses were statistically different (p<0.05) among the three
'&&%)%1 '5+-)G1*)#, 2#0)%1 '5)5 66*'*5)+ 7! E2#!%0()>,H@-@AB)6'&$)%1*)2*'3 2#0)#!5)$ 550*)
thirds. Diagnostic errors were more often observed in the apical third compared to the
2*'3 2#0)#!5)$ 550*)%1 '5+-)< 5;+ 8*5)2#3 % *+)'*3*#0*5)!&)+%#% +% 2#00()+ 7! E2#!%)5 66*'*!2*+)
(p>0.05) between planes, irrespective of the third in which the resorptions were located. Conclusion: When tomographic sections are requested for the diagnosis of buccal or lingual external root resorption, sagittal sections afford the best image characterization of the resorption process.
INTRODUCTION
Radiographs obtained at different angles may be useful to determine which surface is affected by external root resorption, but they do not provide a representation of the three dimensions of real resorption defects2,7. Their actual location also interferes in the radiographic visualization: resorption areas on the buccal or lingual surfaces are more
5 6E2/0%4) 6) !&%) $,&++ :0*4) %&) 3 +/#0 8*-) I*%4) %1 +) +)
the opposite of what radiographic inspection affords regarding the mesial and distal surfaces13.
Computed tomography (CT) has been used to obtain a better visualization of invasive root resorption, and is a useful resource to provide an accurate diagnosis of the extension and location of the resorption8. Although it is not always necessary, CT can be very helpful in some cases to overcome the difficulties of conventional radiography is distinguishing the lesion from normal anatomic structures. This is advantageous to both patients and clinicians for addressing the treatment strategy more comprehensively.
CT affords obtaining images without overlapping of structures. In a previous study investigating CT diagnostic ability to evaluate simulated resorption lesions134) %)9#+)5 6E2/0%)%&) 5*!% 6()+$#00)2#3 % *+) !) the apical third. We hypothesize that sagittal planes could enhance the visualization ability of CT. The present study aimed to assess the accuracy of coronal and sagittal CT sections to detect cavities simulating root resorption.
MATERIAL AND METHODS
Sixty human mandibular incisors were selected from the Tooth Bank of the Department of Endodontics of the School of Dentistry of the Federal University of Rio Grande do Sul, Brazil after approval by the local Research Ethics Committee and randomly numbered from 1 to 60. The teeth were not sectioned, but their root segments were divided into thirds - cervical, middle and apical - totalizing 180 root thirds. For each third (cervical, middle and apical) there were 4 simulation possibilities: small, medium or large cavity, or no cavity. Thus, there were 12 possible "third x cavity size" combinations, and 15 teeth were
randomly assigned to each combination.
To simulate external root resorption, the teeth were placed in plaster bases, and cavities of 0.6, 1.2 or 1.8 mm in diameter and 0.3, 0.6 or 0.9 mm in depth (small, medium and large cavities) were drilled according to a protocol reported in the literature1,4,5,6. The cavities were drilled on the buccal surfaces with high-speed round burs with diameters of 0.6, 1.2 and 1.8 mm (KG, Sorensen, São Paulo, SP, Brazil), which were adapted to a device that ensured standardization of cavity diameter and depth. Simulations in the cervical, middle and apical thirds of each root were made randomly.
One tooth fractured and was discarded. The 59 remaining teeth, divided into 2 groups of 20 specimens each and one group of 19 specimens,
9*'*)EJ*5) !)K;2$;%1 2L)9#J),0#%*+)#!5),0#2*5)&3*')#)
cylindrical plastic container with water. This assembly was then placed on the Single-Slice TS (Somaton Emotion Duo, Siemens, Erlangen, Germany) scan table. The use of wax and water was tested in a pilot-study to simulate tissues with water and fat density, and thus avoid differences in density between air and teeth and reduce artifacts in the image. The Dental Scan software was used to obtain 1-mm-thick axial images, obtained from direct scanning, at 1.5 x 0.5 mm reconstruction intervals along the whole tooth extension, according to the basic software protocol 120 kVp, 80 mA, 1 s rotation time. The axial sections of the sets of teeth were reconstructed in the coronal and sagittal planes using the 3D software (Syngo FastView, Siemens Medical, Germany). Each series was loaded into the software. The volume of interest
5*E! % &!) %&&0) >MNO) P0 ,) Q&JB) 9#+) /+*5) %&) +&0#%*)
each tooth, so as to allow positioning of sagittal and coronal sections. Reconstructions were made at section thickness of 1.0 mm and section intervals of 0.5 mm. Roughly, 14 images of each tooth were reconstructed in the coronal plane and 14 in the sagittal plane. A total of 1,652 images were obtained for analysis. Series information, tooth number and the plane reconstructed were stored. The images generated were saved on CD-ROM together with the visualization software (Syngo FastView).
Images were analyzed by a previously calibrated, blinded radiologist. In order to verify statistically
+ 7! E2#!%) 5 66*'*!2*+) #$&!7) %1*) '*+/0%+) 6&') %1*)
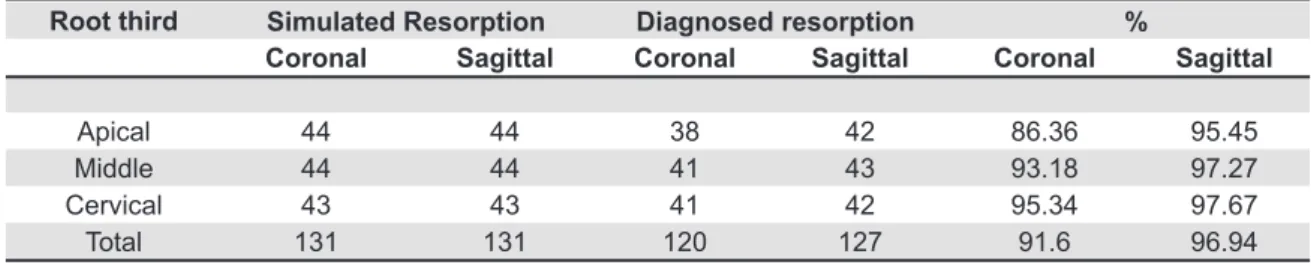
Root third
Coronal Sagittal Coronal Sagittal Coronal Sagittal
Apical 44 44 38 42 86.36 95.45
Middle 44 44 41 43 93.18 97.27
Cervical 43 43 41 42 95.34 97.67
Total 131 131 120 127 91.6 96.94
Simulated Resorption Diagnosed resorption %
cervical, middle, and apical thirds in the resorption diagnosis, the Cochran’s Q test was used followed by the McNemar test for pair-wise comparisons. In the same way, the three cavity sizes were analyzed independently for the cervical, middle and apical thirds, and for the three planes (axial, coronal and
+#7 %%#0B-) O!) #00) 2#+*+4) #) AR) + 7! E2#!2*) 0*3*0) 9#+)
adopted to demonstrate a likely enhancement in the
diagnostic capacity of coronal and sagittal sections by the 3D software, as compared to axial sections.
RESULTS
The total number of simulated resorptions, number of simulated resorptions diagnosed by CT, and the respective percent values in coronal and Rooth Third Size
Coronal Sagittal Coronal Sagittal Coronal Sagittal
Small 14 14 8 8 57.14 86.71
Apical Medium 15 15 15 15 100 100
Large 15 15 15 15 100 100
Total 44 44 42 42 86.36 95.45
Small 14 14 14 14 85.71 100
Middle Medium 15 15 14 14 93.33 93.33
Large 15 15 15 15 100 100
Total 44 44 43 43 93.18 97.72
Small 14 14 13 13 92.85 92.85
Cervical Medium 15 15 14 14 93.33 93.33
Large 14 14 14 14 100 100
Total 43 43 41 41 95.34 95.34
Simulated resorptions Diagnosed resorptions %
Table 2- Comparison between simulated and diagnosed resorptions in the apical, middle and cervical thirds, and respective resorption sizes, in coronal and sagittal sections
sagittal sections are shown in Table 1, similarly to the representation for axial sections5.
Simulated and diagnosed resorptions for coronal and sagittal sections (Table 2) were expressed in more detail, considering not only the location (apical, middle and cervical thirds), but also the size of simulated resorptions (small, midium, and large) for each third individually. Small resorptions in the apical third were diagnosed in 57.14% of the cases in the coronal sections, and in 85.71% of the cases in the sagittal sections.
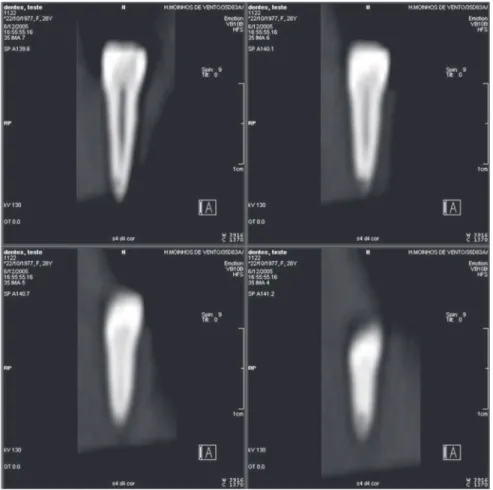
In the coronal sections (Figure 1), 120 of the 131 simulated resorptions were successfully observed, which represents a total of 91.60% correct diagnoses. The lowest percentage of correct diagnoses (86.36%) was observed in the apical third (Table 1). Similarly, in the sagittal sections (Figure 2), 127 of the
KSK) + $/0#%*5) '*+&',% &!+) 9*'*) 5*!% E*54) 91 21)
represents a total of 96.94% correct diagnoses. Again, the lowest percentage of correct diagnoses (95.45%) was observed in the apical third (Table 1). The increase in cavity size led to an enhanced diagnostic capacity of CT. In general, the cavities in
%1*)#, 2#0)%1 '5)9*'*)%1*)$&+%)5 6E2/0%)%&)5 #7!&+*-)
Based on the results of the Cochran’s Q test for
2&'&!#0)#!5)+#7 %%#0),0#!*+4)!&)+%#% +% 2#00()+ 7! E2#!%)
difference (p>0.05) was observed in the diagnosis of simulated resorption cavities among the apical, middle, and coronal thirds. Yet, when the axial plane
was assessed separately, diagnoses were statistically different (p<0.05) among the three thirds of the root. Based on the results of the McNemar test, the apical
%1 '5)5 66*'*5)+ 7! E2#!%0()>,H@-@AB)6'&$)%1*)2*'3 2#0)
and middle thirds. Diagnostic errors were more often observed (p<0.05) in the apical third, compared to the cervical and middle thirds.
The Cochran’s Q test for the mid-sized cavities revealed no statistically significant differences (p>0.05) among the planes, irrespective of the third in which resorption was located. As no diagnostic errors were observed for large cavities, the Cochran’s
T)%*+%)9#+)!&%)!*2*++#'(-)=&)+%#% +% 2#00()+ 7! E2#!%)
difference (p>0.05) was observed for small cavities between the cervical and middle thirds. Nevertheless, the apical third showed a significant difference (p<0.05) between axial and sagittal planes, with the former having a higher occurrence of misdiagnoses.
DISCUSSION
'#5 &7'#,1+-) G1*) 1 71) +,*2 E2 %() &6) PG) >K@@RB4)
though, was proved by the absence of false-positive results. Conversely, conventional radiograph has been shown to produce false-negative results in 15.3% of the cases examined in another study investigating the diagnosis of external root resorption using tuned-aperture computed tomography9. However, major
5 6E2/0% *+) #'*) 6&/!5) 91*!) /+ !7) #J #0) +*2% &!+) %&)
detect small cavities located on the apical root third13. By using the other planes (coronal and sagittal) for diagnostic imaging and then comparing the results with previous data13, the present study observed that
%1*)E!5 !7+)#'*)U/ %*)+ $ 0#') !)%*'$+)&6)5 #7!&+% 2)
capacity of mid-sized and large cavities simulating resorptions. The percentage of closely comparable results was high, independently of the root third and the plane examined. Nevertheless, the largest differences are observed as far as small simulated resorptions in the apical plane are considered. Silveira, et al.13 found that only 28.57% of these resorptions were seen in axial sections, while 57.14% were observed in coronal sections, and 85.71% in
+#7 %%#0)+*2% &!+4)9 %1)+ 7! E2#!%)5 66*'*!2*+):*%9**!)
the axial and sagittal planes.
The present results also showed a rapid increase in the characterization of resorptions for the apical third, which is a region that typically imposes the
7'*#%*+%) 5 6E2/0% *+) %&) %1*) 5 #7!&+ +) &6) '*+&',% &!+)
due to the peculiar features as narrowing of the root and reduced area. The axial plane was the
0*#+%) ,'*2 +*) !) #66&'5 !7) '*+&',% &!) 5*!% E2#% &!4)
followed by the coronal and the sagittal planes. As demonstrate elsewhere11, clinicians must know the best protocol to resort for an accurate diagnosis when requesting CT scans.
The increased diagnostic capacity in the sagittal plane may be explained by the broader and more
+,*2 E2)#+,*2%+)#66&'5*5-)G1*)+#7 %%#0),0#!*)'*3*#0+)
several important landmarks and features of the dental structures, such as the cementoenamel junction and root morphology, which helps locating cavities across the root thirds, especially small ones, and facilitates the diagnostic process.
The introduction of cone beam computed tomography (CBCT) for maxillofacial region provided the same characteristics of interaction with data already observed in CT14, but with lower radiation doses, as compared to MSCT12. This new technique has proved its value for endodontic diagnosis9. Thus, in agreement with other authors7, CT technique should be adopted with care and when strictly needed, that is, in cases of small resorption cavities, especially those located on the buccal or lingual root surfaces, which conventional radiographs are
!&%)+/ %#:0()*6E2 *!%)%&)5*%*2%)#!5) 6)#)PQPG)5*3 2*)
is not available. Additionally, exposure to radiation may be minimized by reducing milliamperage and rotation time, and by using a pitch factor 211.
CONCLUSION
When tomographic sections are requested for the diagnosis of buccal or lingual external root resorption, sagittal sections afford the best image characterization of the resorption process.
REFERENCES
1- Andreasen FM, Sewerin I, Mandel U, Andreasen JO. Radiographic assessment of simulated root resorption cavities. Endod Dent Traumatol. 1987;3(1):21-7.
2- Bergmans L, Van Cleynenbreugel J, Verbeken E, Wevers M, Van Meerbeek B, Lambrechts P. Cervical external root resorption in vital teeth. J Clin Periodontol. 2002;29(6):580-5.
3- Borg E, Kallqvist A, Grondahl K, Grondahl HG. Film and digital radiography for detection of simulated root resorption cavities. Oral Surg Oral Med Oral Pathol Oral Radiol Endod. 1998;86(1):110-4. 4- Chapnick L. External root resorption: an experimental radiographic evaluation. Oral Surg Oral Med Oral Pathol. 1989;67(5):578-82. 5- Goldberg F, Silvio A, Dreyer C. Radiographic assessment of simulated external root resorption cavities in maxillary incisors. Endod Dent Traumatol. 1998;14(3):133-6.
6- Hintze H, Wenzel A, Andreasen FM, Swerin I. Digital subtraction radiography for assessment of simulated root resorption cavities. Performance of conventional and reverse contrast modes. Endod Dent Traumatol. 1992;8(4):149-54.
7- Kim E, Kim KD, Roh BD, Cho YS, Lee SJ. Computed tomography as a diagnostic aid for extracanal invasive resorption. J Endod. 2003;29(7):463-5.
8- Liedke GS, Silveira HE, Silveira HL, Dutra V, Figueiredo JA. O!"/*!2*) &6) 3&J*0) + 8*) !) %1*) 5 #7!&+% 2) #: 0 %() &6) 2&!*) :*#$) tomography to evaluate simulated external root resorption. J Endod. 2009;35(2):233-5.
9- Nance RS, Tyndall D, Levin LG, Trope M. Diagnosis of external root resorption using TACT (tuned-aperture computed tomography). Endod Dent Traumatol. 2000;16(1):24-8.
10- Perrella A, Borsatti MA, Tortamano IP, Rocha RG, Cavalcanti MG. Validation of computed tomography protocols for simulated mandibular lesions: a comparison study. Braz Oral Res. 2007;21(2):165-9.
11- Rustemeyer P, Streubuhr U, Hohn HP, Rustemeyer R, Eich HT, John-Mikolajewski V, et al. Low-dosage dental CT [article in german]. Rofo. 1999;171(2):130-5.
12- Schulze D, Heiland M, Thurmann H, Adam G. Radiation exposure during midfacial imaging using 4- and 16-slice computed tomography, cone beam computed tomography systems and conventional radiography. Dentomaxillofac Radiol. 2004;33(2):83-6. 13- Silveira HL, Silveira HE, Liedke GS, Lermen CA, Santos RB, Figueiredo JA. Diagnostic ability of computed tomography to evaluate external root resorption in vitro. Dentomaxillofac Radiol. 2007;36(7):393-6.
14- Swennen GR, Schutyser F. Three-dimensional cephalometry: spiral multi-slice vs cone-beam computed tomography. Am J Orthod Dentofacial Orthop. 2006;130(3):410-6.