Effectiveness of breast cancer screening
policies in countries with medium-low
incidence rates
Qingxia KongI, Susana MondscheinII, Ana PereiraIII
I Universidad Adolfo Ibáñez. Escuela de Negocios. Santiago, Chile II Universidad Adolfo Ibáñez. Escuela de Ingeniería. Santiago, Chile
III Universidad de Chile. Instituto de Nutrición y Tecnología de los Alimentos. Santiago, Chile
ABSTRACT
Chile has lower breast cancer incidence rates compared to those in developed countries. Our public health system aims to perform 10 biennial screening mammograms in the age group of 50 to 69 years by 2020. Using a dynamic programming model, we have found the optimal ages to perform 10 screening mammograms that lead to the lowest lifetime death rate and we have evaluated a set of ixed inter-screening interval policies. he optimal ages for the 10 mammograms are 43, 47, 51, 54, 57, 61, 65, 68, 72, and 76 years, and the most efective ixed inter-screening is every four years after the 40 years. Both policies respectively reduce lifetime death rate in 6.4% and 5.7% and the cost of saving one life in 17% and 9.3% compared to the 2020 Chilean policy. Our indings show that two-year inter-screening interval policies are less efective in countries with lower breast cancer incidence; thus we recommend screening policies with a wider age range and larger inter-screening intervals for Chile.
DESCRIPTORS: Breast Neoplasms, epidemiology. Early Detection of Cancer. Mammography. Mass Screening. Preventive Health Services. Health Policy.
Correspondence:
Ana Pereira
Instituto de Nutrición y Tecnología de los Alimentos
Universidad de Chile Avda El Libano 5524, Macul Santiago, Chile
E-mail: [email protected]
Received: Dec 2, 2016
Approved: Mar 15, 2017
How to cite: Kong Q, Mondschein S, Pereira A. Effectiveness of breast cancer screening policies in countries with medium-low incidence rates. Rev Saude Publica. 2018;52:7.
Copyright: This is an open-access article distributed under the terms of the Creative Commons Attribution License, which permits unrestricted use, distribution, and reproduction in any medium, provided that the original author and source are credited.
INTRODUCTION
Breast cancer (BC) is the most common female cancer worldwide1. Chile is no exception; new
cases of BC have increased steeply, from 19.9 per 100,000 women in 1960 to 34.8 in 2012. In 2009, BC became the irst cause of cancer death among women in Chile, with age-adjusted mortality rate of 11.5 per 100,000 women in 20121,2.
Many countries have implemented mammography screening programs, with the aim of reducing the BC mortality rate3. Randomized controlled trials have shown an overall reduction
in mortality in the range of 15% to 30%4,5. Nonetheless, the cost efectiveness of such eforts –
which is particularly salient in settings with limited resources – has been intensely debated6.
In Chile, the current policy allocates only two screening mammograms (Mx) to healthy women between the ages of 50 to 547. Because BC is the irst cause of female cancer death
and its incidence rate has increased in the last decades, the Chilean Ministry of Health plans to provide access to screening Mx every other year for women between the ages of 50 to 69 by 20208 (namely, the 2020 Chilean policy) with a total number of 10 screening Mx.
Although the biennial screening program is recommended in most developed countries, such as Belgium, Spain, and the United States (Preventive Services Task Force), there is still discrepancy regarding these guidelines in developed countries9,10. Because of these conlicting
views, it remains obscure whether a biennial policy is desirable for Chile or other countries in a low-resource setting, with a relatively low incidence rate (one third of that in Belgium) and the diferent medical cost structure compared to those in developed countries1,11.
We applied a dynamic programming model to evaluate different screening policies using Chilean data such as BC incidence, survival rates, and costs. We aim to ind ixed inter-screening interval policies that excel in death rate reduction and cost-efectiveness using 10 Mx and compare them against the 2020 Chilean policy proposed by the government.
METHODS
Mathematical Model
We applied a dynamic programming model developed by Kong and Mondschein12 to calculate
the optimal ages to perform a ixed number of screening Mx in order to minimize the lifetime death rate from BC (software MATLAB R2015a published by MathWorks).he model decides whether or not to perform a screening mammogram every year during a woman’s lifetime. he decision balances the immediate beneit of detecting a tumor at an earlier stage (thereby increasing the chances of survival) and the beneit of waiting until the woman is older, when the probability of developing a tumor might be higher. hese decisions depend on incidence, false negative rates, and natural progression of the tumor, as a function of age, sensitivity of clinical breast examination, and survival rates at diferent stages of the tumor. Given an optimal allocation of screening mammograms, the model computes the corresponding expected costs (including the cost of the screening mammograms, direct cost of diagnosis, treatment, follow-up, and false positives), which enables us to perform a cost-efectiveness analysis. he model also ofers the lexibility to evaluate the expected lifetime cost and lifetime death rate for any speciic screening policy deined by the decision maker.
Description of Feasible Screening Policies
We denoted by lowest death rate policy (P:LDR) the optimal policy obtained when solving the dynamic programming model, which guarantees to ind the screening policy with the lowest death rate. We remark that this policy does not necessarily lead to a constant inter-screening interval.
We calculated the expected lifetime cost and death rate per 100,000 women for all feasible policies considered in this study. We then built the eicient frontier, which consists of all ixed inter-screening interval policies such that no other policy leads to a lower cost and lower death rate.
Data Input and Assumptions for the Dynamic Programming Model
BC incidence rate: as Chile does not have a National Cancer Registry, we collected the age-speciic incidence rate for BC from GLOBOCAN 20121. he GLOBOCAN estimations are
based on the national database for mortality and three regional registries (Valdivia, Biobio, and Antofagasta) for age-speciic incidence rates for the period 2003–2007.
Distribution of BC Stages: according to Prieto13, ductal carcinoma in situ (DCIS) accounts
for 8.6% of the non-invasive BC, being the most frequent in Chile; stages I to IV account for 18.7%, 42.1%, 23.3%, and 5.3% of the invasive BC, respectively. For ease of estimation of BC progression rate, we combined BC into two stages: early stage, which includes DCIS and BC stages I and II, and advanced stage, which includes BC stages III and IV. Based on estimations of BC natural history and progression by Maillart et al.14, we calculated that if
a healthy woman develops cancer within a year, the likelihood of the tumor being in early and advanced stage would be 94%, and 6%, respectively.
BC survival rates by stage: data was based on survival rates (as of 2009) reported by Serra et al.15,
which were estimated using 1,485 cases of BC (18–99 years) from a public hospital in Santiago, Chile, during the period 1994–2005. he estimated 10-year survival rate was 85.6% for early-stage BC and 57.7% for advanced-stage BC.
False positive and negative results: the estimation was based on data published by Maillart et al.14, in which the authors have reported a percentage of false positive results in the range
of 4.4%–7.8% and a percentage of false negative results in the range of 15%–25% for early stages and 7%–18% for advanced stages.
Sensitivity of clinical breast examination: the data was retrieved from previously published articles16–18 in which the sensitivity of clinical breast examination has been estimated to be
11% for early stages and 68% for advanced stages.
BC and overall mortality rate: the data was extracted from the Chilean National Death Certiicate database, which contains birth and death dates and the speciic cause of death for every Chilean citizen. he database is highly reliable, with 100% coverage19 and more
than 99% of death certiicates having been completed by a health professional20.
Costs: we used the direct cost of screening, diagnosis, and treatment reported in 2013 by the Fondo Nacional de Salud21 (FONASA), which is responsible for managing the publicly funded
Chilean health system. he cost of a screening Mx reimbursed by FONASA was US$28, and the cost associated to a false positive was US$474. Similar to Schousboe11, we estimated the
cost of treatment for three categories: irst-year costs, follow-up costs from the second year onward, and last-year-of-life costs.
Progress Rate Estimation
at younger ages (25–49 years = 40% within one year), slows down for middle-aged women (50–59 years = 22%), and decreases further for older women (> 60 years = 15%).
Model Validation
he dynamic programming model and the input parameter were validated using Chilean data on mortality, and we estimated the BC mortality rate from the cohort of women born in 1935–1939 using national statistics22. hese women were aged between 60 and 64 years
in 2000, and therefore had not participated in the national screening program. Women with more than 12 years of education were excluded, as in general they belonged to a high-income segment and could have undergone opportunistic screening. We then ran extensive simulations of a cohort of 10 million patients with our model, assuming that women had not received any screening Mx. he total age-speciic BC deaths were computed with a 95% conidence interval (95%CI) and compared to the actual age-speciic BC deaths that occurred in women born in 1935–1939. Figure 1 shows that the mortality of the cohort born in 1935–1939 is included within the 95%CI of the expected mortality rate.
Cost-effectiveness Analysis
We estimated the average cost of saving an extra life when increasing the number of Mx compared with zero Mx (baseline). he cost-efectiveness ratio (CER) was deined as the additional US dollars spent when doing 10 Mx over the number of lives saved compared to baseline. Additional cost is the diference between the costs of performing 10 Mx and zero Mx, and number of lives saved is the diference between the BC death rate when performing zero Mx and 10 Mx.
Number of lifes saved Death rate 0 Mx-Death rate 10 Mx Additional cost Total cost 10 Mx-Total cost 0 Mx CER = =
Sensitivity Analysis
We performed univariate sensitivity analyses to study the impact of inaccuracy in the estimation of parameters on the structure of the cost-efective screening policies. First, we increased the annual incidence rate in each age group by 10%. Second, because of the increasing trend in the BC incidence rate in Chile13, we increased the incidence rate by 1%
annually. Finally, we varied false positive and negative values within the range of ±10%. his research does not require Ethical Institutional Review Board review.
RESULTS
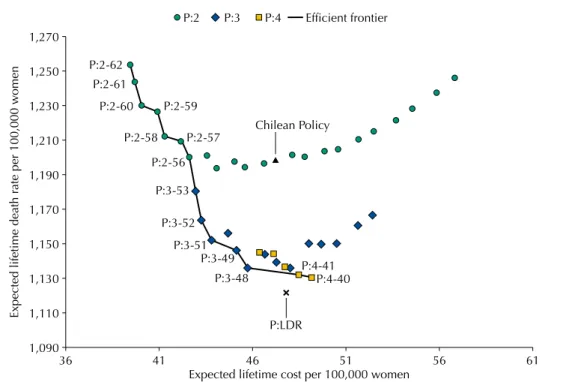
Figure 2 shows the expected lifetime cost and death rate per 100,000 women for different feasible screening policies and the efficient frontier represented by the solid line. The lowest death rate policy P:LDR, obtained by using the dynamic programming model, allocates the 10 Mx at the ages of 43, 47, 51, 54, 57, 61, 65, 68, 72, and 76 and it results on an average of 1,122 deaths per 100,000 women and a CER of US$50,800 per life saved. Among the policies with a fixed inter-screening interval, the two-year inter-screening interval policies are less effective in reducing BC deaths, compared to the three or four-year inter-screening interval policies. In particular, the 2020 Chilean policy has an average lifetime death rate of 1,199 per 100,000 women and a CER of US$61,100.
higher lifetime death rate (1,136 per 100,000 women) but a considerable lower CER ($47,400), which correspond to a reduction of 5.2% in death rate and 22.5% in CER compared to the 2020 Chilean policy.
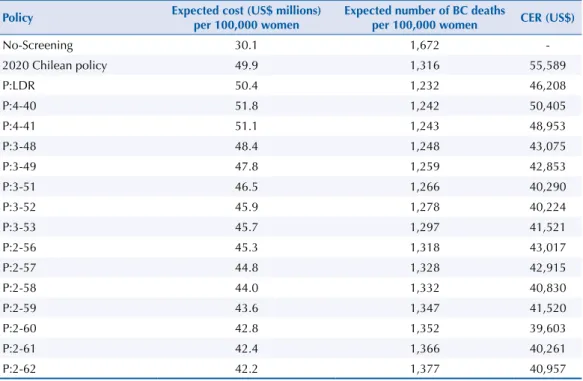
Table 2 shows the eicient frontier assuming a 10% increase in incidence rate. he eicient frontier is similar to the one obtained in the previous analysis; in particular, P:4-40 still leads to the lowest death rate and, although P:3-48 has a slightly higher death rate, still leads to a lower CER compared to P:4-40. Similar results are observed when considering 1% annual increase in the incidence rate and ±10% variation in the false positive and negative values (data not shown).
Figure 2. Expected lifetime costs and lifetime death rate per 100,000 women for a set of policies with 10 mammograms and the efficient frontier.
36 1,150 1,190
1,170
1,130
1,110
1,090 1,210 1,230
Expected lifetime death r
ate per 100,000 w
omen
1,250 1,270
P:2 P:3 P:4 Efficient frontier
P:2-62 P:2-61
P:2-60
P:2-58
P:2-56
P:3-53
P:3-52
P:3-51 P:3-49
P:3-48 P:4-40
P:4-41
P:LDR
P:2-57 Chilean Policy
P:2-59
41 46
Expected lifetime cost per 100,000 women
51 56 61
Figure 1. Number of total breast cancer (BC) deaths in 5-year age groups in Chilean women born in 1935–1939 (solid line) and simulation results assuming a population without screening mammography (dashed line).
50–54 80 100 120
Number of BC death (per 100,000 w
omen)
140 160
55–59 60–64
Age group
Chilean cohort (1935–1939)
65–69 70–74
DISCUSSION
Our results show that the maximum reduction of BC death rate is obtained with the lowest death rate policy (P:LDR), which recommends Mx at ages 43, 47, 51, 54, 57, 61, 65, 68, 72, and 76. However, P:LDR does not have a ixed inter-screening interval, and therefore, it might be diicult to implement it in practice. Among the ixed inter-screening interval policies, P:4-40 leads to the lowest death rate, slightly higher than that in P:LDR (less than 1%). In Table 1. Expected lifetime costs and number of BC deaths per 100,000 women and cost-effectiveness ratio (CER) for 10 mammograms for the no-screening policy, the 2020 Chilean policy, the lowest death rate policy (P:LDR), and the fixed inter-screening interval policies in the efficient frontier.
Policy Expected cost (US$ millions) per 100,000 women
Expected number of BC deaths
per 100,000 women CER (US$)
No-screening 27.4 1,522
-2020 Chilean policy (P:2-50) 47.2 1,199 61,142
P:LDR 47.8 1,122 50,847
P:4-40 49.1 1,131 55,472
P:4-41 48.4 1,132 53,869
P:3-48 45.7 1,136 47,355
P:3-49 45.1 1,146 47,080
P:3-51 43.8 1,152 44,191
P:3-52 43.2 1,164 44,088
P:3-53 42.9 1,181 45,436
P:2-56 42.6 1,200 47,203
P:2-57 42.1 1,209 47,065
P:2-58 41.3 1,212 44,749
P:2-59 40.9 1,226 45,473
P:2-60 40.0 1,231 43,341
P:2-61 39.7 1,244 44,030
P:2-62 39.4 1,254 44,697
BC: breast cancer
Table 2. Sensitivity analysis of the expected lifetime costs and number of BC deaths per 100,000 women and cost-effectiveness ratio (CER) for 10 mammograms for the no-screening policy, the 2020 Chilean policy, the lowest death rate policy (P:LDR), and the fixed inter-screening interval policies in the efficient frontier when incidence rate increases by 10% in each age group.
Policy Expected cost (US$ millions) per 100,000 women
Expected number of BC deaths
per 100,000 women CER (US$)
No-Screening 30.1 1,672
-2020 Chilean policy 49.9 1,316 55,589
P:LDR 50.4 1,232 46,208
P:4-40 51.8 1,242 50,405
P:4-41 51.1 1,243 48,953
P:3-48 48.4 1,248 43,075
P:3-49 47.8 1,259 42,853
P:3-51 46.5 1,266 40,290
P:3-52 45.9 1,278 40,224
P:3-53 45.7 1,297 41,521
P:2-56 45.3 1,318 43,017
P:2-57 44.8 1,328 42,915
P:2-58 44.0 1,332 40,830
P:2-59 43.6 1,347 41,520
P:2-60 42.8 1,352 39,603
P:2-61 42.4 1,366 40,261
P:2-62 42.2 1,377 40,957
comparison, P:3-48 has a small increase in death rate (less than 0.5%) but considerable lower CER compared to P4:40. Both policies signiicantly outperform the 2020 Chilean policy, in terms of death rate and CER. herefore, decision makers should take these considerations into account when selecting a screening policy that best its the Chilean population.
Over the years, developed countries have adopted diferent screening policies, with variations on starting and ending ages and inter-screening intervals23. In the last years, these diferences
have sparked important controversies regarding the efectiveness and eiciency of such policies. For example, in the United States, the National Breast and Cervical Cancer Early Detection Program (NBCCEDP) suggests screening every two years in women aged between 50 and 74 years, providing approximately a total of 13 Mx during their lifetime24. his
recommendation is similar to some European countries such as France and the Netherlands. In contrast, the United Kingdom ofers screening mammograms every three years for women aged between 50 and 69 years, carrying out a total of only seven to eight Mx during a women’s lifetime25. A recent report commissioned by the Cancer Research UK and the Department of
Health of England has estimated that 681 cancer cases will be detected per 10,000 women invited to screening, preventing 43 deaths, but 129 cases will be overdiagnosis cases. he report concluded that, for the case of United Kingdom, it is worth the beneit of carrying out BC screening despite the harms and potential anxiety and sufering for women10. We noticed
that there is no agreement in the medical community about the efectiveness of screening in the age group of 40 to 49 years26. For example, while United Kingdom does not recommend
any Mx for women younger than 50, the American Cancer Society recommends annual mammograms for women aged from 45 to 54 years (and every two years after 55) and marks it as optional for women aged from 40 to 44 years27. he latter has been thoroughly discussed
by Oeinger et al., with a review of the controlled, observational, and modeling/simulation studies used to support the new recommendations9.
We suggest two alternative policies for the Chilean population: P:4-40 and P:3-48, the irst one because of its low death rate, and the second one because of its low CER ratio with only a slight increase in death rate. his result is novel because, to the best of our knowledge, none of the existing policies around the world suggest an inter-screening interval of four years and only few countries have adopted a three-year inter-screening interval (e.g. United Kingdom). Our experiments show that, even when the incidence rate increases homogenously among the diferent age groups, both policies remain desirable. his might result from the complex interaction among limited resources, diferent cost structure, and inherent patterns in BC incidence and progress rate.
Although the proposed policy P:4-40 and P:3-48 could, on average, have more interval cancers (those not detected during the screening program) compared to those in the 2020 Chilean policy, this increase is counteracted by the cancers detected during the age range that is not covered by the 2020 Chilean policy (40–50 and 68–76). herefore, a policy with a larger inter-screening interval may not necessarily lead to higher lifetime death rate.
A recent systematic review by Yoo28 reports that screening programs are cost-efective in
most Western, but not Asian, countries. his could be due to diferences in incidence rates and population breast-density distribution. his result agrees with studies suggesting that personalized screening programs based on age, history of BC, breast density, and other known risk factors are more eicient. Schousboe et al.11 recommend biannual screening Mx between
ages 50 to 79 for women with high-density breasts, and every three to four years for those with low density. Vilaprinyo et al.29 recommend diferent screening frequencies based on risk
Our study is not free of limitations. When Chilean data was not available, such as false positive/negative percentages, we used available international data. Furthermore, Chile does not have a National Cancer Registry, thus incidence rates were obtained from GLOBOCAN, whose estimations are based on Chilean survival and mortality rates. As shown in the results, the optimal policies do not change when false positive and negative values vary in a range of 10% and incidence rate is modiied by 10% in each age group or by 1% annually. In addition, the Chilean cost structure reported by the Ministry of Health is relatively low compared to those in developed countries11, and, in particular, the increment in treatment costs from early
to advanced stages of cancers is moderate. herefore, these data suggest that treatment of advanced-stage cancer is still cost-efective. On the other hand, a major strength of our study is the use of an optimization model rather than a simulation one. hus, we are not only able to evaluate the cost of any current policy, but we can also identify the optimal policy for a given number of screening Mx that minimizes the lifetime mortality rate.
In conclusion, our study indicates that the 2020 Chilean policy is not desirable either in terms of death rate or in terms of cost-efectiveness. hus, we recommend for Chile or countries with lower BC incidence rate a screening policy that has a wider age range and a larger inter-screening interval, compared to most policies implemented in developed countries. In the future, personalized screening could be an option for countries such as Chile that have limited resources and low incidence rate and, therefore, screening eforts could be focused on high-risk population.
REFERENCES
1. Ferlay J, Shin HR, Bray F, Forman D, Mathers C. GLOBOCAN 2012: cancer incidence and mortality worldwide. Lyon: IARC; 2012 [cited 2014 Apr 14]. Available from: http://globocan.iarc.fr
2. Parkin DM, Whelan SL, Ferlay J, Raymond L, Young J, editors. Cancer incidence in five continents. Volume 7. Lyon: IARC; 1997 (IARC Scientific Publications, 143).
3. Madlensky L, Goel V, Polzer J, Ashbury FD. Assessing the evidence for organised cancer screening programmes. Eur J Cancer.2003;39(12):1648-53. https://doi.org/10.1016/S0959-8049(03)00315-0
4. Nelson HD, Fu R, Griffin JC, Nygren P, Smith ME, Humphrey L. Systematic review: comparative effectiveness of medications to reduce risk for primary breast cancer. Ann Intern Med.
2009;151(10):703-15, W-226-35. https://doi.org/10.7326/0003-4819-151-10-200911170-00147
5. Hellquist BN, Duffy SW, Abdsaleh S, Björneld L, Bordás P, Tabár L, et al. Effectiveness of population-based service screening with mammography for women ages 40 to 49 years: evaluation of the Swedish Mammography Screening in Young Women (SCRY) cohort. Cancer. 2010;117(4):714-22. https://doi.org/10.1002/cncr.25650
6. Vilaprinyo E, Puig T, Rue M. Contribution of early detection and adjuvant treatments to breast cancer mortality reduction in Catalonia, Spain. PLoS One.2012;7(1):e30157. https://doi.org/10.1371/journal.pone.0030157
7. Ministerio de Salud (CL). Examen de Medicina Preventiva. Santiago; 2015 [cited 2015 May 5]. Available from: http://www.minsal.cl/examen-medicina-preventiva/
8. Ministerio de Salud (CL). Programa Elige Vivir Sano: metas 2011-2020: Estrategia Nacional de Salud: para el cumplimiento de los Objetivos Sanitarios de la Década 2011-2020. Santiago de Chile; 2011 [cited 2015 May 5]. Available from: http://www.minsal.cl/portal/url/item/c4034eddbc96ca6de0400101640159b8.pdf
9. Oeffinger KC, Fontham ET, Etzioni R, Herzig A, Michaelson JS, Shih YC, et al. Breast cancer screening for women at average risk: 2015 guideline update from the American Cancer Society.
JAMA.2015;314(15):1599-614. https://doi.org/10.1001/jama.2015.12783
10. Marmot MG, Altman DG, Cameron DA, Dewar JA, Thompson SG, Wilcox M. The benefits and harms of breast cancer screening: an independent review. Br J Cancer.2013;108(11):2205-40. https://doi.org/10.1038/bjc.2013.177
11. Schousboe JT, Kerlikowske K, Loh A, Cummings SR. Personalizing mammography by breast density and other risk factors for breast cancer: analysis of health benefits and cost-effectiveness. Ann
Intern Med.2011;155(1):10-20. https://doi.org/10.7326/0003-4819-155-1-201107050-00003
13. Prieto MM. Epidemiología del cáncer de mama en Chile. Rev Med Clin Condes.
2011;22(4):428-435. https://doi.org/10.1016/S0716-8640(11)70447-3
14. Maillart L, Simmons J, Fitts E, Ransom S, Diehl K. Assessing dynamic breast cancer screening policies. Oper Res.2008;56(6):1411-27. https://doi.org/10.1287/opre.1080.0614
15. Serra-C I, Martínez-R R, Mimica-S X, Cavada-CH G, Aguayo-S C. Cáncer de mama en Chile: un aporte clínico y epidemiológico según un registro poblacional metropolitano: 1.485 pacientes.
Rev Chil Cir. 2009;61(6):507-14. https://doi.org/10.4067/S0718-40262009000600003
16. Kolb TM, Lichy J, Newhouse JH. Comparison of the performance of screening mammography, physical examination, and breast US and evaluation of factors that influence them: an analysis of 27,825 patient evaluations. Radiology.2002;225(1):165-75. https://doi.org/10.1148/radiol.2251011667
17. Sankaranarayanan R, Ramadas K, Thara S, Muwonge R, Prabhakar J, Augustine P, et al. Clinical breast examination: preliminary results from a cluster randomized controlled trial in India. J Natl
Cancer Inst.2011;103(19):1476-80. https://doi.org/10.1093/jnci/djr304
18. National Institutes of Health (US), National Cancer Institute, Surveillance Epidemiology and End Results Program. SEER cancer satistics review 1975-2010. Bethesda: NCI; 2013 [cited 2015 May 5]. Available from: https://seer.cancer.gov/archive/csr/1975_2010
19. Mathers CD, Fat DM, Inoue M, Rao C, Lopez AD. Counting the dead and what they died from: an assessment of the global status of cause of death data. Bull World Health Organ. 2005;83(3):171-7. https://doi.org/10.1590/S0042-96862005000300009
20. Instituto Nacional de Estadística (CL). Anuario de estadísiticas vitales. Santiago de Chile: INE; 2003.
21. Ministerio de Salud (CL), Subsecretaría de Salud Pública. Aprueba garantías explícitas en salud del Régimen General de Garantías de Salud. Santiago; 2013 [cited 2015 May 5]. (Documento nº 4). Available from: http://web.minsal.cl/portal/url/item/d6924d33612dd5e6e040010164015e8f.pdf
22. Ministerio de Salud (CL), Departamento de Estadísticas e Información en Salud. Santiago; 2014 [cited 2014 Mar 28] Available from: http://www.deis.cl
23. Altobelli E, Lattanzi A. Breast cancer in European Union: an update of screening programmes as of March 2014 (review). Int J Oncol.2014;45(5):1785-92. https://doi.org/10.3892/ijo.2014.2632
24. Centers for Disease Control and Prevention. National Breast and Cervical Cancer Early Detection Program (NBCCEDP). Atlanta: CDC; 2016 [cited 2016 Mar 23]. Available from: http://www.cdc.gov/cancer/nbccedp/
25. Giordano L, Karsa L, Tomatis M, Majek O, Wolf C, Lancucki L, et al. Mammographic screening programmes in Europe: organization, coverage and participation. J Med Screen. 2012;19 Suppl 1:72-82. https://doi.org/10.1258/jms.2012.012085
26. Baker S, Wall M, Bloomfield A. What is the most appropriate breast-cancer screening interval for women aged 45 to 49 years in New Zealand? N Z Med J.2005 [cited 2017 Apr];118(1221):U1636. Available from: http://www.nzma.org.nz/journal/118-1221/1636/
27. American Cancer Society. ACS recommendations for early breast cancer detection in women without breast symptoms. Atlanta; 2015 [cited 2016 Apr]. Available from: http://www.cancer.org/cancer/ breastcancer/moreinformation/breastcancerearlydetection/breast-cancer-early-detection-acs-recs
28. Yoo KB, Kwon JA, Cho E, Kang MH, Nam JM, Choi KS, et al. Is mammography for breast cancer screening cost-effective in both Western and Asian countries?: results of a systematic review.
Asian Pac J Cancer Prev.2013;14(7):4141-9. https://doi.org/10.7314/APJCP.2013.14.7.4141
29. Vilaprinyo E, Forné C, Carles M, Sala M, Pla R, Castells X, et al. Cost-effectiveness and harm-benefit analyses of risk-based screening strategies for breast cancer. PLoS One. 2014;9(2):e86858. https://doi.org/10.1371/journal.pone.0086858
Funding:Comisión Nacional de Investigación Cientíica y Tecnológica (FONDECYT – Grant 11121634 and 3130532], Chile. he sponsor did not have any involvement in the study design, in the collection, analysis, and interpretation
of data, in the writing of the manuscript, and in the decision to submit the manuscript for publication.
Authors’ Contributions: Developed and solved the mathematical model, run simulations, participated in preparing
the inal draft, and approved the inal version: QK, SM. Contributed with Chilean data and medical/epidemiological insight, interpreted the results, participated in preparing the inal draft, and approved the inal version: AP.
Acknowledgements: To Marta Prieto, Chilean Ministry of Health, and Dr. María Luisa Garmendia, from the
University of Chile, by their insightful comments.