Mariângela F Silveira Alicia MatijasevichII Bernardo L HortaII Heloisa BettiolIII
Marco Antônio BarbieriIII Antonio A SilvaIV
Patricia H C RondóV Abelardo N LunardelliVI Marco A PeresVI,VII Ricardo Q GurgelVIII Antônio L CunhaIX Luiza M CalvanoIX Joffre AminJrX Maria do C LealXI
Ana Cristina Guimarães MatosXII Ana Goretti MaranhãoXIII Juan José Cortez-EscalanteXIII Aluísio J D BarrosII
Fernando C BarrosII,XIV Cesar G VictoraII
I Departamento Materno-Infantil. Faculdade de Medicina. Universidade Federal de Pelotas. Pelotas, RS, Brasil
II Programa de Pós-Graduação em Epidemiologia. Universidade Federal de Pelotas. Pelotas, RS, Brasil
III Departamento de Puericultura e Pediatria. Faculdade de Medicina de Ribeirão Preto. Universidade de São Paulo. São Paulo, SP, Brasil IV Departamento de Saúde Pública.
Universidade Federal do Maranhão. São Luís, MA, Brasil
V Departamento de Nutrição. Faculdade de Saúde Pública. Universidade de São Paulo. São Paulo, SP, Brasil
VI Programa de Pós-Graduação em Saúde Coletiva. Universidade Federal de Santa Catarina. Florianópolis, SC, Brasil VII Australian Research Centre for Population
Oral Health. University of Adelaide. Adelaide, Australia
VIII Universidade Federal de Sergipe. Aracaju, SE, Brasil
IX Departamento de Pediatria. Faculdade de Medicina. Universidade Federal do Rio de Janeiro. Rio de Janeiro, RJ, Brasil X Departamento de Ginecologia e
Obstetrícia. Faculdade de Medicina. Universidade Federal do Rio de Janeiro. Rio de Janeiro, RJ, Brasil
XI Escola Nacional de Saúde Pública. Fundação Oswaldo Cruz. Rio de Janeiro, RJ, Brasil XII Escritório do Brasil. Fundo das Nações
Unidas para a Infância. Brasília, DF, Brasil XIII Coordenação Geral de Informação e
Análise Epidemiológica. Secretaria de Vigilância em Saúde. Ministério da Saúde do Brasil. Brasília, DF, Brasil
XIV Programa de Pós-Graduação em Saúde e Comportamento. Universidade Católica de Pelotas. Pelotas, RS, Brasil
Correspondence:
Mariangela Freitas da Silveira
Rua Marechal Deodoro, 1160 3° Piso Centro 96020-220 Pelotas, RS, Brasil
E-mail: maris.sul@terra.com.br Received: 6/14/2013 Approved: 9/23/2013
Article available from: www.scielo.br/rsp
Prevalence of preterm birth
according to birth weight
group: a systematic review
ABSTRACT
OBJECTIVE: To estimate the prevalence of preterm birth by categories of birth weight, and to obtain an equation to correct the estimates.
METHODS: Systematic review of the Brazilian literature published from 1990 to 2012, to identify studies with primary collection of data on birth weight and gestational age. Twelve studies were selected and contributed for tabulations of preterm prevalence according to 100 g birth weight categories. These results were combined using sex-speciic fractional polynomial equations and the resulting curves were compared with results from the Live Birth Information System for the years 2000, 2005, 2010 and 2011.
RESULTS: For all birth weight categories, preterm prevalence estimates based on primary studies had a higher prevalence than those of the the Live Birth Information System. The prevalence reported by the Live Birth Information System was of 7.2% in 2010, about 38.0% lower than the estimated prevalence of 11.7% obtained with the correctional equation.
CONCLUSIONS: Information reported by the Live Birth Information System on preterm prevalence does not relect the true magnitude of the problem in Brazil, and should not be used without the correction factors proposed in the present analyses.
DESCRIPTORS: Infant, Premature. Infant, Low Birth Weight.
In many countries, the prevalence of preterm births, occurring before the 37th week of pregnancy,a shows a tendency to increase, even in high-income coun-tries such as the United States, Australia, Japan and Canada.13 A World Health Organization Report,28 based on estimates made through statistical modelling, esti-mates that in the world, every year, there are 15 million preterm births, more than 10.0% of the total.a
This high prevalence represents complications related to prematurity, the most common cause of neonatal and infant death in middle- and high-income countries13 including Brazil.4,8,27 The high prevalence of prematu-rity has signiicant social and economic repercussions: in the short term, increasing demand for neonatal inten-sive care units and the costs of the care needed, in the long term, for individuals suffering from permanent health conditions with irreparable damage to their physical and mental health.13
The WHO report places Brazil as the country with the tenth highest number of preterm births in absolute terms,a with an estimated prevalence of 9.2%. Oficial data collected by the Sistema de Informações sobre Nascidos Vivos (SINASC – Live Birth Information System) between 2000 and 2010 indicate that there has been a slight increase in the prevalence of preterm births in the country (from 6.8% to 7.1%).
Data collected in Brazilian studies26 using primary data suggest that the prevalence of preterm births is higher than the level estimated by the SINASC and that the increase in prematurity appears to be higher in recent decades. A systematic review (2008)26 showed an evolution in the prevalence of prematurity from around 4.0% at the beginning of the 1980s to over 10.0% after 2000. Reliable, validated SINASC studies indicate low concordance with the rate of preterm births obtained based on rates calculated in population based research.19 This poor concordance may be partly explained by the fact that until 2011, data on gestational age (GA) was collected in class intervals and not in complete weeks.19
The aim of this study was to estimate the prevalence of preterm births according to birth weight and to obtain an equation to correct the estimates.
METHODS
A systematic review of Brazilian population based publications from 2008, containing information on the INTRODUCTION
prevalence of preterm births from 1970 to 2004.26 The search included articles published in journals, disserta-tions and theses. This review was updated in 2012 for the 1990-2012 period, using the Medline and Lilacs databases, using the search terms: (premature/preterm and Brazil); (premature/preterm delivery and Brazil); (premature/preterm infant and Brazil); (premature/ preterm labor and Brazil); (risk factors and premature/ preterm delivery and Brazil); (risk factors and prema-ture/preterm labor and Brazil); (associated factors and premature/preterm labor and Brazil); (associated factors and premature/preterm delivery and Brazil); (incidence and premature/preterm labor and Brazil); (prevalence and premature/preterm labor and Brazil); (incidence and premature/preterm delivery and Brazil); (preva -lence and premature/preterm delivery and Brazil).
Articles concerning clinical topics, such as complica-tions of prematurity and pregnancy, or health care for premature newborns were excluded. Inclusion criteria were: studies on the prevalence of prematurity in Brazil carried out after 1990. Studies deemed to have repre-sentative samples were those which included all births taking place in a speciic location, in a speciic period or which used some kind of probabilistic process to select a sample of newborns. In the case of more than one article based on the same database, the irst to be published was included.
Forty-nine references were identiied in the Medline database in the 2008 review,26 of which 42 were excluded and ten included. In the Lilacs database, 46 references were identiied, with three being included (two articles and one thesis) and 43 excluded as they did not meet the inclusion criteria. The references of all the articles were examined, although no further articles were identiied. Finally, 11 texts were identiied using primary data on the Northeast, South and Southeast of the country: nine articles published in journals,1,5,7,9,11,15,17,21,23 one doctoral thesisb and one Master’s dissertation.c
The bibliographical research was widened to include publications from after 2004 and to exclude those published before 1990. The bibliographical research used the same methodology described in the previous study.26 This procedure identiied two new publica -tions2,10 and four articles were excluded.5,7,9,22
The authors of these nine publications were contacted and invited to participate. They were asked to provide the following information on the database used in the
a March of Dimes; The Partnership for Maternal Newborn and Child Health; Save the Children; World Health Organization. Born too soon: the global action report on preterm birth. Geneva: WHO; 2012.
b Rumel D. Acurácia dos critérios de risco do Programa de Defesa da Vida dos Lactentes do Município de Bauru entre 1986 e 1988 [Tese]: Universidade de São Paulo; 1989.
publication: the total number of newborns and preterm newborns for each birth weight group, divided per 100 g, starting at 400 g. This data was to be reported separately, according to sex.
For four studies identiied in the review,1,2,17,c the authors reported that the original database no longer existed, and the article could therefore not be included in the analyses, leaving seven studies.
The authors of the articles and other Brazilian researchers in this ield were asked whether they were aware of any
other Brazilian databases, published or not, the authors of which could provide the data presented. At the end of this process, another ive databases were identiied. Four of them concerned original, unpublished studies: BRISA – cohorts in Ribeirao Preto, SP, and Sao Luís, MA, both from 2010; Rio de Janeiro, RJ, 2010; Pelotas, RS, Intergrowth 2010,25 and the ifth was a collabora -tive nationwide study.14 At the end of the search, twelve databases were available for the research.
A linear regression model based on fractional poly-nomials was constructed to estimate the expected
Table. Characteristics of the studies included in the analysis, 1990-2012.
Author, year and place of publication
Description of the sample Number of
births
Method used to estimate gestational agea % preterm births % low birth weight Horta et al,11
1993, Pelotas, RS
Study of all births in all maternity hospitals in the city throughout the year
5,249 LMP 7.5 9.6
Bettiol et al,7 1994, Ribeirao Preto, SP
Study of all births in all maternity hospitals in the city for five months
2,846 LMP, regression
model used to impute GA for unknown values
13.3 12.3
Silva et al,23 1997-1998, Sao Luís, MA
Study of a systematic sample of hospital births throughout the year
2,487 LMP, regression
model used to impute GA for unknown values
13.9 9.6
Rondo et al,21 1997-2000, Jundiaí, SP
Study of newborns in a cohort of pregnant women attending antenatal
care
865 LMP, US, Capurro 4.2 6.5
Lunardelli et al,15 2003, Itajaí, SC
Study of newborns from a group of women selected after exclusion criteria
(age, disease, number of teeth) for five months in maternity hospitals
449 LMP 7.1 5.5
Barros et al,3 2004, Pelotas, RS
Study of all births in all maternity hospitals in the city throughout the year
4,231 LMP, US 15 10
Gurgel et al,10 2005, Aracaju, SE
Study of all births in all maternity hospitals in the city in four consecutive
months
4,746 LMP, Capurro 7.7 7.2
Silva et al, 24 2010, Sao Luís, MA
Study of a systematic sample of hospital births throughout the year
5,149 LMP, regression
model used to impute GA for unknown values
12.9 8.6
Bettiol et al,7 2010, Ribeirao Preto, SP
Study of all births in all maternity hospitals in the city throughout the year
7,716 LMP regression
model used to impute GA for unknown values
14.0 9.5
Ledo et al,b 2010, Rio de Janeiro, RJ
Study of births in maternity school for a year
2,716 LMP 11.3 10.0
Intergrowth,25 2011-2012, Pelotas, RS
Study of all births in all maternity hospitals in the city over 15 months
6,109 LMP, US, physical
examination
14.8 12.4
Leal et al,14 2011-2012, Nascer no Brasil, Brazil
National study in 191 cities over 18 months
23,940 LMP 12.5 8.5
LMP: last menstruation period; US: ultrasound ; GA: gestational age
a Several studies used more than one method of assessing gestational age, but the results discussed here are based primarily on the date of last menstruation, complementary methods being used when this information was not available or was inaccurate.
proportion of premature births for each birth weight group. Modelling using fractional polynomials is ideal in this situation in which the study was not linear, as it allows a high degree of lexibility in the adjusted curves. This approach is superior to the traditional way of adding quadratic, cubic and other terms to the model.22 This strategy of selecting curves uses a
set of pre0deined exponents (-2, -1, -0.5, 0, 0.5, 1, 2, 3), where zero equals the natural logarithm. The independent variable may appear more than once in the regression equation; therefore, a model with two terms is selected. Of the 44 possible models (eight with only one term, and another 36 combinations of the eight exponents in pairs), the best was chosen. The
Figure 1. Prevalence of preterm birth in males (A) and female (B) according to categories of birth weight (each dot represents
the result of a study). Brazil, 1993-2011. B
0
A
0 1,000 2,000 3,000 4,000
0 1,000 2,000 3,000 4,000
Weight (g)
Aracaju-2005
Riberao Preto-2010
Pelotas-2004
Sao Luís-2010
Riberao Preto-1994
Itajaí-2003
Jundiaí-1997
Pelotas-1993
Brazil-2011 Sao Luís-1997
Uni. Fed. Rio de Janeiro - 2010
Pelotas-2011 %
%
0.2
0.4
0.6
0.8
1.0
0
0.2
0.4
0.6
0.8
proportion of premature births varied between 0 and 1 and the outcome underwent a logistic transforma-tion before the model was adjusted. In order to avoid ininites in the result of the transformation in cases where the proportion was zero or one, 0.01 was added or subtracted. The mean value of the birth weight for each interval was used as a predictor. After adjusting the models, separate estimates for males and females, the adjusted values and their respective conidence intervals were transformed again to the original scale. The models were adjusted to give proportional weighting to the number in each birth weight group for each study. Each of these studies was treated as one conglomerate in calculating the standard error of the coeficients.22
Data referring to 2000, 2005 and 2010 from the SINASC 2000-2011 database, when the data on gesta-tional age were collected in categories (0-21, 22-27, 28-36, 37-41, 42 weeks and over, or unknown) were analyzed. From 2011 onwards, this data started to be collected as a continuous variable, measured in weeks. The same analyses carried out in the studies of primary data were repeated with the SINASC data.
RESULTS
Table shows the data concerning the databases, authors, year, location of the study, number of children taking part, method for determining gestational age and prevalence of preterm births and of newborns with low birth weight.
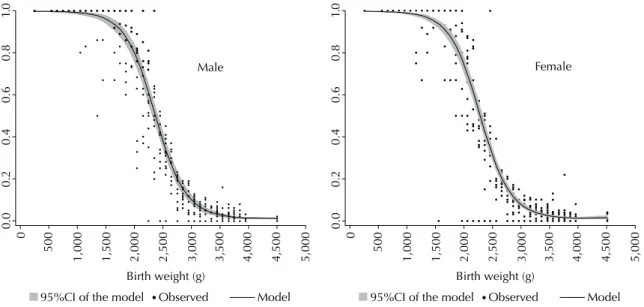
Figure 2. Fractional polynomials and 95% confidence interval for the probability of preterm birth in male and female categories
according to birth weight, obtained by weighted analysis of the 12 studies. Brazil, 1993-2011.
0.0
0
500
1,000 1,500 2,000 2,500 3,000 3,500 4,000 4,500 5,000
Birth weight (g)
0.2
0.4
0.6
0.8
1.
0
Male
0.0
0
500
1,000 1,500 2,000 2,500 3,000 3,500 4,000 4,500 5,000
Birth weight (g)
0.2
0.4
0.6
0.8
1.
0
Female
95%CI of the model Observed Model 95%CI of the model Observed Model
Figure 3. Prevalence of preterm births in males according to
categories of birth weight, comparing the results of the current study with data from the Information System on Live Births (SINASC) in different years. Brazil, 2000, 2005, 2010, 2011.
0
20
40
60
80
10
0
400 900 1,400 1,900 2,400 2,900 3,400 3,900 4,400 Birth weight (g)
SINASC 2005 SINASC 2000
SINASC 2010 SINASC 2011
Model with the primary data
Figure 4. Prevalence of preterm births in females according to
categories of birth weight, comparing the results of the current study with data from the Information System on Live Births (SINASC) in different years. Brazil, 2000, 2005, 2010, 2011.
0
20
40
60
80
10
0
400 900 1,400 1,900 2,400 2,900 3,400 3,900 4,400 Birth weight (g)
SINASC 2005 SINASC 2000
SINASC 2010 SINASC 2011
Six of the databases concern repeated studies conducted in Sao Luís, MA (1997-1998 and 2010, the latter as yet unpublished),23 Ribeirao Preto, SP (1994 and 2010, the latter also unpublished)7 and Pelotas, RS (1993, 2004, 2011).3,11 These studies are population based, including birth occurring in these municipalities (generally over the period of one year) or systematic samples of all newborns. In the Ribeirao Preto and Sao Luís cohorts in the 2010-BRISA, births in households resident in the municipalities were included. Pelotas, RS, contributed with a perinatal study carried out over a 15-month period between 2011 and 2012, evaluating all births in the municipality. This study was part of a multi-center international project – Intergrowth-21.25 The perinatal study in Aracaju, SE, in 2005,10 assessed births in the four largest maternity wards in the municipality over four months. Births occurring in 2010 in the maternity school of the Universidade Federal do Rio de Janeiro
were studied by Cunha (data not published). Two other studies included in the sample had some type of selection of the population studied: one in Itajaí, SC,15 on periodontal disease and preterm births, with data collected daily for ive months in the city’s only maternity ward, the sample including data on preg-nant women aged 18 to 40, without signiicant health problems, and with at least 18 natural teeth. The other cohort study, in Rondó,21 Jundiaí, SP, on stress during pregnancy and perinatal results, included women receiving full pre-natal care in health care units and hospitals in the municipality.
This review included unpublished data regarding the
Nascer no Brasil study,14 which is a multi-centric hospital based cohort that included a post-natal visit and a telephone interview between 45 and 60 days postpartum. The sample was stratiied by geographical macro-region, type of municipality and type of hospital. The data were collecetd between February 2011 and October 2012 in hospitals with at least 500 births per year, and data on hospital births, all live births and still births weighing at least 500g and/or with a gestational age of > 22 weeks were included. In this study, newborns with birth weights incompatible with GA (< -3 SD or > 3 SD in the weight curve for WHO GA) were excluded from the analysis.16
In all of the studies, the data of the last menstrual period (LMP) was the method used to calculate gestational age, sometimes complemented by ultrasound (US) or physical examination of the newborn. In the studies in Ribeirao Preto and Sao Luís, unknown gestational ages were imputed using a multiple regression model. Even those studies which used several sources of gestational age (such as Intergrowth,25 in Pelotas, or Nascer no
Brasil14), the date of the last menstruation was used to increase comparability with the SINASC.
Lower prevalence was observed in the studies in Jundiaí and Itajaí. The prevalence of preterm births in the studies conducted after 2000 was higher than 10.0%, except the study in Aracaju, in 2005, in which the prevalence was 7.7% and the study in Itajaí, in 2003, with a prevalence of 7.1%. The lowest rates of preva-lence of low birth weight among recent studies were observed in municipalities in the Northeast – Aracaju (7.2%) and Sao Luís (8.6%) –, whereas studies in the South and Southeast had rates of prevalence between 9.5% (Ribeirao Preto, 2010) and 12.4% (Pelotas, 2011). The national study Nascer no Brasil14 had an estimate of 8.5% (Table).
The number of births in each 100 g category was small in some of the studies. Variability was observed, especially up to a weight of 2,000 g, which included relatively few children (Figure 1).
Fractional polynomials were calculated based on these data (Figure 2). For males and females, the model selected was to the power of 2 and 3, using the logit outcome of the proportion of premature births in each birth weight group. The mean value of birth weight in each interval was used as a predictor, giving the following equation for males:
Logit (proportion of premature births) = -0.06 - 1.77.weight^2 + 0.28.weight^3 And for females the equation was:
Logit (proportion of premature births) = -0.47 - 1.84. weight^2 + 0.30. weight^3
The resulting curves remained practically unchanged when the analysis was repeated without weighting, i.e., with the same weight on each of the studies (Annexes 1 and 2).
The primary studies indicated higher rates of preva-lence of preterm births than the SINASC in practically all birth weight groups between 1,000 g and 3,200 g (Figures 3 and 4). The change in the mode of SINASC data collection in 2011, when gestational age began to be collected as a continuous variables, resulted in greater concordance with the results of the primary studies in birth weight groups of 2,000g and upwards.
Applying correction factors to the SINASC database for 2010 indicated a national prevalence of 11.7%, higher than the SINASC igure of 7.1% (Annex 3).d
DISCUSSION
The studies included represent practically all of the existing research on the epidemiology of premature birth in the period in question. With the exception of
the nationwide Nascer no Brasil study,14 the studies were carried out in the Southeast, South and Northeast.
Different methods can be used for assessing gestational age in epidemiological studies. High quality US examina-tions in the irst 14 weeks represent the gold standard.18 However, the majority of epidemiological studies are based on LMP data, even in countries such as the United States and the United Kingdom, where the difference between the two methods is between two and three days.12 Two Brazilian studies present conlicting visions of this topic. A prospective study in two cities in the Southeast of public health care system – Sistema Único de Saúde
(SUS) users20 showed that, compared with results obtained by ultrasound (US) up to 20 weeks, the date of the last menstrual period (after excluding outliers) had a sensi-tivity of 71.0% and accuracy of 94.0%, estimating the prevalence at 14.0% compared with 12.5% according to US. The authors considered the US as the gold standard, without discussing the quality of the examination and mentioned that in one of the two municipalities, they were performed by a health care professional connected to the research team. The 2004 cohort study in Pelotas,6 uses LMP as the gold standard. It shows that, for infants born between 32 and 36 weeks, US carried out before 20 weeks overestimated gestational age by 1.8 weeks for pregnant women cared for by the SUS, although this igure was only ive days in the private sector. This difference is attributed to the poor quality of the exams carried out on SUS patients. LMP was used as the gold standard in this study, in contrast with the previous study.
Although early US is the gold standard when performed properly by a trained professional, there are many Brazilian women for whom this data is not available. The mean age of the irst US exam available was 20.0 weeks, with a standard deviation of 7.6 in the study in Pelotas (2004).6 As the main objective of this study was to compare data with that of the SINASC, where gestational age is usually measured using hospital charts and based on LMP, it was decided to use data based on LMP of the various primary studies, although some provided data based on US or physical examination of the newborn.
The underlying assumption of combining the data of the studies in diverse regions, speciically, that the prevalence of intrauterine growth restriction would be relatively constant throughout the country, justiied combining data from different regions in one single esti-mate. Although, historically, the North and Northeast have worse health indicators for mother and baby health, this differential is being rapidly reduced.27 The prevalence of low weight/height and height/age ratios in children under ive was practically the same for the
whole country in 2006-07.27 Low birth weight, para-doxically, is slightly more prevalent in richer regions than in poorer regions,23 and the same is true of the prevalence of preterm births estimated by SINASC.d The current analyses show that the conidence intervals of the estimates obtained using fractional polynomials are narrow (Figures 3 and 4), with the exception of birth weight groups < 2,000 g, in which the number of births in the studies is very small. However, the results of these studies appear to be homogenous and there is no evidence of differences between regions that impede national estimates being obtained, which justiies the approach used.
All births with birth weight < 1,000 g were preterm, prevalence > 90.0% in infants between 1,000 g and 1,800 g. From 3,000 g and upwards, the prevalence of preterm births was low. As in many studies, the numbers of births in each 100 g group were small, there is considerable variation between the studies, but the mean curves follow the expected pattern. The relatively low rates of preva-lence observed in Jundiaí and Itajaí are probably due to the fact that these studies included samples of pregnant women who probably had lower risk pregnancies.
Comparing the curve based on the primary data and the SINASC results suggests that the SINASC underesti-mates the prevalence of premature births in Brazil. The situation appears to have changed for the better in 2011 compared with the previous decade. This is possibly due to the fact that gestational age began to be collected in exact weeks, and not grouped into categories. Even in 2011, many maternity wards used the previous version of the Statement of Live Birth, which is being gradually replaced by the updated version. A more exact evaluation of the impact of the change in the document may be able to be carried out from 2012 onwards. The differences between the SINASC data and the primary data occur mainly up to 3,000 g. Above this weight, they are lower and not signiicant.
These analyses suggest that the SINASC data underes-timated the prevalence of preterm births at least until 2010. In this year, the estimate of 7.1% reported by the SINASC was 385 lower than the corrected prevalence of 11.7%. Preliminary results of the Nascer no Brasil
study,14 based on ultrasounds, indicate that national prevalence of 11.4%, close to the estimate presented here.
1. Almeida SDM, Barros MBA. Equidade e atenção à saúde da gestante em Campinas (SP), Brasil. Rev Panam Salud Publica. 2005;17(1):15-25. DOI:10.1590/S1020-49892005000100003 2. Araújo BF, Bozzetti MC, Tanaka ACA. Mortalidade
neonatal precoce no municipio de Caxias do Sul: um estudo de coorte. J Pediatr (Rio J). 2000;76(3):200-6. 3. Barros AJD, Santos IS, Victora CG, Albernaz
EP, Domingues MR, Timm IK, et al. Coorte de nascimentos de Pelotas, 2004: metodologia e descrição. Rev Saude Publica. 2006;40(3):402-13. DOI:10.1590/S0034-89102006000300007
4. Barros FC, Bhutta ZA, Batra M, Hansen TN, Victora CG, Rubens CE. Global report on preterm birth and stillbirth (3 of 7): evidence for effectiveness of interventions. BMC Pregnancy Childbirth. 2010;10 Suppl 1:S3.
5. Barros FC, Huttly SR, Victora CG, Kirkwood BR, Vaughan JP. Comparison of the causes and consequences of prematurity and intrauterine growth retardation: a longitudinal study in southern Brazil. Pediatrics. 1992;90(2 Pt 1):238-44.
6. Barros FC, Victora CG, Barros AJ, Santos IS, Albernaz EP, Matijasevich A, et al. The challenge of reducing neonatal mortality in middle-income countries: findings from three Brazilian birth cohorts in 1982, 1993, and 2004. Lancet. 2005;365(9462):847-54. DOI:10.1016/S0140-6736(05)71042-4
7. Bettiol H, Rona RJ, Chinn S, Goldani M, Barbieri MA. Factors associated with preterm births in southeast Brazil: a comparison of two birth cohorts born 15 years apart. Paediatr Perinat Epidemiol. 2000;14(1):30-8. DOI:10.1046/j.1365-3016.2000.00222.x 8. Goldani MZ, Barbieri MA, Rona RJ, Silva AAM,
Bettiol H. Increasing pre-term and low-birth-weight rates over time and their impact on infant mortality in south-east Brazil. J Biosoc Sci. 2004;36(2):177-88. DOI:10.1017/S0021932003006175
9. Gray RH, Ferraz EM, Amorim MS, Melo LF. Levels and determinants of early neonatal mortality in Natal, northeastern Brazil: results of a surveillance and case-control study. Int J Epidemiol. 1991;20(2):467-73. 10. Gurgel RQ, Nery AMDG, Almeida MLD, Oliveira
ERR, Lima DDF, Bettiol H, et al. Características das gestações, partos e recém-nascidos da região metropolitana de Aracaju, Sergipe, Brasil. Rev Bras Saude Mater Infant. 2009;9(2):167-77. DOI:10.1590/S1519-38292009000200006
11. Horta BL, Barros FC, Halpern R, Victora CG. Baixo peso ao nascer em duas coortes de base populacional no Sul do Brasil. Cad Saude Publica. 1996;12(Supl 1):S27-31. DOI:10.1590/S0102-311X1996000500005
12. Kramer MS, Papageorghiou A, Culhane J, Bhutta Z, Goldenberg RL, Gravett M, et al. Challenges in defining and classifying the preterm birth syndrome. Am J Obstet Gynecol. 2012;206(2):108-12. DOI:10.1016/j. ajog.2011.10.864
13. Lawn JE, Gravett MG, Nunes TM, Rubens CE, Stanton C. Global report on preterm birth and stillbirth (1 of 7): definitions, description of the burden and opportunities to improve data. BMC
Pregnancy Childbirth. 2010;10(Suppl 1):S1. DOI:10.1186/1471-2393-10-S1-S1
14. Leal MC, Silva AAN, Dias MAB, Gama SGN, Rattner D, Moreira ME, Theme Filha MM, et al. Birth in Brazil: national survey into labour and birth. Reprod Health. 2012;9:15. DOI:10.1186/1742-4755-9-15
15. Lunardelli AN, Peres MA. Is there an association between periodontal disease, prematurity and low birth weight? A population-based study. J Clin Periodontol. 2005;32(9):938-46. DOI:10.1111/j.1600-051X.2005.00759.x 16. Mikolajczyk RT, Zhang J, Betran AP, Souza
JP, Mori R, Gülmezoglu AM, et al. A global reference for fetal-weight and birthweight percentiles. Lancet. 2011;377(9780):1855-61. DOI:10.1016/S0140-6736(11)60364-4 17. Nascimento LFC. Epidemiology of preterm
deliveries in Southeast Brazil: a hospital-based study. Rev Bras Saude Mater Infant. 2001;1(3):263-8. DOI:10.1590/S1519-38292001000300007 18. National Institute for Health Care and Excellence.
Antenatal care: routine care for the healthy pregnant women. London; 2008. (NICE Clinical Guidelines, 62). 19. Pedraza DF. Qualidade do Sistema de Informações
sobre Nascidos Vivos (Sinasc): análise crítica da literatura. Cienc Saude Coletiva. 2012;17(10):2729-37. DOI:10.1590/S1413-81232012001000021
20. Pereira AP, Dias MA, Bastos MH, Gama SG, Leal MC. Detemining gestational age for public health care users in Brazil: comparison of methods and algorithm creation. BMC Research Notes. 2013;6:60.
21. Rondo PH, Ferreira RF, Nogueira F, Ribeiro MC, Lobert H, Artes R. Maternal psychological stress and distress as predictors of low birth weight, prematurity and intrauterine growth retardation. Eur J Clin Nutr. 2003;57(2):266-72. DOI:10.1038/sj.ejcn.1601526 22. Royston P, Sauerbrei W. Multivariable Model-building:
A Pragmatic Approach to Regression Analysis Based on Fractional Polynomials for Modelling Continuous Variables. Chichester, UK: Wiley 2008.
23. Silva AAM, Coimbra LC, Silva RA, Alves MTSSB, Lamy Filho F, Lamy ZC, et al. Perinatal health and mother-child health care in the municipality of São Luís, Maranhão State, Brazil. Cad Saude Publica. 2001;17(6):1413-23. DOI:10.1590/S0102-311X2001000600025 24. Silva AAM, Silva LM, Barbieri MA, Bettiol
H, Carvalho LM, Ribeiro VS, et al. The epidemiologic paradox of low birth weight in Brazil. Rev Saude Publica. 2010;44(5):767-75. DOI:10.1590/S0034-89102010005000033 25. Silveira MF, Barros FC, Sclowitz IK, Domingues MR,
Mota DM, Fonseca SS, et al. Implementation of the INTERGROWTH-21st Project in Brazil. BJOG : an international journal of obstetrics and gynaecology. 2013;120 Suppl 2:81-6.
This study was supported by the Brazilian Ministry of Health, General Coordination of Information and Epidemiological Analysis, Department of Health Surveillance (Contract no. BR/CNT/1200975.001, 2012) and by the Brazil Office of the United Nations Fund for Children (Contract no. 43127038, 2012).
The authors declare that there are no conflict of interests. studies. Rev Saude Publica. 2008;42(5):957-64. DOI:10.1590/S0034-89102008000500023
27. Victora CG, Aquino EM, Leal MC, Monteiro CA, Barros FC, Szwarcwald CL. Maternal and child health in Brazil:
progress and challenges. Lancet. 2011;377(9780):1863-76. DOI:10.1016/S0140-6736(11)60138-4
Prev
alence of preterm birth
Silv
eir
a MF et al
0 499 1.00 1.00 1.00 1.00
500 599 1.00 1.00 1.00 1.00 1.00 1.00 1.00 1.00 1.00
600 699 1.00 1.00 1.00 1.00 1.00 1.00 1.00 1.00 1.00
700 799 1.00 1.00 1.00 1.00 1.00 1.00
800 899 1.00 1.00 1.00 1.00 1.00 1.00 1.00 1.00 1.00 1.00
900 999 1.00 1.00 1.00 1.00 1.00 1.00 1.00 1.00 1.00 1.00
1,000 1,099 0.80 1.00 1.00 1.00 1.00 1.00 1.00 1.00 1.00 1.00 0.98 1,100 1,199 1.00 1.00 1.00 0.83 1.00 1.00 1.00 1.00 1.00 1.00 0.98 1,200 1,299 1.00 1.00 1.00 1.00 1.00 1.00 1.00 1.00 1.00 1.00 1.00 1,300 1,399 0.50 1.00 1.00 1.00 0.86 1.00 1.00 1.00 1.00 1.00 0.94 1,400 1,499 0.86 1.00 0.86 1.00 1.00 0.67 1.00 1.00 1.00 1.00 0.94
1,500 1,599 1.00 1.00 1.00 1.00 1.00 1.00 1.00 1.00 1.00 1.00
1,600 1,699 0.92 0.67 1.00 0.80 1.00 1.00 1.00 0.91
1,700 1,799 0.75 0.75 0.83 0.89 1.00 1.00 1.00 1.00 1.00 0.91
1,800 1,899 0.71 0.75 0.66 0.86 1.00 0.86 0.93 1.00 1.00 0.86 0.60 0.84 1,900 1,999 0.90 0.83 1.00 0.92 0.73 0.83 0.90 1.00 1.00 1.00 0.91
2,000 2,099 0.89 0.33 0.76 0.80 0.25 0.82 0.63 0.81 0.38 0.63
2,100 2,199 0.60 0.50 0.60 0.73 0.69 0.37 0.76 0.69 1.00 0.85 0.40 0.65 2,200 2,299 0.44 0.35 0.75 0.72 0.76 0.56 0.50 0.60 0.00 0.81 0.57 0.55 2,300 2,399 0.63 0.30 0.50 0.64 0.59 0.23 0.48 0.61 1.00 0.61 0.20 0.53 2,400 2,499 0.50 0.28 0.00 0.46 0.41 0.46 0.42 0.34 0.25 0.52 0.32 0.36 2,500 2,599 0.33 0.31 0.25 0.45 0.28 0.41 0.26 0.37 0.00 0.39 0.22 0.30 2,600 2,699 0.19 0.13 0.13 0.30 0.37 0.33 0.19 0.28 0.17 0.34 0.21 0.24 2,700 2,799 0.15 0.20 0.06 0.23 0.09 0.19 0.13 0.22 0.00 0.21 0.05 0.14 2,800 2,899 0.19 0.06 0.11 0.18 0.06 0.12 0.10 0.13 0.08 0.15 0.12 0.12 2,900 2,999 0.14 0.17 0.00 0.09 0.05 0.04 0.09 0.18 0.19 0.09 0.03 0.10 3,000 3,099 0.07 0.10 0.03 0.08 0.11 0.08 0.12 0.13 0.00 0.04 0.04 0.07 3,100 3,199 0.07 0.09 0.03 0.06 0.06 0.06 0.05 0.08 0.00 0.02 0.05 0.05 3,200 3,299 0.10 0.10 0.00 0.05 0.10 0.03 0.07 0.11 0.05 0.03 0.05 0.06 3,300 3,399 0.06 0.07 0.00 0.06 0.04 0.01 0.06 0.07 0.00 0.01 0.04 0.04 3,400 3,499 0.09 0.05 0.00 0.06 0.05 0.04 0.02 0.03 0.07 0.00 0.04 0.04 3,500 3,599 0.06 0.16 0.00 0.02 0.00 0.00 0.02 0.01 0.00 0.00 0.02 0.03 3,600 3,699 0.03 0.03 0.00 0.06 0.08 0.01 0.02 0.01 0.00 0.01 0.04 0.03 3,700 3,799 0.04 0.02 0.00 0.01 0.03 0.06 0.00 0.01 0.00 0.00 0.05 0.02 3,800 3,899 0.05 0.08 0.00 0.03 0.00 0.02 0.00 0.00 0.00 0.00 0.00 0.02 3,900 3,999 0.00 0.00 0.00 0.01 0.00 0.00 0.00 0.03 0.00 0.01 0.00 0.00 4,000+ 0.01 0.00 0.00 0.00 0.00 0.01 0.02 0.00 0.00 0.01 0.02 0.01 Blank cells indicate no data.
Prev
alence of preterm births b
y birth weight groups in Br
azilian studies. Male. Br
11
2010 1997 1997 2010 1994 2010 1993 2004 2003 2011 2005
0 499 1.00 1.00 1.00 1.00 1.00 1.00
500 599 1.00 1.00 1.00 1.00 1.00
600 699 1.00 1.00 1.00 1.00 1.00 1.00 1.00 1.00 1.00
700 799 1.00 1.00 1.00 1.00 1.00 1.00 1.00 1.00 1.00
800 899 1.00 1.00 1.00 100 1.00 1.00 1.00 1.00
900 999 1.00 1.00 1.00 1.00 1.00 1.00 1.00 1.00
1,000 1,099 1.00 1.00 1.00 1.00 1.00 1.00 1.00 1.00 1.00
1,100 1,199 0.75 1.00 1.00 0.80 1.00 1.00 1.00 1.00 0.94
1,200 1,299 1.00 1.00 0.92 1.00 1.00 1.00 1.00 1.00 1.00 0.67 0.87
1,300 1,399 1.00 1.00 0.89 0.80 1.00 1.00 1.00 1.00 1.00 0.97
1,400 1,499 1.00 1.00 1.00 0.92 1.00 100 1.00 1.00 1.00 1.00 1.00 0.99 1,500 1,599 1.00 1.00 0.00 1.00 1.00 1.00 1.00 1.00 1.00 1.00 1.00 0.91
1,600 1,699 0.83 0.93 1.00 0.67 1.00 1.00 0.92 0.91
1,700 1,799 0.90 1.00 1.00 1.00 0.86 1.00 1.00 1.00 0.88 0.67 0.93 1,800 1,899 0.82 0.75 0.79 0.50 0.67 0.82 0.93 1.00 0.88 1.00 0.82 1,900 1,999 1.00 0.80 0.50 0.90 0.77 1.00 0.94 1.00 0.91 0.00 0.78 2,000 2,099 0.58 0.77 0.66 0.78 0.46 0.75 0.81 0.88 0.00 0.87 0.43 0.63 2,100 2,199 0.62 0.45 0.00 0.86 0.61 0.83 0.43 0.67 0.00 0.82 0.46 0.52 2,200 2,299 0.44 0.36 0.50 0.45 0.38 0..44 0.57 0.53 0.00 0.48 0.35 0.41 2,300 2,399 0.51 0.15 000 0.51 0.29 0.41 0.41 0.38 0.50 0.48 0.36 0.36 2,400 2,499 0.39 0.36 0.00 0.42 0.31 0.26 0.33 0.42 1.00 0.45 0.19 0.38 2,500 2,599 0.17 0.19 0.10 0.25 0.20 0.17 0.19 0.28 0.00 0.39 0.16 0.19 2,600 2,699 0.16 0.21 0.12 0.18 0.14 0.20 0.23 0.19 0.22 0.24 0.16 0.18 2,700 2,799 0.10 0.16 0.00 0.12 0.09 0.14 0.10 0.21 0.20 0.21 0.03 0.12 2,800 2,899 0.07 0.16 0.03 0.13 0.09 0.09 0.07 0.17 0.00 0.15 0.04 0.09 2,900 2,999 0.10 0.10 0.00 0.07 0.09 0.08 0.07 0.15 0.08 0.06 0.04 0.07 3,000 3,099 0.12 0.10 0.00 0.08 0.07 0.07 0.08 0.07 0.00 0.02 0.02 0.06 3,100 3,199 0.05 0.11 0.00 0.06 0.10 0.02 0.07 0.07 0.00 0.03 0.04 0.05 3,200 3,299 0.10 0.07 0.00 0.08 0.06 0.00 0.04 0.03 0.00 0.01 0.06 0.04 3,300 3,399 0.04 0.10 0.02 0.06 0.03 0.05 0.03 0.05 0.00 0.00 0.03 0.04 3,400 3,499 0.07 0.08 0.00 0.04 0.05 0.01 0.01 0.06 0.00 0.01 0.03 0.03 3,500 3,599 0.04 0.10 0.00 0.01 0.04 0.00 0.02 0.02 0.13 0.00 0.03 0.03 3,600 3,699 0.03 0.05 0.00 0.05 0.05 0.00 0.03 0.04 0.00 0.01 0.01 0.02 3,700 3,799 0.00 0.03 0.00 0.04 0.02 0.05 0.01 0.03 0.22 0.00 0.03 0.04 3,800 3,899 0.03 0.04 0.00 0.02 0.00 0.00 0.02 0.00 0.00 0.00 0.04 0.01 3,900 3,999 0.00 0.00 0.00 0.08 0.00 0.00 0.00 0.00 0.00 0.02 0.03 0.01 4,000+ 0.01 0.00 0.00 0.03 0.00 0.00 0.01 0.00 0.00 0.00 0.04 0.01 Blank cells indicate no data.
Prev
alence of preterm births b
y birth weight groups in Br
azilian studies. F
emale. Br
Annex 3. Correction factors for the prevalence of preterm births by birth weight groups. Brazil, 1993-2011.
Birth weight group (g) Male Female
Prevalence (%) 95%CI Prevalence (%) 95%CI
0 499 99.8 99.6;99.9 99.7 99.5;99.9
500 599 99.7 99.4;99.8 99.6 99.3;99.8
600 699 99.6 99.3;99.8 99.5 99.1;99.7
700 799 99.5 99.1;99.8 99.4 99.0;99.6
800 899 99.4 98.9;99.7 99.2 98.7;99.5
900 999 99.3 98.7;99.6 99.0 98.4;99.4
1,000 1,099 99.0 98.3;99.4 98.7 97.9;99.2
1,100 1,199 98.7 97.8;99.2 98.2 97.3;98.9
1,200 1,299 98.3 97.2;98.9 97.6 96.5;98.4
1,300 1,399 97.6 96.3;98.5 96.7 95.3;97.7
1,400 1,499 96.7 95.1;97.8 95.5 93.7;96.8
1,500 1,599 95.4 93.4;96.9 93.7 91.5;95.3
1,600 1,699 93.6 91.2;95.4 91.2 88.5;93.3
1,700 1,799 91.1 88.2;93.3 87.7 84.6;90.3
1,800 1,899 87.6 84.3;90.3 83.2 79.5;86.2
1,900 1,999 83.0 79.2;86.2 77.2 73.2;80.7
2,000 2,099 77.0 73.0;80.5 69.9 65.7;73.7
2,100 2,199 69.7 65.6;73.4 61.4 57.3;65.3
2,200 2,299 61.2 57.3;64.9 52.2 48.4;55.9
2,300 2,399 52.0 48.4;55.6 42.9 39.5;46.3
2,400 2,499 42.8 39.5;46.1 34.2 31.3;37.2
2,500 2,599 34.1 31.2;37.2 26.5 24.1;29.2
2,600 2,699 26.5 23.9;29.4 20.3 18.2;22.5
2,700 2,799 20.3 17.9;22.9 15.3 13.5;17.2
2,800 2,899 15.3 13.3;17.6 11.5 10.0;13.1
2,900 2,999 11.5 9.8;13.5 8.6 7.4;10.0
3,000 3,099 8.7 7.2;10.4 6.5 5.5;7.7
3,100 3,199 6.6 5.4;8.0 5.0 4.2;6.0
3,200 3,299 5.0 4.1;6.2 3.9 3.2;4.7
3,300 3,399 3.9 3.1;4.9 3.1 2.5;3.8
3,400 3,499 3.1 2.5;3.9 2.5 2.0;3.1
3,500 3,599 2.5 2.0;3.1 2.1 1.6;2.6
3,600 3,699 2.0 1.6;2.6 1.7 1.4;2.2
3,700 3,799 1.7 1.4;2.2 1.5 1.2;2.0
3,800 3,899 1.5 1.2;1.9 1.4 1.0;1.8
3,900 3,999 1.3 1.1;1.6 1.3 0.9;1.7