Instrument for patient classification:
users’ opinions and analysis of
healthcare indicators
** Extracted from the Project “Instrumento para classificação de pacientes: opinião de usuários e análise de indicadores decuidado”, which was granted a research scholarship by Faculdade de Medicina de São José do Rio Preto, 2006. 1 Nurse, PhD. in Nursing, Professor at the Specialized Nursing Department
O
RIGINAL
A
R
TICLE
INSTRUMENTO PARA CLASSIFICAÇÃO DE PACIENTES: OPINIÃO DE USUÁRIOS E ANÁLISE DE INDICADORES DE CUIDADO
INSTRUMENTO PARA CLASIFICACIÓN DE PACIENTES: OPINIÓN DE LOS USUARIOS Y ANÁLISIS DE INDICADORES DEL CUIDADO
RESUMO
Esta pesquisa descritiva foi conduzida com o intuito de: 1- investigar a opinião de usuários sobre um instrumento de classificação de pacientes; e 2 - analisar os indicadores de cui-dados que mais contribuem para a classifica-ção dos pacientes nas diferentes categorias de cuidados. A opinião dos 24 usuários foi obtida por meio de questionário. O instru-mento de classificação foi aplicado em 796 pacientes em um hospital de ensino no inte-rior do Estado de São Paulo, no período de setembro de 2006 a maio de 2007. Para o tratamento estatístico, utilizou-se a Análise de Componentes Principais (ACP) e Análise Discriminante. Os usuários investigados mos-traram-se satisfeitos com o instrumento uti-lizado, mas apontaram uma tendência do mesmo à subestimar a categoria de cuidados à qual o paciente pertence. Os resultados evi-denciaram os indicadores Terapêutica, Cuida-do Corporal, Educação à Saúde e Integridade Cutâneo-Mucosa como aqueles com maior capacidade discriminatória. A classificação correta dos pacientes variou de 89,8% (cui-dados semi-intensivos) a 95,6% (cui(cui-dados in-tensivos).
DESCRITORES Pacientes/classificação. Carga de trabalho. Avaliação em enfermagem.
Marcia Galan Perroca1
ABSTRACT
This descriptive study was aimed at: 1.) in-vestigating the users’ opinions about an instrument for patient classification; 2.) analyzing the healthcare indicators that most contribute to classify patients in the healthcare categories. A questionnaire was used to collect the opinions of 24 users. The classification instrument was applied on 796 patients in a medical school hospital in the state of São Paulo, from September 2006 to May, 2007. Principal Components Analysis (PCA) and Discriminant Analysis were used for statistical analysis. Overall, the investigated users were satisfied with the instrument; however, they pointed out a certain tendency of the instrument to underestimate the nursing care category to which the patients belonged. The results revealed some healthcare indicators such as Therapy, Personal Hygiene, Skin Integrity and Health Education as the greatest dis-criminating care categories. The effective classification varied from 89.8% (semi-in-tensive care) to 95.6% (in(semi-in-tensive care).
KEY WORDS Patients/classification. Workload.
Nursing assessment.
RESUMEN
Investigación descriptiva conducida con la intención de: 1-investigar la opinión de los usuarios con relación a un instrumento de clasificación de pacientes y 2- analizar los indicadores de cuidados que más contribu-yeron para clasificar pacientes en sus dife-rentes categorías de cuidados. La opinión de los 24 usuarios fue obtenida a través de un cuestionario. El instrumento de clasificación fue aplicado en 796 pacientes de un hospi-tal de enseñanza del interior de São Paulo, durante setiembre del 2006 a mayo del 2007. El análisis estadístico realizado por Análisis de Componentes Principales (ACP) y Discriminativo. Los usuarios se mostraron satisfechos con el instrumento utilizado, sin embargo indicaron una tendencia del mis-mo para subestimar la categoría de cuidado al cual el paciente pertenece. Los resultados mostraron los indicadores: Terapéutica, Cui-dado Corporal, Educación para la Salud e In-tegridad Cutáneo-Mucosa, como aquellos con mayor capacidad discriminativa. La cla-sificación correcta de los pacientes varió de 89.8% (cuidados semintesivos) a 95.6% (cui-dados intensivos).
INTRODUCTION
The patient classification system (PCS) consists in the identification of the patients’ individual healthcare neces-sities, grouping them into categories. Since its development in the United States, in the 1960s, its utilization has been internationally acknowledged as being highly important to help in management decision making. This category allows for the identification of the patient’s healthcare profile and the nursing team workload, supporting staff dimensioning and allocation(1), and enhancing discussions in the
negotia-tion process with hospital management. It also makes it possible to monitor productivity, nursing service costs and the quality of the healthcare provided(2-3).
In Brazil, the patient classification system was first ad-dressed in 1972(4), as a concept of Progressive Patient Care
(PPC), i.e. a way of organizing medical and nursing care ac-cording to the degree of the disease and the required care (for example, intensive, intermediate, minimal care, etc).
However, in spite of this study, the PCS only started to be developed in the 1990s in different specialties and employed in hospi-tal institutions(5). Its use was only
recom-mended in 1996, through COFEN Resolution #189/1996(6), which also determined its use
as an exclusive competence of nurses. In 2004, this recommendation was updated, becoming COFEN resolution #293/2004(7).
With the goal of identifying both the pa-tients’ healthcare needs and the nursing staff workload, an instrument(8-9) was developed,
based on individual nursing care needs. In-vestigations were done to evaluate the psy-chometric properties of the instruments, among them content validity by judges(8),
in-ter-rater reliability(10), predictive capacity to determine the
several levels of care(11), construct validity(12) and
compari-son with another international instrument(13). The results
of these studies show that the instrument presented evi-dence of reliability and validity for application in nursing practice.
Since then, the proposed patient classification instru-ment(8-9) has been applied in hospital institutions and
elic-ited scientific investigations(14-16). Both favorable and
unfa-vorable comments have emerged from these studies. The most common criticism is that the instrument would un-derestimate the patient’s real nursing care category. These comments, expressing the personal opinions of some nurses who used the instrument, were based on clinical experi-ence and need to be taken into account. Therefore, it is important to systematically review the structure and
con-This article represents the first stage of the refinement, discussing the opinion of the instrument users regarding simplicity, comprehensiveness, applicability and reliability of the generated data and the most relevant variables (criti-cal indicators) for inter- and intra-categories of care.
OBJECTIVES
•
Investigate the opinions of users of a patient classi-fication instrument;•
Analyze the healthcare indicators that most contrib-ute to the classification of patients in each healthcare cat-egory (minimal, intermediate, semi-intensive and intensive).METHOD
The methodological sequence of this descriptive study occurred in two stages, in consonance with the proposed goals. Data collection happened from September 2006 to May 2007, after receiving approval from the Faculdade de Medicina de São José do Rio Preto Review Board (Protocol n° 3262/2006), the authorization of the nursing management service and consent from the research subjects.
Initially, users of the proposed patient clas-sification instrument were identified, contact-ing them by telephone, e-mail and also through articles about the topic. Twenty-four nurses agreed to participate in the study. A previously-tested questionnaire was used to investigate their opinions, containing semi-structured ques-tions. This instrument was designed in three parts, followed by a brief explanation. The first part, besides information about the institution, personal and professional characteristics, also covered also information related to the use of the instrument at the institution (how long it has been in use, frequency, goals, units); the second part consisted in a 5-point Likert scale con-taining 14 statements. The statements focused on character-istics of the instrument (ease of usage, objectivity), reliability (interpretation, adequacy of the classification and utilization of the generated data) and acceptance. A 5-point score was attributed to the most positive answers and one to the most negative. The last part of the questionnaire allowed the sub-jects to present their considerations about the indicators that compose the instrument.
For the analysis of the healthcare indicators, a minimum statistical sample of 800 patients was defined, with 200 in each category. In total, 796 patients were obtained, with 208 un-dergoing minimal care, 224 intermediate care and 227 inten-sive care. The low number of patients hospitalized in the
semi-In Brazil, the patient classification system was first addressed in 1972, as a concept of Progressive Patient Care (PPC), i.e. a way
of organizing medical and nursing care
Intensive Care units at a private teaching hospital with ex-tra capacity in the state of São Paulo. The choice of units where the instrument was applied related to the diversity of the healthcare complexity, dynamics of the unit and avail-ability of the nurses. Since the investigated hospital does not use classification instruments in its daily practice, each nurse was asked to classify from four to five patients per shift until the sample reached the predetermined size, so as not to overload their activities.
The classification instrument is based on individual nursing healthcare needs, and directed at adult patients. It is composed of 12 critical healthcare indicators: Mental status and Level of Awareness, Oxygenation, Vital Signs, Nutrition and Hydration, Motility, Locomotion, Body Care, Eliminations, Therapy, Health education, Behavior, Communication and Skin integrity. The score for each of the indicators varied from 1 (lowest level of nursing care) to 5 (maximum level of healthcare complexity). The lowest possible score is 13, and the maximum is 65. Through this instrument, the patient could be classified in one of the four healthcare categories: Minimal (13-26 points), Intermediate (27-39 points), Semi-Intensive (40-52 points) and Intensive (53-65 points).
For statistical analysis, Minitab Statistical Software (MINITAB) v. 12.22 and SPSS v. 15.0 were used. The descriptive data are presented in frequencies, percentages, averages and standard deviations. The Likert scale was considered an ordinal measurement level, and the medians and quarters (Q1 and Q3) were calculated. The internal consistency, i.e. the reliability of the instrument was tested by Cronbach’s Alpha coefficient, and Spearman’s two-tailed correlation coefficient, with a significance level of p < 0.05 considered acceptable. The Principal Components Analysis (PCA) and Discriminant Analysis were used to study the behavior of the variables (critical indicators). Subjective data were grouped, categorized and related according to the study goals.
RESULTS
Users’ opinion
The study subjects were female, with an average age of 34.5 ± 14.8 years, (varying from 24 to 56 years old),
work-ing in the professional area for 15.2 ± 16.3 years (varywork-ing from 1 to 29 years). Two were directors of the Nursing ser-vice, 16 were clinical nurses and supervisors, five were pro-fessors and one performed teaching and healthcare activi-ties. Regarding their professional qualification, five held a Doctoral Degree, four a Master’s, twelve a Specialization Degree, one had a Teaching Diploma and two were Regis-tered Nurses, without graduate degrees.
The users applied the instrument in Medical Clinic, Sur-gery and Specialized units in mostly medium-sized, extra ca-pacity public and teaching hospitals in the states of São Paulo, Paraná and Rio Grande do Sul. The main goals for the utiliza-tion of the instruments were: knowing the patient’s health-care profile at the unit and identifying the workload, in or-der to define the staff size. Its usage is periodical, mostly to develop the nurses own research projects or those of stu-dents. Regarding the operational aspects, the average time to classify each patient was around five minutes.
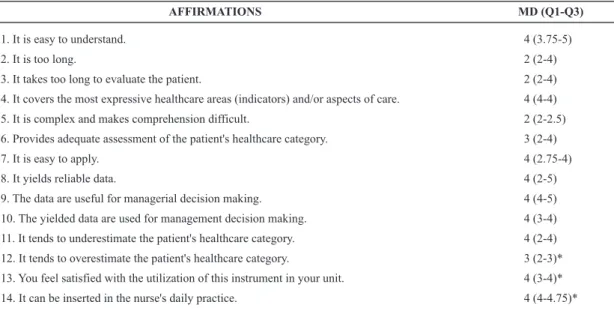
The users’ opinions are presented in Table 1. The state-ments about the instrument characteristics, such as being too long (affirmative 2), needing too much time for assess-ment (affirmative 3) and being difficult to understand (af-firmative 5) had medians of 2, showing the lowest level of agreement. The other characteristics (reliability, applica-bility, satisfaction) presented high agreement, with medi-ans of 4, highlighting affirmation 11 regarding the instrument’s tendency to underestimate the healthcare category the patient belongs to.
Analysis of the Healthcare Indicators
796 classifications were performed at the study units. The average age of the patients was 56.4 (± 18.4), varying from 14 to 95 years old, with a predominance of male pa-tients (59.4%). The instrument’s internal reliability resulted
in a Cronbach’s Alpha of 0.94. Spearman’s correlation (rs) was used to determine the association between the health-care indicators (inter-item) of the instrument. The (rs) coef-ficient varied from 0.08 to 0.87. Skin Integrity showed as-sociation values with the other indicators, varying from 0.08 to 0.25 (Table 2).
Indicators 1 2 3 4 5 6 7 8 9 10 11 12
M. State
Oxygenation 0.76*
Vital Signs 0.54* 0.69*
Nut/Hydrat 0.74* 0.7 1* 0.55*
Motility 0.73* 0.72* 0.54* 0.76*
Locomotion 0.63* 0.65* 0.51* 0.70* 0.80*
Body Care 0.63* 0.64* 0.55* 0.70* 0.79* 0.90*
Eliminations 0.65* 0.66* 0.53* 0.71* 0.78* 0.75* 0.78*
Therapy 0.43* 0.51* 0.56* 0.44* 0.39* 0.38* 0.38* 0.39*
Health Ed. 0.50* 0.44* 0.31* 0.51* 0.48* 0.47* 0.45* 0.44* 0.26*
Behavior 0.77* 0.68* 0.47* 0.64* 0.67* 0.56* 0.56* 0.59* 0.42* 0.52*
Communic. 0.87* 0.74* 0.47* 0.75* 0.74* 0.65* 0.64* 0.66* 0.39* 0.49* 0.77*
Skin Int 0.18* 0.17* 0.08 0.25* 0.25* 0.24* 0.22* 0.25* 0.15* 0.20* 0.19* 0.20*
Table 2 – Inter-item correlation coefficient of the instrument - São José do Rio Preto - 2006
Table 1 – Users’ opinion about the classification instrument - São José do Rio Preto – 2006
Score varies from 1 to 5; the higher the score, the higher the agreement; * Lost data Note: (N=24): Median and Quarters (Q1, Q3).
1. It is easy to understand.
2. It is too long.
3. It takes too long to evaluate the patient.
4. It covers the most expressive healthcare areas (indicators) and/or aspects of care.
5. It is complex and makes comprehension difficult.
6. Provides adequate assessment of the patient's healthcare category.
7. It is easy to apply.
8. It yields reliable data.
9. The data are useful for managerial decision making.
10. The yielded data are used for management decision making.
11. It tends to underestimate the patient's healthcare category.
12. It tends to overestimate the patient's healthcare category.
13. You feel satisfied with the utilization of this instrument in your unit.
14. It can be inserted in the nurse's daily practice.
4 (3.75-5)
2 (2-4)
2 (2-4)
4 (4-4)
2 (2-2.5)
3 (2-4)
4 (2.75-4)
4 (2-5)
4 (4-5)
4 (3-4)
4 (2-4)
3 (2-3)*
4 (3-4)*
4 (4-4.75)*
Variables Minimal Care (n=208) Md(Q1,Q3) M (SD) Semi-Intensive care (n=137) Md (Q1,Q3) M (SD) M. State Oxygenation Vital Signs Nut/Hydrat Motility Locomotion Body Care Eliminations Therapy Health Ed. Behavior Communic Skin Int. Intermediate care (n=224) Md(Q1,Q3) M (SD) Intensive care (n=227) Md(Q1,Q3) M (SD) 1(1.1) 1(1.1) 1(1.1) 1(1.2) 1(1.1) 1(1.2) 1(1.2) 1(1.2) 1(1.3) 1(1.1) 1(1.1) 1(1.1) 1(1.1) 1.1(0.3) 1.1(0.3) 1.3(0.7) 1.4(0.7) 1.2(0.5) 1.7(0.9) 1.7(1.0) 1.5(0.9) 2.4(1.2) 1.2 (0.5) 1.4(0.7) 1.1(0.5) 1.6 (0.9) 1(1.2) 1(1.2) 2(1.3) 3(2.3) 3(2.4) 4(3.5) 4(3.5) 4(3.5) 3(2.3) 2(1.2) 2(1.2) 1(1.2) 2(1.3) 1.5(0.9) 1.5(0.7) 2.0(0.9) 2.6(1.0) 2.9(1.1) 4.0(1.1) 4.0(0.9) 3.7(1.1) 2.8(0.8) 1.8(1.0) 1.8(0.9) 1.7(1.1) 2.1(1.1) 4(2.4) 2(2.3) 2(1.3) 4(4.4) 5(4.5) 5(5.5) 5(5.5) 5(4.5) 3(2.3) 3(2.5) 4(2.5) 4(3;4.5) 2(1.5;4) 3.2(1.3) 2.6(1.2) 2.1(1.0) 3.9(0.7) 4.3(0.9) 4.9(0.5) 4.8(0.4) 4.5(0.6) 3.0(1.1) 3.1(1.5) 3.4(1.4) 3.7(1.2) 2.6(1.3) 5(5.5) 5(5.5) 4(3.5) 5(4.5) 5(5.5) 5(5.5) 5(5.5) 5(5.5) 5(4.5) 5(2.5) 5(5.5) 5(5.5) 2(1.3) 3.2(1.3) 2.6(1.2) 2.1(1.0) 3.9(0.7) 4.3(0.9) 4.9(0.5) 4,8(0.4) 4.5(0.6) 3.0(1.1) 3.1(1.5) 3.4(1.4) 3.7(1.2) 2.6(1.3)
Table 3 – Variation of the gradation found in the healthcare indicators in the different healthcare categories, averages and standard deviation - São José do Rio Preto - 2006
Note: Median and Q1 and Q3 (n= 796)
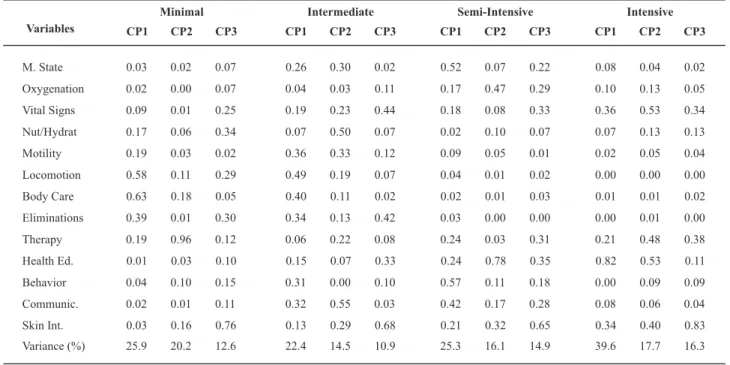
The Principal Components Analysis was used to study the correlation between each intra-group variable (health-care indicator) (Table 4). In the analysis below, only the three factors in each healthcare category were considered, which explained 58.7% (minimal care), 47.8% (intermediate care), 56.3% (semi-intensive care) and 73.6% (intensive care) of total data variation. The other factors will not be explored since they have a lower explanatory capacity.
The degree of importance of a variable in the studied factor can be determined by multiplying the maximum ob-tained value in one of the factor variables by 0.7. Since the factorial weights presented a significant dispersion among the factors in the different healthcare categories, it was dif-ficult to determine the most relevant healthcare indicators with the highest discriminatory capacity. Therefore, after consulting a statistician, a choice was made to multiply the indicator’s factorial weight by the explanation percentage
of the factor (variance). For example, in the minimal care category, the Therapy indicator presented a factorial weight of 0.956 for factor 1 (CP1). Multiplying this value by the explanation percentage of the respective factor (20.2%) yields the value 19.31. When significant values of the health-care indicators appeared in several factors in the same healthcare category, they were added up. The sorting of the values obtained in each category, then, allowed for the identification of the healthcare indicators with higher dis-criminatory capacity, in order of importance. 1. Minimal care –Therapy (25.7), Body Care (20.7), Locomotion (20.6) Indicators; Intermediate care – Body care (25.8), Commu-nication (15.4), Skin Integrity (14.3), Locomotion (14.3), Motility (14.1), Eliminations (13.9), Vital Signs (12.4);
Semi-Intensive Care – Health Education (23.7), Skin Integrity
(20.0), Behavior (18.8), Mental State and Level of Aware-ness (17.7), Communication (17.4) and Oxygenation (16.2). By studying the gradation variation per healthcare type, it
can be observed that: 1.) In the minimal care category, the indi-cator Therapy presented the highest average score (SD) of 2.4 (1.2); 2. in the intermediate care category, the indicators Loco-motion (4.0 ± 1.1), Body Care (4.0 ± 0.9) and Eliminations (3.7 ±
The discriminant analysis made it possible to verify the adequacy of the patients in their healthcare categories. The results of the analysis showed that, in the studied sample, the percentage of discrimination and the correct classification of the patients in the many healthcare cat-egories varied from 89.1% (semi-intensive care) to 95.6% (intensive care). Considering the score distribution for the categories of minimal care (13-26 points), intermediate (27-39 points), semi-intensive (40-52 points) and inten-sive care (53-65 points), the threshold zone would include the scores immediately above and below the one found in the category interval, and the attention zone would contain values immediately above and below those found in the threshold zone.
Table 4 – Factorial weights of the Principal Components Analysis in the different healthcare categories. São José do Rio Preto - 2006
Variables M. State Oxygenation Vital Signs Nut/Hydrat Motility Locomotion Body Care Eliminations Therapy Health Ed. Behavior Communic. Skin Int. Variance (%) Minimal
CP1 CP2 CP3
0.03 0.02 0.07 0.02 0.09 0.17 0.19 0.58 0.63 0.39 0.19 0.01 0.04 0.02 0.03 25.9 0.00 0.01 0.06 0.03 0.11 0.18 0.01 0.96 0.03 0.10 0.01 0.16 20.2 0.07 0.25 0.34 0.02 0.29 0.05 0.30 0.12 0.10 0.15 0.11 0.76 12.6 Intermediate
CP1 CP2 CP3
0.26 0.30 0.02 0.04 0.19 0.07 0.36 0.49 0.40 0.34 0.06 0.15 0.31 0.32 0.13 22.4 0.03 0.23 0.50 0.33 0.19 0.11 0.13 0.22 0.07 0.00 0.55 0.29 14.5 0.11 0.44 0.07 0.12 0.07 0.02 0.42 0.08 0.33 0.10 0.03 0.68 10.9 Semi-Intensive
CP1 CP2 CP3
0.52 0.07 0.22 0.17 0.18 0.02 0.09 0.04 0.02 0.03 0.24 0.24 0.57 0.42 0.21 25.3 0.47 0.08 0.10 0.05 0.01 0.01 0.00 0.03 0.78 0.11 0.17 0.32 16.1 0.29 0.33 0.07 0.01 0.02 0.03 0.00 0.31 0.35 0.18 0.28 0.65 14.9 Intensive
CP1 CP2 CP3
0.08 0.04 0.02 0.10 0.36 0.07 0.02 0.00 0.01 0.00 0.21 0.82 0.00 0.08 0.34 39.6 0.13 0.53 0.13 0.05 0.00 0.01 0.01 0.48 0.53 0.09 0.06 0.40 17.7 0.05 0.34 0.13 0.04 0.00 0.02 0.00 0.38 0.11 0.09 0.04 0.83 16.3
Therefore, of the 24 incorrect classifications between the intensive and semi-intensive healthcare categories, 11 had scores in threshold zones (52-53 points); eight (33.4%) in the attention zone (51 and 54) and only five (20.8%) had other score values. Among the minimal and intermediate healthcare categories, there were 26 incorrect classifications: in 13 of them (50%), the scores were in threshold zones (26-27); three (11.5%) in the at-tention zone (25 and 28), and ten (38.5%) had other values. Of the 29 incorrect classifications between the intermediate and semi-intermediate healthcare categories, 14 of them (48.3%) had scores in threshold zones (39-40); six (20.7%) classifications had scores in the attention zone (38 and 41), and nine (38.5%) had other values. The number of correct and incorrect classifi-cations, the predicted category and the percentage of correct classifications can be seen in Table 5.
Note: (n=796)
Table 5 – Discriminant analysis of the different healthcare categories in relation to the two first main components - São José do Rio Preto – 2006
DISCUSSION
The greatest challenge of this study was to identify the instrument users, due to the absence of a map with the hospital institutions that use PCSs. Few articles have been published about the theme, using one instrument or an-other, which served as a base for contacting the users. Other nurses and researchers were reached through referrals. Al-though this process took a long time, the sample was still reduced (n=24). Thus, the results found may not fully rep-resent the opinion about the classification instrument.
The investigated users were satisfied with the intrinsic characteristics of the classification instrument (objectivity, application time, extension, practical applicability in their everyday routine). However, authors(17) who analyze the
possibility of implementing PCSs in Intensive Care Units see the utilization of Perroca’s instrument with restrictions, considering it long and difficult to fill out, making it diffi-cult to perform quick decision making at this unit.
The study subjects mentioned a tendency of the instru-ment to underestimate the patient’s healthcare category. At the same time, they agree that the yielded data are reli-able and can be used for management decision making, which seems contradictory. This apparent contradiction may mean that the nurses acknowledge the validity of the in-strument for patient categorization according to healthcare complexity, although they sometimes do not agree with the resulting categorization. A Swedish study(18) also shows that
the nurses are not totally satisfied with the capacity of the instruments used in that country to provide an adequate evaluation of the patient’s healthcare category. The values found were medians varying from 2 to 3, similar to those found in the present study.
The possibility that the instrument does not provide an adequate evaluation of the patient’s healthcare category was one of the factors that motivated the execution of this study. In the construction of the instrument(8), the method
used for the standardization of the scores was the class in-terval, i.e. the total amplitude of 52 (maximum score mi-nus the minimum score) distributed into four categories (classes) with 12-point intervals each. Therefore, the dif-ference among healthcare categories remained constant. The international classification instruments, although pre-senting similar structures and contents(8-9), have different
intervals among the categories.
The Discriminant Analysis result showed that the health-care category with the lowest percentage of correct classi-fication was semi-intensive, i.e. 89.8% when compared with intensive care and 89.1% when compared with intermedi-ate care. Therefore, the lower the reclassification error rintermedi-ates, the more coherent the healthcare categories. High percent-ages of scores in threshold zones were detected in the in-correct classifications – 45.8¨% for intensive/semi-intensive and 48.3% for semi-intensive/intermediate. If we also con-sider the so-called attention zones, those percentages rise
to 79.2% and 69%, respectively. Therefore, the score stan-dardization needs to be reviewed for the new structure of the instrument.
The comparison of the proposed instrument (culturally adapted) with an international instrument(13) showed k
w 0.60
(0.50-0.71; RI 95%), i.e. a moderate level of agreement in the different healthcare categories. Agreement was found between the instruments in the healthcare categories of 51 out of 85 evaluated patients. The minimal and semi-intensive health-care categories showed the highest levels of agreement, and intensive care the lowest. In the 34 mismatches, 26 patients were observed to be in lower categories when evaluated by the proposed instrument, and eight in higher categories, when compared with the international instrument.
These findings corroborate the perception that the in-strument may possibly not depict the patient’s complexity as perceived by some of the nurses. However, in addition to the choice of method to standardize the score, another aspect may be interfering in the adequate evaluation of the patient’s healthcare category. Originally built to deter-mine the patient’s complexity in relation to the nursing practices, the instrument contains only activities performed with the patients or their families, and does not address other activities performed by the nurse that demand time, such as management activities, healthcare coordination, supervision and training the team and students. This means that, in its current format, the nursing team’s workload is measured only partially. Thus, in order to mirror the real workload more accurately, it is necessary to include other factors that also interfere in its measurement.
Another aspect worth noting relates to the inclusion of a companion. It is important for the family member/com-panion to participate and contribute to the recovery of the patient, since they will continue the treatment at home. However, they cannot be forced to take responsibility for healthcare. The responsibility will always lie with the nurse. It is undeniable that their presence influences nursing healthcare time, since they need orientation and supervi-sion by the nurses. The issue raised is to determine to what extent their presence affects the nursing time. The consid-erations above lead to the reflection that building a workload measuring instrument for the nursing team still needs complementary studies to identify the factors that most strongly interfere in its determination.
It is mentioned in literature(19) that the internal
The Principal Components Analysis (PCA) was used to reduce the instrument’s dimensionality, i.e. to identify, the most relevant healthcare indicators (variables) among the 13 used, which characterize each of the healthcare catego-ries. The findings showed a significant dispersion among the factors in different healthcare categories. It was ex-pected that one or another healthcare indicator would di-rect the intra-class classification. However, even after sort-ing the obtained values in each category, the result obtained was a group of healthcare indicators. The Therapy indica-tor presented the highest discriminaindica-tory capacity in the category of minimal care; Body Care for intermediate care and Health Education and Skin Integrity in the semi-inten-sive and intensemi-inten-sive healthcare categories. The Body Care in-dicator had been previously reported in literature(9,20) as the
most important aspect to apprehend the change of care of the instrument as a whole.
CONCLUSION
The investigated users were satisfied with the proposed classification instrument, except for a certain tendency to underestimate the patient’s healthcare category. They sug-gest that it would be more appropriate if the instrument were not limited to patient classification, but also capable of measuring other factors that influence the nursing team’s workload. Undoubtedly, the search for accurate workload measurements remains a great challenge. Other studies need to be performed for the identification of those fac-tors that most affect its measurement.
REFERENCES
1. Gaidzinski RR. O dimensionamento do pessoal de enfermagem segundo a percepção de enfermeiros que vivenciam esta prá-tica [tese]. São Paulo: Escola de Enfermagem, Universidade de São Paulo; 1994.
2. Alward RR. Patient classification systems: the ideal vs. reality. J Nurs Adm. 1983;13(2):14-9.
3. De Groot HA. Patient classification system evaluation. Part 1: Essential system elements. J Nurs Adm. 1989;19(6):30-5.
4. Ribeiro CM. Sistema de classificação de pacientes como subsi-dio para provimento de pessoal de enfermagem [tese]. São Paulo: Escola de Enfermagem, Universidade de São Paulo; 1972.
5. Fugulin FMT, Silva SH, Shimizu HE, Campos FPF. Implantação do sistema de classificação de pacientes na Unidade de Clínica Médica do Hospital Universitário da Universidade de São Pau-lo. Rev Med HU-USP. 1994;4(1/2):63-8.
6. Conselho Nacional de Saúde. Resolução n. 196, de 10 de outubro de 1996. Dispõe sobre diretrizes e normas regulamentadoras de pesquisas envolvendo seres humanos. Bioética. 1996;4(2 Supl): 15-25.
7. Conselho Federal de Enfermagem. Resolução n.293/04. Fixa e estabelece parâmetros para dimensionamento do quadro de profissionais de enfermagem nas unidades assistenciais das ins-tituições de saúde e assemelhados [legislação na Internet]. São Paulo: COREN-SP; 2004. [citado 2007 maio 17). Disponível em: http://corensp.org.br/072005/legislacoes/legislacoes_busca. php?leg_id=10105&texto=293
8. Perroca MG. Sistema de classificação de pacientes: construção e validação de um instrumento [dissertação]. São Paulo:
Esco-9. Perroca MG. Instrumento de Classificação de Pacientes de Perroca: validação clínica [tese]. São Paulo: Escola de Enfer-magem, Universidade de São Paulo; 2000.
10. Perroca MG, Gaidzinski RR. Avaliando a confiabilidade inte-ravaliadores de um instrumento para classificação de pacien-tes: coeficiente Kappa. Rev Esc Enferm USP. 2003;37(1): 72-80.
11. Perroca MG, Gaidzinski RR. Avaliação da capacidade preditiva e formato final de um instrumento para classificação de paci-entes. Acta Paul Enferm. 2003;16(2):56-66.
12. Perroca MG, Gaidzinski RR. Análise da validação de constructo do instrumento de classificação de pacientes proposto por Perroca. Rev Lat Am Enferm. 2004;12(1):83-91.
13. Perroca MG, Ek AC. Assessing patient’s care requirements: a comparison of instruments. Scand J Caring Sci. 2007; 21(3):390-6.
14. Carmona LMP, Évora YDM. Sistema de classificação de paci-entes: aplicação de um instrumento validado. Rev Esc Enferm USP. 2002;36(1):42-9.
15. Alves NRC. Sistema de Classificação de Pacientes (SCP): apli-cação do instrumento de Perroca em um hospital geral [dis-sertação]. São Paulo: Escola de Enfermagem, Universidade de São Paulo; 2002.
17. Tranquitelli AM, Padilha KG. Sistema de classificação de paci-entes como instrumentos de gestão em Unidades de Terapia Intensiva. Rev Esc Enferm USP. 2007;41(1):141-6.
18. Perroca MG, Ek AC. Utilization of patient classification systems in Swedish hospitals and the degree of satisfaction among nursing staff. J Nurs Manag. 2007;15(5):472-80.
19. Nunally JC, Bernstein IH. Psychometric theory. 3rd ed. New York:
McGraw-Hill; 2004.
20. Pavani LMD. Análise do dimensionamento de pessoal de enfer-magem na unidade de pós-operatório de cirurgia cardíaca em um hospital universitário especializado em cardiologia. [dis-sertação]. São Paulo: Escola de Enfermagem, Universidade de São Paulo; 2000.
Acknowledgements
Acknowledgements to the nurses who took part in the research, both the study subjects and the nurses at the Medical Clinic, Surgery and Intensive Care Units who classified the patients, for their collaboration