METHOD FOR MONITORING INTERTIDAL COMMUNITIES IN A STEEP ROCKY
SHORE: A COMBINATION OF DIGITAL IMAGE TECHNOLOGY AND FIELD
OPERATIONAL STRATEGY
1Danuza Nogueira Moysés*, Andréa de Oliveira R. Junqueira, Helena Passeri Lavrado & Sérgio Henrique Gonçalves da Silva
Universidade Federal do Rio de Janeiro
Departamento de Biologia Marinha - Laboratório de Benthos - CCS, Bl. A1-089 (Rua Brigadeiro Trompwski, Ilha do Fundão, 21949-900 Rio de Janeiro, RJ, Brazil)
*E-mail: [email protected]
A
B S T R A C TThis paper introduces a method for temporal studies of steep rocky intertidal communities. It combines the use of digital image technology with field methodology, so that a wide area of the community can be sampled in a short time. Two current nondestructive percent cover estimation methods (visual estimation and point intersection) were compared in terms of cost, operational advantages and data quality, with a proposed method for a sucessional study . The proposed method used sequential photos to sample multiple fixed vertical transects over time. Reproduction of the mid-intertidal transect over time was possible by overlaying temporal transects in an image editing program. This method was similar to the point intersection quadrat method used to estimate percent cover. Benefits included reduced time on field work, economic advantages and other advantages of using digital photography, such as recording. Temporal photography of transects provided measurements of recruitment, mortality and population growth, and made it possible to manufacture an animation of sucessional stages. We suggest that this is the best method for providing information and understanding on the process of succession and for monitoring benthic invertebrate intertidal communities on steep rocky shores.
R
E S U M OEste trabalho apresenta uma metodologia para estudos temporais de comunidades entre-marés de costões rochosos com acentuada inclinação, associando tecnologia de captura de imagens digitais com uma estrutura operacional de campo, permitindo a amostragem de ampla faixa da comunidade, em pouco tempo. Dois métodos tradicionais de estimativa de porcentagem de cobertura (estimativa visual e pontos de interseção) foram usados para comparar a aplicabilidade do método proposto a um estudo de sucessão, quanto às vantagens econômicas, operacionais e qualidade dos dados obtidos. O método permite a amostragem temporal de múltiplos transectos verticais específicos, por meio de fotos seqüenciais. As mesmas são fundamentais para a posterior montagem da imagem do transecto num programa de edição de imagem através da compilação das fotos e sobreposição temporal dos transectos. Este método obteve resultados similares ao método de pontos de interseção quanto às leituras de porcentagem de cobertura, além de reduzido tempo em campo, vantagens econômicas e vantagens do uso das fotografias digitais. A análise das transições temporais permitiu a obtenção de parâmetros como recrutamento, mortalidade e crescimento populacional, além da montagem de uma animação com a sucessão. Consideramos esta metodologia a mais indicada para estudos de sucessão ecológica, especialmente no monitoramento de comunidades de invertebrados bentônicos do médiolitoral, em costões de inclinação acentuada.
Descriptors: Methods, Digital photography, Intertidal Zone, Rocky shore, Benthos.
Descritores:
I
NTRODUCTIONIntertidal rocky shore communities have long been studied to explain patterns in ecology using theoretical models [such as the keystone concept
__________
(1) Paper presented at the 1st Brazilian Congress of Marine Biology, on 15-19 May, 2006. Rio de Janeiro, Brazil.
hypothesis (Connell, 1978)]. Although these marine communities are easily accessible at low tide, on steep continuous rocky shores they are more difficult to sample, so information on them is relatively reduced.
The coast of Rio de Janeiro is characterized by steep continuous rocky shores, making monitoring and long term studies (such as successional, recruitment studies and manipulative in situ experiments) difficult. Studies on these shores are usually restricted in time and space, due to limited time of exposure during low tide, small tidal range (less than 1.2 m) and harsh conditions (increased sampling time required).
The aim of this paper is to describe a method for monitoring intertidal communities on steep rocky shores by combining digital image technology with field methodology to improve data acquisition, storage and analysis. This work is part of a long term study of the effect of the substratum heterogeneity on recruitment and succession on a steep rocky shore colonized by two introduced species. The method was applied to this study to investigate if it enables population parameters estimations such as recruitment, mortality, distribution, number of individuals and percent cover.
The method developed for this purpose was compared on economic and operational advantages
with two current nondestructive percent cover estimation methods, visual estimation and point intersection (Sutherland, 1974). An evaluation was made whether there was a correlation in percent cover estimation by the three methods.
Visual estimation allows fast data acquisition, but with great variability among observers. Point intersect estimation of percent cover, while being more precise in the estimation, is limited by the time available during sampling at low tide. This limitation leads to a decrease of precision by reducing the number of samples or intersections used (Sabino & Villaça, 1999; Meese & Tomich, 1992). Photographic methods take little time per sample, allowing multiple samples that lead to a more precise abundance estimation and yield a permanent record that can be later achieved (Murray et al., 2006).
Study Area
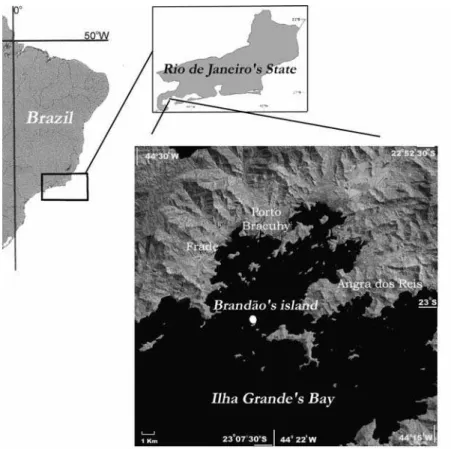
The study took place in Brandão Island at Ilha Grande’s Bay, on south coast of Rio de Janeiro State, Brazil (23º01.5' S; 44º 24' W) (Fig.1).
The methods were tested in the mid-intertidal zone moderately exposed and on steep continuous rocky shore (33˚), only accessible by boat. The mid-intertidal zone is 1m long, colonized by the sessile gastropod Petaloconchus sp dominating 50% of the zone), the bivalves Isognomon bicolor and Brachidontes solisianus, and the barnacles Tetraclita stalactifera, Chthamalus bisinuatus and Chthamalus proteus.
M
ATERIAL ANDM
ETHODSThe method was developed for the use of digital photography in the collection of data. A special acrylic box was designed to fit the camera and necessary adaptations were performed in situ for the mounting of the monitoring structure on the rocky shore (details below).
Equipment:
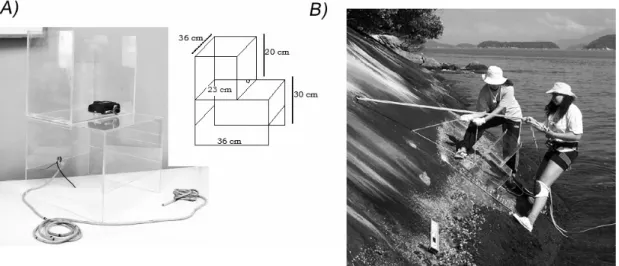
Data were collected with a Kodak model DX3900 digital camera, 3.1 Megapixel resolution. An acrylic glass box, divided into two parts (Fig. 2a), was designed to enable sequential, same sized and same distanced pictures of each sample area.
To capture images, the camera was centrally fixed on the upper case inside (Fig. 2a). The fixed distance to the subjects sampled a 24 cm x 32 cm area per picture.
A cable with markings every 20 cm was connected to the acrylic box. It was used to lower the box on the shore, marking the distance between the photographed spots, in such a way which resulted in a continuous image of the whole length of the transect area, by later assembling the sequential pictures. The cable also served to hold the acrylic box on the shore, supported by a bolt.
Field transects:
Bolts were fixed to the rocky shore by using cables attached to them (Fig. 2b) so as to provide safety for both the box and the researchers, The box was designed to run on steel tracks bolted to the rocky shore. A measuring tape hanged parallel to the tracks was used as a scale reference.
The proposed method was applied to a successional study involving manipulative experiments. An example of results obtained in this study was used to illustrate the data collection and analysis that can be performed but further results will not be presented in this paper. From March 2003 through September 2004, the substratum was sampled monthly to record species amount of individuals and percent cover in the intertidal zone of the rocky shore. Twelve transects were monitored. In three of them, natural community was kept and the others were scraped clean and underwent three treatments: 1) scraped transects, 2) artificial barnacle in a regular distribution and 3) depressions (1cm wide holes also regularly distributed).
Each transect corresponded to a vertical line of approximately 40 cm by 100 cm of the mid-intertidal zone. Five to six sequential pictures of each transect were taken monthly. The edge of each picture matches with the edge of the next one. These overlaying areas are essential for later assembling of the pictures.
The incursions were realized at low tides when the entire area was exposed. The work took a maximum of two hours (one hour prior and one after the peak of the low tide); then, part of the transect areas were underwater. Samples of organisms were collected for further taxonomic identification and correlation with the photo images.
Data analysis:
The data analysis was made at the Benthos Laboratory (IB-UFRJ), with the help of the Photoshop 6.0 image editing software. This allowed the magnifying of the pictures apart from other features as the possibility of measuring the organisms and overlay of pictures. A grid of 20 x 20 cm, divided into 1 cm2 subquadrats, was generated with this software and used for the percent cover estimation by the filling of these subquadrats. Pictures of sequential months were also overlaid with this software.
For the monitoring, a transposition was made of the distribution of the main invertebrates to tracing paper over a square patterned base, representing, in a smaller scale, the whole transect area. It was used to measure recruitment, population growth and mortality, by counting new settled specimens, alive and dead (or disappeared specimens), respectively.
For the ecological succession and growth studies and also for presentations, the pictures were overlaid and an animation was produced in Microsoft Office PowerPoint software (simply by fast transition of slides). Individual growth visualized in this animation could be measured with a ruler tool of the image editing software.
Comparison of methods:
The methods used for comparison were: visual estimation, intersection points and proposed method (with digital images).
Field work was realized in June 2004, with 8 replicates for each method. For all methods, the time spent was recorded as was well as the percent cover of each species per quadrat.
The cover of benthic organisms was estimated first by a visual scan method, second by intersection point method and third by the proposed
method. The visual percent cover estimation was obtained with a quadrat of 400 cm2, subdivided in 4 quadrants. Percent cover estimation with point intersection method used a 400 cm2 quadrat with 100 intersections, considering the organism under each intersection (equal 1%). The proposed method also used a 400 cm2 quadrat photographed and analyzed with a digital grid (already cited) by the amount of filling 1 cm2 subquadrats (full, 0.25% or half-full, 0.13%).
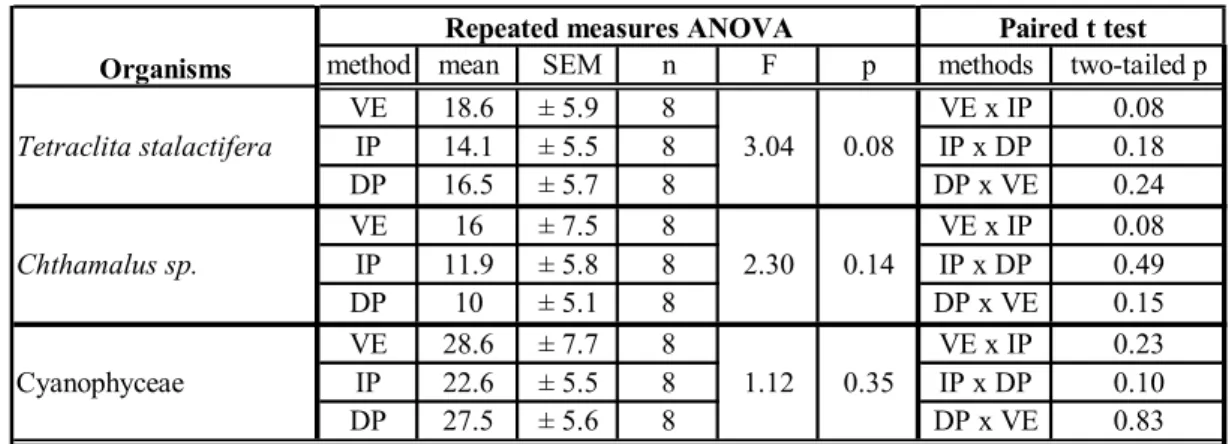
Pearson’s correlation between the percent cover of species in the three methods was compared in pairs. Tetraclita stalactifera, Chthamalus sp. and Cyanophycea percent cover estimated by the tree methods was analyzed using repeated measures ANOVA and paired t test (two-tailed).These were the organisms that were present in all samples (n=8).
R
ESULTSMethod Applicability
The digital camera used in this study, in combination with the field structure, allowed to obtain a temporal series of high quality image records. These images can be enlarged up to 3 times without losing details. The magnification of the images was especially useful in recruitment quantification and measurement, leading to identification of recruits of less than 3 mm.
The use of the proposed method for the sucessional study allowed the sampling of a large area of the benthic community, twelve transects of 1600 cm2, covering the whole vertical mid-intertidal zone. Transect images were successfully overlaid on laboratory analysis.
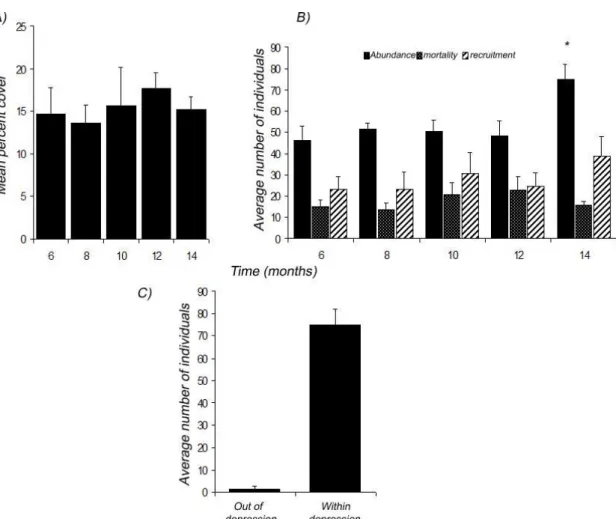
The method proved to be adequate for population studies, being able to provide all the parameters required, like population growth, mortality, recruitment, distribution and coverage (Fig. 3).
Fig. 3. Example of data obtained with the proposed method for Isognomon bicolor: a) Percent cover estimation in depression treatment from the 6th to the 14th month (n=3); b) Abundance, mortality and recruitment in depression treatment from the 6th to the 14th month (n=3); c) Distribution within depression treatment (n=3) (± SE). 1600 cm2 area.
Sometimes, it was impossible to recognize the organism through photo analysis. This has occurred when algae growth covered part of the target sessile organism. Yet, even so, the temporal series of data helped the analyses, improving the recognition of some benthic sessile organisms by comparing to the previous or succeeding images (Fig. 4).
The transparent box reduced the shadows, increasing image quality, and adjustments in soft shadows could still be done with the image editing software.
The transposition of the main invertebrates distribution to tracing paper over a square patterned base, made it easier to monitoring the individual positions, growth, quantification and visualization, by segregating the organisms which make the image more confuse (e.g. the algae group).
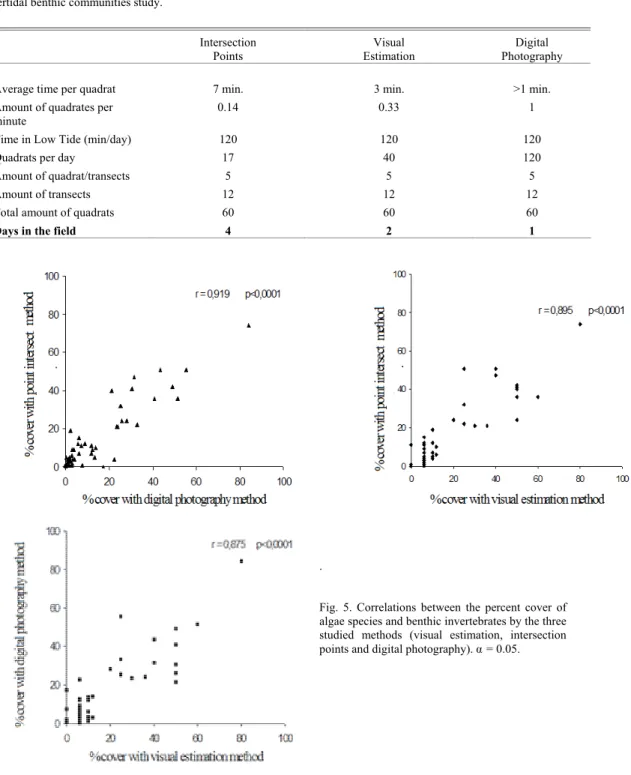
Comparison of percent cover
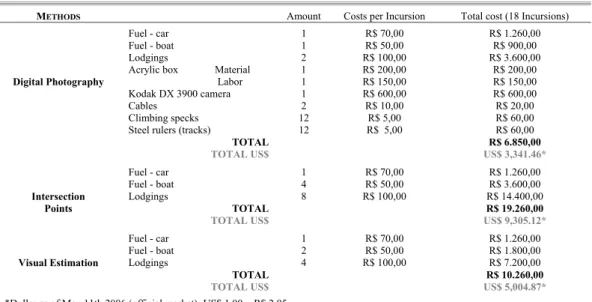
Comparing field time consuming activities and related costs, if the same project had been performed using any of the two traditional methods, besides the harder field work it would bring a considerable raise of the project costs (Table 1).
Fig. 4. Sequence of successional stages from the same spot, by image overlaying; a) 7 months of succession; b) 8 months; c) 9 months and d) 5 months later (14 month succession). Example of depression treatment, holes marked with white circles.
Tetraclita stalactifera (▲) and Isognomon bicolor (♦)identified.
Table 1. Comparison among the developing costs of the three methods for the 18 months intertidal benthic community successional study.
METHODS Amount Costs per Incursion Total cost (18 Incursions)
Fuel - car 1 R$ 70,00 R$ 1.260,00
Fuel - boat 1 R$ 50,00 R$ 900,00
Lodgings 2 R$ 100,00 R$ 3.600,00
Acrylic box Material 1 R$ 200,00 R$ 200,00
Digital Photography Labor 1 R$ 150,00 R$ 150,00
Kodak DX 3900 camera 1 R$ 600,00 R$ 600,00
Cables 2 R$ 10,00 R$ 20,00
Climbing specks 12 R$ 5,00 R$ 60,00
Steel rulers (tracks) 12 R$ 5,00 R$ 60,00
TOTAL R$ 6.850,00
TOTAL US$ US$ 3,341.46*
Fuel - car 1 R$ 70,00 R$ 1.260,00
Fuel - boat 4 R$ 50,00 R$ 3.600,00
Intersection Lodgings 8 R$ 100,00 R$ 14.400,00
Points TOTAL R$ 19.260,00
TOTAL US$ US$ 9,305.12*
Fuel - car 1 R$ 70,00 R$ 1.260,00
Fuel - boat 2 R$ 50,00 R$ 1.800,00
Visual Estimation Lodgings 4 R$ 100,00 R$ 7.200,00
TOTAL R$ 10.260,00
TOTAL US$ US$ 5,004.87*
When comparing the methods tested in this study, the intersection point method took a longer time in the field for the readings of the quadrats, followed by the visual estimation method (Table 2). However, in the laboratory analyses, obtaining the percent cover of the species from pictures took 13 min in average per
square. This higher time consuming rate was associated with a more careful analysis, which enabled the estimation of percent cover and number of individuals of species with less than 0.5% cover or even the presence of only 1 specimen.
Table 2. Comparison among time periods required for the field sampling of percent cover from species for the three methods of intertidal benthic communities study.
Intersection Points
Visual Estimation
Digital Photography
Average time per quadrat 7 min. 3 min. >1 min.
Amount of quadrates per minute
0.14 0.33 1
Time in Low Tide (min/day) 120 120 120
Quadrats per day 17 40 120
Amount of quadrat/transects 5 5 5
Amount of transects 12 12 12
Total amount of quadrats 60 60 60
Days in the field 4 2 1
.
Table 3. Repeated measures ANOVA and paired t test (two-tailed) analysis for Tetraclita stalactifera, Chthamalus sp. and Cyanophycea. Comparison of percent cover estimations by the three methods. = 0.05.
D
ISCUSSIONEcological investigations always seek for higher precision, speed and accuracy whenever possible, but researchers are always limited by time and costs, and a balance between both must be achieved (Andrew & Mapstone, 1987).
Although there were high initial costs of the project at the implementation of the presented method, the decreased time spent in the field is compensated in temporal studies by the low total cost (Tables 1; 2). The advantage of spending less time in the field is fundamental to enable the study of a wider area and increase in number of treatments and replicates.
The photography is limited by the angles that can be observed. The in situ readings allow the observing of various layers of the sampled area, with the possibility of moving the organisms from the upper layer. The intersection point method that reads just the first monolayer has a similar deficiency, despite being able to see from different angles.
The method using photography was more precise than the two others studied, because it allows a more careful analysis not limited by unsuitable field conditions, using a better subdivision of the quadrats. However, problems with the quality of pictures taken, such as over exposure or the existence of similar morphological organisms, can reduce the accuracy of the method.
The accuracy of the method suggested can also fluctuate depending on the degree of the samples structural complexity (Foster et al., 1991). However, for the study of species recruitment and ecological succession, to which it was conceived, it presented higher fidelity with the field observations, given the
low complexity of the community at early stages of ecological succession.
At the first stages of ecological succession, pioneering species can colonize substrate in an aggregated way and in low cover, as observed for Isognomon bicolor (Fig. 3). On the other hand, some of these species have a fundamental role in the process, being responsible for the facilitation or inhibition of other species colonization (Connell & Slatyer, 1977; Odum, 1983). The intersection point method, because it is not so effective for the sampling of rare species (Dethier et al., 1993) overestimates (when occurring at the intersections) or more often underestimates the rare species (when not occurring at the intersection), being inadequate for the study of succession processes..
The method presented here has shown itself to be very efficient for the intertidal community studies. Pech et al. (2004) have already discussed the advantages of digital photography and the importance of aggregating technological advances to improve data acquisition in marine ecology. In this regard, we considered the continuous upgrade of the method described, by using better resolution cameras and adapting the acrylic box to suit cameras in underwater housings. Its application is more adequate to studies that focus on benthic invertebrates, given its limitation for the species identification of algae turfs.
C
ONCLUSIONThe method studied optimized the gathering of data in the field, allowing to observe a wider area during the short time of low tide, without losing the necessary accuracy that brings credibility to the results obtained.
method mean SEM n F p methods two-tailed p
VE 18.6 ± 5.9 8 VE x IP 0.08
Tetraclita stalactifera IP 14.1 ± 5.5 8 3.04 0.08 IP x DP 0.18
DP 16.5 ± 5.7 8 DP x VE 0.24
VE 16 ± 7.5 8 VE x IP 0.08
Chthamalus sp. IP 11.9 ± 5.8 8 2.30 0.14 IP x DP 0.49
DP 10 ± 5.1 8 DP x VE 0.15
VE 28.6 ± 7.7 8 VE x IP 0.23
Cyanophyceae IP 22.6 ± 5.5 8 1.12 0.35 IP x DP 0.10
DP 27.5 ± 5.6 8 DP x VE 0.83
Paired t test
VE= Visual Estimation, PI= Intersection Points and DV= digital photography method
Organisms
Without the limitation of time available in the field work, data can be better analyzed, exposing a series of relevant information.
A
CKNOWLEDGEMENTSWe would like to thank Benthos Laboratory Team (UFRJ) for field work assistance. This research was supported by CNPq and Capes, being part of a M.Sc. graduate work of the first author, from Programa de Pós-graduação em Ecologia (PPGE/UFRJ).
R
EFERENCESAndrew, N. L. & MAPSTONE, B. D. 1987. Sampling and description of spatial pattern in marine ecology. Oceanogr. mar. Biol. a. Rev., 25:39-90.
Carlton, J. T. 1996. Biological invasions and cryptogenic species. Ecology, 77(6):1653-1655.
Connell, J. H. & Slatyer, R. O. 1977. Mechanisms of succession in natural communities and their role in community stability and organization. Am. Naturalist., 111:1119-1144.
Connell, J. H. 1978. Diversity in tropical rain forests and coral reefs. Science, 199: 1302-1310.
Dethier, M. N.; Graham, E. S.; Cohen, S. & Tear, L. M. 1993. Visual versus random-point percent cover estimations: “objective” is not always better. Mar. Ecol. Prog. Ser., 96:93-100.
Foster, M. S.; Harrold, C. & Hardin, D. D. 1991. Point vs. photo quadrat estimates of the cover of sessile marine organisms. J. expl mar. Biol. Ecol., 146:193-203.
Meese, R. J. & Tomich, P. A. 1992. Dots on the rocks: a comparison of percent cover estimation methods. J. expl mar. Biol. Ecol., 165:59-73.
Murray, S. N.; Ambrose, R. F. & Dethier, M. N. 2006. Monitoring rocky shores. Berkely: University of California Press. 220 p.
Odum, E. P. 1983. Ecologia. Rio de Janeiro: Guanabara. 434 p.
Paine, R. T. 1966. Food web complexity and species diversity: Am. Naturalist, 100:65-75.
Pech, D.; Condal, A. R.; Bourget, B. & Ardisson, P. L. 2004. Abundance estimation of rocky shore invertebrates at small spatial scale by high resolution digital photography and digital image analysis. J. expl mar. Biol. Ecol., 299:185-199.
Ruiz, G. M.; Fofonoff, P. W.; Carlton, J. T.; Wonham, M. J. & Hines, A. H. 2000. Invasion of coastal marine communities in North America: apparent patterns, processes, and biases. A. Rev. Ecol. Syst., 31:481-531. Sabino, C. M. & Villaça, R. 1999. Estudo comparativo de
métodos de amostragem de comunidades de costão. Rev. bras. Biol., 59(3):407-419.
Sutherland, J. 1974. Multiple stable points in natural communities. Am. Naturalist., 108:858-873.