On the Interaction of Bovine Serum Albumin (BSA) with Cethyltrimethyl
Ammonium Chloride Surfactant: Electron Paramagnetic Resonance (EPR) Study
Marcel Tabak1, Di´ogenes de Sousa Neto1,2, and Carlos Ernesto Garrido Salmon1,2
1 Instituto de Qu´ımica de S˜ao Carlos, Universidade de S˜ao Paulo,
Cx. Postal 780, CEP 13560-970, S˜ao Carlos, SP, Brazil and
2 Instituto de F´ısica de S˜ao Carlos, Universidade de S˜ao Paulo,
Cx. Postal 66318, CEP 05315-970, S˜ao Carlos, SP, Brazil
Received on 1st August, 2005; accepted on 31 October, 2005
Electron paramagnetic resonance (EPR) has been used to monitor the interaction of bovine serum albumin (BSA) with cationic cethyltrimethylammonium chloride (CTAC) at pH 7.0. EPR results using 5-DSA and 16-DSA nitroxide spin labels show that in the presence of BSA the EPR spectra are composed of two label populations, one contacting the protein and a second one due to label localization in the micelles. Evidence is also obtained for a competition of the surfactants with the spin labels for the high affinity binding sites of the stearic acid spin labels as monitored by changes in the fraction of the two label populations as the surfactant concentration is increased. The effect of sodium dodecylsulfate (SDS) reported previously seems to be stronger in the sense that increase in SDS concentration leads to a complete transfer of spin label from close protein contact sites to the micelles while for CTAC, apparently, a significant immobilization of probe remains even at higher surfactant concentrations. EPR gives information on the dynamics inside the protein-surfactant aggre-gates and associated to label localization and motion. The dynamics of the nitroxide spin-labels bound to the protein correlate to the stronger binding of SDS to BSA as compared to CTAC binding. Simulation of EPR spectra for spin labels in pure CTAC micelles, in pure protein or in protein-bound micelles show rotational cor-relation times similar to those obtained from the simple evaluation based on the intensities of nitrogen hyperfine coupling components. Rotational correlation times obtained for 5-DSA bound to protein are larger as compared to 16-DSA values suggesting greater mobility for the later even when bound to the protein.
Keywords: EPR; Bovine serum
I. INTRODUCTION
Serum albumin consists of a globular protein synthesized by the liver in mammals, corresponding to the most abundant protein in serum, accounting for 60 % of the total globular protein in blood plasma [1-4]. It is associated to the binding and transport of several small molecules such as fatty acids, dyes, metals, amino acids, drugs, as well as several pharma-ceutical compounds [1-5]. Bovine serum albumin (BSA) is a very interesting biophysical and biochemical system and has been quite studied over the last 40 years. Its primary struc-ture is very well known consisting of 585 amino acid residues, whereas its secondary structure contains 67 % of alpha helix and 17 disulfide bridges that confer to the protein a remark-able stability [1,3].
The interaction of globular proteins, especially BSA, with surfactants, in particular sodium dodecyl sulfate, SDS, has been extensively studied aiming to understand how surfac-tant binding affects the protein structure and function [6]. Two interesting ranges of surfactant concentrations associ-ated to different effects on the interaction with the protein are worthy of mention: the first one, at stoichiometric sur-factant concentration, is related to the binding that occurs to specific high energy sites on the protein, being the interac-tions, in general, of electrostatic nature; the second one is related to higher surfactant concentrations, above the criti-cal micellar concentration (cmc), where a massive increase in binding due to cooperative ligand interactions takes place [7-9]. The protein denaturation is believed to occur at these
concentrations. Several techniques have been used to investi-gate the assembled protein-surfactant complexes: UV-Vis ab-sorption [10], fluorescence and circular dichroism [7,10-13], small angle neutron scattering (SANS) [14,15], small angle x-ray scattering (SAXS) [16,17,18], light scattering [19,20], cryogenic-transmission electron microscopy and2H NMR re-laxation rates [21,22] and other physicochemical techniques such as tensiometric and viscosimetric measurements [23], isothermal titration calorimetry and FTIR [24] and differential scanning calorimetry [25]. At high surfactant concentrations a variety of models have been proposed, being the “pearl neck-lace” model the most discussed in literature [7-9]. In such a model, the polypeptide chain forms the string of the necklace and micelle-like aggregates are randomly wrapped along the unfolded protein polypeptide chain [7-10,14,15].
Further, a systematic study focusing on the interaction of SDS with BSA at pH 5.4, near its isolectric point, was per-formed by SAXS and surface tension measurements [16] showing that below the critical aggregation concentration (cac) of 2.2 mM, the protein conformation remains unaltered. However, at 5 mM SDS both the protein radius of gyration and maximum dimension increase, reflecting the beginning of BSA unfolding process. Moreover, surfactant concentrations higher than 10 mM lead to the formation of micelle-like ag-gregates, and the modeling of SAXS curves is consistent with the “pearl necklace” model. The micelle-like aggregates are randomly distributed along the chain and grow in size, chang-ing from sphere-like shape at 10 mM SDS to spheroid-like form (ν= 1.3, the longest to the shortest axes ratio) at 50 mM SDS. Above 50 mM, the micelles stop growing, remaining in a prolate ellipsoidal shape. Another interesting result is as-sociated to the fact that the size of the SDS micelles in the complex is always smaller than that observed for free-SDS micelles in solution at same surfactant concentration [13-15]. Our SAXS studies of interaction of SDS, HPS and CTAC with BSA at pH 7.0 [18] have shown that the protein radius of gy-ration for 5 mM SDS or HPS does not change significantly as compared to the pure protein while for 5 mM CTAC an increase of radius of gyration takes place. Furthermore, the formation of micelles at higher CTAC concentrations was not as clear as for SDS or HPS.
The aim of our current work is to get more insights, by making use of electron paramagnetic resonance (EPR) tech-niques, on the changes produced in the BSA structure upon interaction with cationic CTAC. EPR spectroscopy with ni-troxides reports on surfactants assembling in the presence of the protein allowing a comparison of the dynamic properties of pure and protein-associated micelle-like aggregates.
II. MATERIALS AND METHODS
A. EPR experiments
A Varian E-9 spectrometer operating at X-band (9.4 GHz) was utilized in our investigations. The spectral parameters were as follows: microwave power, 20 mW; modulation fre-quency, 100 KHz; modulation amplitude, 0.5-1.6 G; magnetic field scan, 100-160 G. Room temperature of 24oC was used.
Spin-labeled derivatives of stearic acids, 5- and 16-doxyl stearic acids (5-DSA and 16-DSA, respectively), were pur-chased from Aldrich Chem. Co. (Milwaukee, WI, U.S.A.). These spin labels have a nitroxide radical ring attached at C-5 and C-16 positions of the acyl chain, respectively. A small aliquot of stock spin label dissolved in ethanol (5 mg.ml−1) was placed in an eppendorf tube and the solvent was evapo-rated under a stream of nitrogen gas. Samples containing 0.15 mM of BSA in phosphate buffer 20 mM pH 7.0 and the ap-propriate amount of surfactant were added directly to the spin label thin film. The surfactants were introduced by dilution of a stock solution into the protein solution. The concentra-tion of spin labels was estimated to be 0.1 mM and the final concentration of BSA was of 0.15 mM. After labeling under
gentle stirring, the samples were introduced into a capillary tube for EPR measurements.
B. EPR analysis
Rotational correlation times τ2C and τ2B were estimated from the heights of the spectral lines corresponding to nitro-gen hyperfine interaction MI= +1, 0, -1, and the linewidth of the central line∆H0, as described in references [28,29]. This estimate was performed for the nitroxides in pure micelles and in some few cases in the presence of protein where a single component was present in the experimental spectrum. The va-lidity of this procedure is restricted to the fast motional regime of the nitroxide for rotational correlation times smaller than around 1 ns. For strongly immobilized radicals observed in pure protein, spectral simulation was performed to obtain the values of R−bar1 associated to the diffusion tensor as described in [18]. Simulation of spectra was also performed for a few cases of pure micelles of CTAC.
EPR spectra simulations were performed by nonlinear least-squares (NLLS) fits, using the general slow-motional program [30,31]. The magnetic g and A tensors, are defined in a molecule-fixed frame, where the rotational diffusion rates around the x, y and z-axis are included [31]. By convention, the x-axis points along the N-O bond, the z-axis is parallel to the 2pz axis of the nitrogen atom, and the y-axis is perpendic-ular to x and z [28,30]. The fitting program NLLS permits to estimate the rotational motion around the axes x, y, and z (the diffusion tensor R) for a single or multi-component EPR spec-tra. However, in order to reduce the number of free parameters and to simplify the simulation, we assume in some cases, as described in reference [18], an axially symmetric rotational diffusion tensor with Rbar = (R2⊥ ·R//)1/3and a rotational anisotropy with R//= 10 R⊥[31]. The magnetic parameters g- and A-tensors, as well as the additional linewidths were optimized for pure BSA and pure micelles of CTAC.
III. RESULTS AND DISCUSSION
A. Spin labeled micelles of pure surfactant
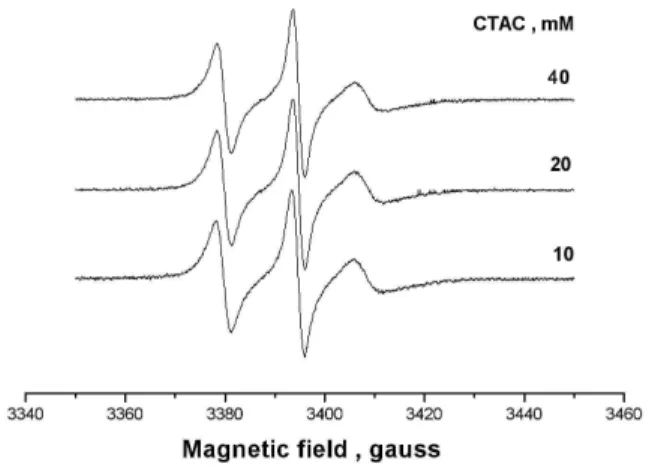
the paramagnetic fragment of 5-DSA closer to the surfactant headgroup. The rotational motions of the spin labels in the presence of surfactant micelles were significantly lower than those in buffer solution as described in [18]. They are also lower for 5-DSA as compared to 16-DSA, in agreement with greaterτ2Candτ2Bfor 5-DSA. In the range 10-40 mM of sur-factant the EPR spectra are essentially unchanged.
FIG. 1: EPR spectra of 5-DSA in solutions of pure CTAC at concen-trations of 10, 20 and 40 mM.
B. Spin labeled BSA and BSA-CTAC system
The binding of stearic-acid spin labels to BSA has been pre-viously studied using the nonlinear least-squares simulation program [18,32]. The EPR spectral analysis made for stearic acid spin labels at different positions in the methylene chain showed an anisotropy in the rotational diffusion with a sig-nificantly faster motion around their long hydrocarbon chain, which was interpreted by the authors [32] assuming that the nitroxides are tightly held in some protein channels. In the present work, we focus on a comparison of the rotational dif-fusion of the spin labels in pure surfactant micelles, pure BSA solution and micelle-like aggregates of surfactant-BSA in or-der to obtain new data regarding the interaction of stearic acid and a cationic surfactant with the protein molecule. Experi-ments were performed in such a way that a fixed concentra-tion of spin label, close to equimolar to the protein, was used. An assumption was made that the nitroxide stearate derivative would bind to the same protein high affinity sites as do both fatty acids or the used surfactants [5,12,18,26].
A limitation of this assumption is the fact that the associa-tion constants are quite different for anionic SDS, zwitterionic HPS and cationic CTAC, so that the competition of surfactant for the nitroxide binding site could be differentiated.
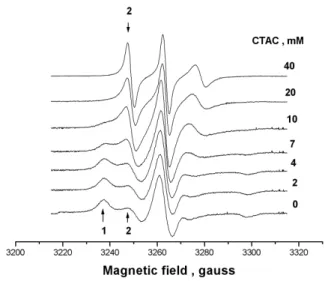
In Fig. 2 the experimental spectra of 5-DSA in BSA with different concentrations of CTAC in the range 2-40 mM are shown. A general trend is observed and illustrated in this fig-ure when the sample contained both protein and surfactant.
FIG. 2: EPR spectra of 5-DSA in solutions of BSA 0.15 mM in phosphate buffer 20 mM pH 7 at indicated concentrations of cationic surfactant CTAC. The arrows indicate the protein bound component 1 and micelle bound component 2.
FIG. 3: EPR spectra of 16-DSA in solutions of BSA 0.15 mM in phosphate buffer 20 mM pH7 and indicated concentrations of cationic surfactant CTAC. The arrows indicate the protein bound component 1 and micelle bound component 2.
increase in rotational motion for the paramagnetic fragment attached to the 16thcarbon of the nitroxide methylene chain. The estimated rotational correlation times from the intensities of the components are τ2C= 1.7 ns and τ2B= 1.3 ns. At the same time motional restriction persists for 5-DSA even at 40 mM of CTAC.
C. EPR spectral simulation using the NLLS program
Spectral simulation was performed with the NLLS program for several samples described above. In the case of pure CTAC
FIG. 4: Variation of linewidth of the central line MI=0 as a function of CTAC concentration for the BSA-CTAC and pure CTAC systems. Squares correspond to 5-DSA and circles to 16-DSA in BSA-CTAC system; triangles correspond to 5-DSA and up-triangles to 16-DSA in pure CTAC system. The lines were drawn just as a guide for the eye.
FIG. 5: Variation of the maximum hyperfine splitting in the EPR spectra of 5-DSA (squares) and 16-DSA (circles) as a function of CTAC concentration. Data correspond to spectra presented in Figs. 1 and 3. The lines were drawn just a guide for the eye.
and a model of axial symmetry for motion (nxy=0) with n=1 was used. The value of n was varied later on, and it was no-ticed that its variation in a broad range (down to n=0) did not changed significantly the quality of the fit (χ2value) while the rotational diffusion R−bar1 could be changed significantly. This means that in the fast motional regime, characteristic for ni-troxides in pure micelles, the degree of anisotropy associated to n is largely undetermined. The slow component dominates the spectral features, mantaining constant R⊥. In other words, it is difficult to obtain a very precise value for it from the sim-ulation. In the case of 5-DSA the fit was good enough with the gaussian and lorentzian linewidth parameters set to 0 and the rotational diffusion obtained was R−bar1=6.2 ns. The corre-sponding rotational correlation timeτ= R−bar1/6 =1ns. In the case of 16-DSA the same model was used but the fit was im-proved using linewidth parameters as gib0 =1.46 and lb =0.1. The rotational diffusion was R−bar1=1.2 ns with corresponding rotational correlation time of 0.2 ns. It is interesting that for both 16-DSA and 5-DSA the rotational correlation times ob-tained from the simulation were a factor of 2 lower as com-pared to the values obtained from the intensity ratios as de-scribed above. However, as mentioned before, change of the n value towards its value for the isotropic model (n=0) leads to a reduction of Rbarwith consequent convergence of the two correlation times, from simulation and intensity ratios, to the same value.
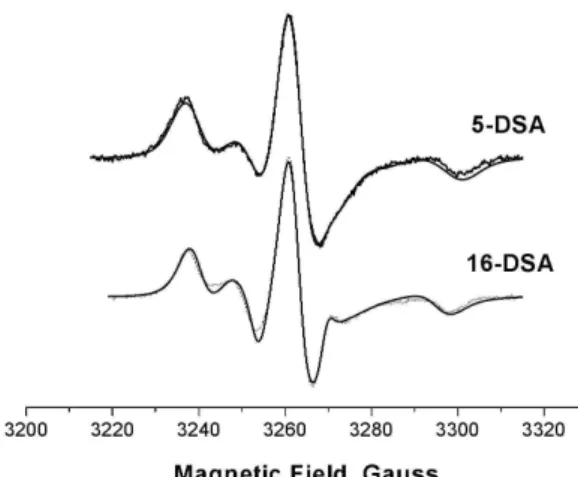
Next in the simulation the strongly immobilized spectra for 5- and 16-DSA bound to pure BSA (absence of surfactant) were considered. For 5-DSA the magnetic parameters were gxx, gyy and gzz equal, respectively, to 2.0086, 2.0063 and 2.0025, and axx, ayy and azzequal to 6.9, 5.4 and 33.8 gauss. The average hyperfine tensor a0=15.4 gauss suggests that 5-DSA bound to the protein monitores an envinronment which is slightly more polar as compared to that observed in pure CTAC micelle. These values are identical to those obtained in reference [32]. Axial symmetry for motion was assumed with n = 0.85 and nxy= 0 as in [32]. The gaussian linewidth meter gib0 for the best fit was 4.7 while the lorentzian para-meter was kept zero. The rotational diffusion parapara-meter R−bar1 for the best fit was 98 ns leading to a rotational correlation time of 16.6 ns. In the case of 16-DSA bound to pure BSA the spectrum was adequately simulated to identical g-tensor values and the only hyperfine component which was different in comparison to 5-DSA is azz which was 33.2. This gives an average value a0= 15.3 very similar to that obtained for 5-DSA. Additional gaussian and lorentzian linewidths were optimized and the rotational diffusion parameter for the best fit was 36 ns leading to a rotational correlation time of 6 ns. In Fig. 6 the pure protein spectra for both 5-DSA and 16-DSA are presented together with the experimental EPR spectra. Ev-idently the fits are quite good. It is also worth of mentioning the characteristic rotational correlation time that would be ex-pected for intact native BSA based on SAXS data as well as from fluorescence anisotropy decay experiments [18,33]. Us-ing the Stokes-Einstein relation for the rotational correlation timeτc=η.V/RT, whereηis the solution viscosity, V the par-ticle volume, R the universal gas constant, and T the tempera-ture, and assuming that the volume of BSA is given as that of a
sphere of radius equal to 38 A, will give an estimate ofτcof 51 ns [18]. From fluorescence anisotropy decay of tryptophans of BSA this value is 42 ns [33]. In this way, our values obtained in the present work for the rotational correlation times of the nitroxides bound to BSA are certainly an average value which include some contribution of the motion of the paramagnetic fragment relative to the whole protein particle. This explains the lower value ofτcobtained from EPR spectral simulation as compared to the expected value for the protein.
FIG. 6: Experimental and simulated EPR spectra for 5-DSA and 16-DSA nitroxides bound to pure BSA samples. Protein concentration 0.15 mM.
Finally, the spectrum for 16-DSA in the mixed system BSA plus CTAC 40 mM was simulated. The best fit model was similar to that in pure CTAC micelles giving gxx, gyyand gzz of 2.0082, 2.0061 and 2.0030, and axx, ayy and azz equal to 6.9, 5.4 and 32.3 gauss. The average hyperfine tensor was a0 = 14.86 gauss, again indistinguishable from the value in pure CTAC micelles. The rotational diffusion R−bar1was equal to 3.7 ns, a value higher as compared to that in pure CTAC micelles, implying that in the presence of protein the motion of 16-DSA in the micelles becomes more restricted. Work to simulate the remaining EPR spectra of the mixture BSA-CTAC is in progress to evaluate the contributions of the two populations of nitroxides, one bound to the protein and the second located in the protein-bound micelles.
study as well) a significant increase of lifetime was observed and, as the concentration of surfactant is increased, the life-time tends to the value observed in pure micelles, which is higher as compared to aqueous solution due to the protection from water of the chromophore and possibly protection from oxygen dissolved in water. The authors found that the lifetime starts to decrease at approximately 1 mM of surfactant regard-less of surfactant type or buffer pH. This concentration is asso-ciated to massive cooperative surfactant binding that for SDS is around 1-2 mM. Aggregation numbers of surfactants in the presence of BSA were also estimated through static and time-resolved fluorescence quenching. These numbers are much smaller (approximately half) as compared to pure surfactants and seem to be independent of buffer composition. In compar-ison with SDS, the aggregation numbers of CTAB are smaller, whereas for free micelles the CTAB micelles are larger than the SDS ones. This means that the CTAB micelles bound to BSA are smaller as compared to SDS ones.
IV. CONCLUSIONS
For pure micelles a single component is observed in the EPR spectra characteristic of the mobility of nitroxides in mi-celles, where 16-DSA has rotational correlation times in the subnanosecond region of fast reorientational motion while 5-DSA has reorientational correlation times of a few nanosec-ond in the limit of validity of the fast motion regime. Simu-lated values forτcare a factor of 2 lower as compared to val-ues estimated from component intensity ratios. The EPR data obtained with spin labels strongly coupled to the polypeptide chains indicated mobility increases even when the detergent
concentrations are as low as 2 mM. In the presence of the pro-tein the EPR spectra correspond to two different spin label populations, with different mobilities and associated to one population in close contact to the protein and probably acco-modated in the high affinity protein binding sites and a second one distributed in the micellar aggregates and sensitive to the presence of protein as revealed by EPR spectral parameters.
The EPR data indicated also more mobility for pure surfac-tant micelles than for “micelle-like” aggregates in presence of protein. For CTAC and 5-DSA even at the highest surfac-tant concentration of 40 mM an immobilized component was still present in the spectrum, while for 16-DSA, the nitroxide was, apparently, completely transferred to a micellar envin-ronment. This is probably consistent with a lower affinity of this nitroxide to the protein as observed from its higher mo-bility observed from a lower rotational correlation time in the absence of surfactant for the pure protein. For those spin la-bels inside the “micelle-like” aggregates a decrease of motion compared to the motion in pure micelles would be expected, since the spin labels are subject to stronger interactions. The interaction between “micelle-like” aggregates and the protein also reduces the overall rotational motion of these micelles.
Acknowledgments
The authors thank to CNPq and FAPESP Brazilian agencies for partial financial support.
[1] D. Carter, B. Chang, J. X. Ho, K. Keeling, and Z. Krishnasami, Eur. J. Biochem.226, 1049 (1994).
[2] J. R. Brown, P. Shockley. Lipid-Protein Interactions, vol. 1, Wi-ley, New York, 1982.
[3] T. Peters, All about albumins: biochemistry, genetics and med-ical applications. San Diego, Academic Press, 1996.
[4] X. Min He, D. Carter, Nature358, 209 (1992).
[5] S. Curry, H. Mandelkow, P. Brick, and N. Franks. Nat. Struct. Biol.5, 827 (1998).
[6] C. Tanford,The hydrophobic effect: formation of micelles and biological membranes, Wiley, New York, 1973.
[7] N. J. Turro, K. P. Ananthapadmanabhan, X. G. Lei, and M. Aronson, Langmuir11, 2525 (1995).
[8] M. N. Jones, D. Chapman,Micelles, monolayers and biomem-branes, Wiley-Riss, New York, 1995.
[9] J .A. Reynolds, C. Tanford, J. Biol. Chem.245, 5161 (1970). [10] H. Durchschlag, K. J. Tiefenbach, S. Gebauer, and R. Jaenicke,
J. Mol. Struct.563, 449 (2001).
[11] E. L. Gelamo, M. Tabak, Spectrochem. Acta,56, 2255 (2000). [12] E. L. Gelamo, C.H.T.P. Silva, H. Imasato, and M. Tabak,
Biochim. Biophys. Acta,1594, 84 (2002).
[13] M. Vasilescu, D. Angelescu, M. Almgren, and A. Valstar, Lang-muir,15, 2635 (1999).
[14] S. H. Chen, J. Teixeira, Phys. Rev. Lett.57, 2583 (1986).
[15] X. H. Guo, N. M. Zhao, S. H. Chen, and J. Teixeira, Biopolym.
29, 335 (1990).
[16] S. F. Santos, D. Zanette, H. Fischer, and R. Itri, J. Colloid and Interface Sci.262, 400 (2002).
[17] S. Shinagawa, M. Sato, K. Kameyama, and T. Takagi, Langmuir
10, 1690 (1994).
[18] E. L. Gelamo, R. Itri, A. Alonso, J. V. da Silva, and M. Tabak, J. Coll. Int. Sci.277, 471 (2004).
[19] R. E. Tanner, B. Herpigny, S. H. Chen, and C. K. Rha, J. Chem. Phys.76, 3866 (1982).
[20] A. Valstar, M. Almgren, W. Brown, and M. Vasilescu, Lang-muir,16, 922 (2000).
[21] A. K. Mor´en, O. Regev, and A. Khan, J. Coll. Int. Sci.222 170 (2000).
[22] A. K. Mor´en, A. Khan, J. Coll. Int. Sci.218, 397 (1999). [23] S. Ghosh, A. Banerjee, Biomacromol.3, 9 (2002).
[24] M. D. Lad, V. M. Ledger, B. Briggs, R. J. Green, and R. A. Frazier, Langmuir 19, 5098 (2003).
[25] D. Kelley, D. J. McClements, Food Hydrocoll.17, 73 (2003). [26] A. D. Nielsen, K. Borch, and P. Westh, Biochim. Biophys. Acta
1479, 321 (2000).
[27] S. Curry, B. Peter, N. P. Franks, Biochim. Biophys. Acta1441, 131 (1991).
Academic Press, New York, 1976.
[29] V. E. Yushmanov, M. Tabak, J. Coll. Int. Sci.191, 384 (1997). [30] D. J. Schneider, J. H. Freed, Biological Magnetic Resonance,
v.8, L. J. Berliner and J. Reuben eds, Plenum Press, New York. 1-76, 1989.
[31] D. E. Budil, S. Lee, S. Saxena, and J. H. Freed, J. Magn. Reson. A120, 155 (1996).
[32] M. T. Ge, S. B. Rananavare, and J. H. Freed, Biochim. Biophys. Acta,1036, 228 (1990).