ISSN 0100-879X
BIOMEDICAL SCIENCES
AND
CLINICAL INVESTIGATION
www.bjournal.com.br
www.bjournal.com.br
Volume 45 (6) 473-564 June 2012
Braz J Med Biol Res, May 2012, Volume 45(6) 473-481
doi:
10.1590/S0100-879X2012007500050
Electron paramagnetic resonance study of lipid and protein
membrane components of erythrocytes oxidized with hydrogen
peroxide
S.A. Mendanha, J.L.V. Anjos, A.H.M. Silva and A. Alonso
Institutional Sponsors
The Brazilian Journal of Medical and Biological Research is partially financed by
Faculdade de Medicina de Ribeirão Preto Campus
Ribeirão Preto
Explore High - Performance MS Orbitrap Technology In Proteomics & Metabolomics
Electron paramagnetic resonance study of
lipid and protein membrane components of
erythrocytes oxidized with hydrogen peroxide
S.A. Mendanha, J.L.V. Anjos, A.H.M. Silva and A. Alonso
Instituto de Física, Universidade Federal de Goiás, Goiânia, GO, Brasil
Abstract
Electron paramagnetic resonance (EPR) spectroscopy of spin labels was used to monitor membrane dynamic changes in erythrocytes subjected to oxidative stress with hydrogen peroxide (H2O2). The lipid spin label, 5-doxyl stearic acid, responded
to dramatic reductions in membrane fluidity, which was correlated with increases in the protein content of the membrane.
Membrane rigidity, associated with the binding of hemoglobin (Hb) to the erythrocyte membrane, was also indicated by a spin-labeled maleimide, 5-MSL, covalently bound to the sulfhydryl groups of membrane proteins. At 2% hematocrit, these alterations in membrane occurred at very low concentrations of H2O2 (50 µM) after only 5 min of incubation at 37°C in azide phosphate buffer, pH 7.4. Lipid peroxidation, suggested by oxidative hemolysis and malondialdehyde formation, started at 300 µM H2O2 (for incubation of 3 h), which is a concentration about six times higher than those detected with the probes. Ascorbic acid and
α-tocopherol protected the membrane against lipoperoxidation, but did not prevent the binding of proteins to the erythrocyte
membrane. Moreover, the antioxidant (+)-catechin, which also failed to prevent the cross-linking of cytoskeletal proteins with Hb, was very effective in protecting erythrocyte ghosts from lipid peroxidation induced by the Fenton reaction. This study also showed that EPR spectroscopy can be useful to assessthe molecular dynamics of red blood cell membranes in both the lipid and protein domains and examine oxidation processes in a system that is so vulnerable to oxidation.
Key words: Electron paramagnetic resonance; Spin label; Erythrocyte; Membrane fluidity; Membrane oxidation;
Protein oxidation
Introduction
Correspondence: A. Alonso, Instituto de Física, Universidade Federal de Goiás, Goiânia, GO, Brasil. Fax: +55-62-3521-1014. E-mail: [email protected]
Received November 9, 2011. Accepted March 26, 2012. Available online April 5, 2012. Published June 4, 2012. Red blood cells (RBCs) are continuously exposed to
reactive oxygen species (ROS) produced as a result of their high cellular oxygen concentration and abundant heme iron content (1). The autoxidation of oxyhemo-globin to methemooxyhemo-globin generating superoxide anion
radical (O2.-) represents the main source of ROS in
RBCs (2). Hydrogen peroxide (H2O2) is produced by
O2.- dismutation, which causes oxidative modifications
in oxyhemoglobin (3). Exposure of oxyhemoglobin to
H2O2 leads to increased concentration of
methemoglo-bin, lipid peroxidation (4), and spectrin-hemoglobin (Hb) complexes (5). In addition, the erythrocyte membrane is particularly sensitive to oxidative damage due to its high polyunsaturated fatty acid content, and hence, it repre-sents an important system to study the effect of oxidative stress (6,7). In this respect, RBCs have been used as a model for the assessment of oxidative damage caused by
a variety of inducers such as H2O2, Cu2+-ascorbic acid,
Fe2+-ascorbic acid, azo compounds, and the xanthine/
xanthine oxidase system (4,7-9).
Several studies using fluorescence spectroscopy
(4,9), scanning electron microscopy (SEM) (2,5,8) and spectrophotometry (10,11) have suggested that oxidative damage promoted by ROS may be mitigated by antioxi-dants. In particular, many studies have reported
protec-tive effects of dietary antioxidants against H2O2-induced
oxidation in human RBCs. For instance, preincubation of
human erythrocytes with a red wine extract significantly
prevents oxidative hemolysis, methemoglobin production
and lipid peroxidation induced by H2O2 (4). Similarly, peel
extracts from unripened and ripened mango fruits have
protective effects on H2O2-induced hemolysis, lipid
474 S.A. Mendanha et al.
and potato peel extracts have provided protection against
H2O2-induced morphological changes in rat RBCs (7).
Electron paramagnetic resonance (EPR) spectroscopy of spin labels has been used to access dynamic molecular changes in cell membranes due to lipid and protein oxidation. Membrane rigidity associated with increased malondial-dehyde (MDA) formation was found in apical segments of coffee seedling roots after chilling stress (12,13), in mito-chondria subjected to iron-induced lipoperoxidation (14), in lead-exposed HepG2 cells (15) and in sonicated soybean phospholipid vesicles upon lipoperoxidation with iron/ascor-bate (16). Oxidative stress of the integral proteins of cell membranes reduces the mobility of the protein backbone,
which has been monitored using thiol-specific spin labels
(17-19). In the present study, we have detected dramatic stiffening in the erythrocyte membrane of cells subjected to
oxidative stress with H2O2, in the presence of azide, which
was correlated with an increase in the protein content of the membrane. Surprisingly, membrane alterations were
observed at seversl times lower H2O2 concentrations and
incubation than necessary for oxidative hemolysis and thiobarbituric acid reactive species (TBARS) formation. To examine this oxidative process in more detail, we also analyzed the protective effects of three classic antioxidants on the physicochemical changes induced by free radical stress in both lipid and protein components of the RBC membrane.
Material and Methods
Chemicals
The spin labels, 5-doxyl stearic acid (5-DSA) and 3-maleimide-proxyl (5-MSL), were purchased from Sigma (USA), whereas all other reagents were purchased from either Sigma or Merck S.A. (Brazil). All solutions were prepared with Milli-Q water.
Preparation of erythrocytes and induction of oxidative stress
Human blood samples obtained from two blood banks in Goiânia, Brazil, were diluted in phosphate-buffered saline (PBS, 10 mM phosphate, 150 mM NaCl, pH 7.4) containing 1 mM sodium azide and centrifuged three
times at 150 g for 10 min at 4°C. Plasma and white blood
cells were carefully removed by aspiration in each wash. Oxidative stress was induced in the erythrocytes at 2%
hematocrit in PBS with the desired concentration of H2O2
and incubation at 37°C for 3 h. The reagent solutions were gently shaken every 30 min during incubation. To evaluate the protective effect of antioxidant molecules, RBCs were previously incubated for 30 min at 37°C with the desired concentrations of ascorbic acid, (+)-catechin, L-carnosine,
or α-tocopherol before the oxidation process. In tests that
measured the antioxidant effect of catalase, sodium azide was not added to the PBS.
Determination of hemolysis
The hemolytic level was determined spectrophoto-metrically. After the sample was oxidized by following the experimental protocol described above, the reagent
solu-tions were centrifuged for 10 min at 300 g and at 25°C
and the absorption of the supernatant (A) was measured at 540 nm. Percent RBC lysis was determined according
to the following equation: % hemolysis = Aa - Ac1 / Ac2 -
Ac1, where Ac1 is the control sample (0% H2O2), Ac2 is the
sample completely hemolyzed with Milli-Q water and Aa is
the sample with the desired H2O2 concentration.
Determination of TBARS
MDA production was measured according to the fol-lowing protocol (20). After incubating the RBCs in solutions
containing H2O2, 10% trichloroacetic acid (TCA (w/v) final
concentration) was added to 1.5 mL of the supernatant solu-tion of erythrocytes. The solusolu-tions were then centrifuged for
10 min at 300 g and 1 mL thiobarbituric acid (TBA, 1% in
0.05 M NaOH) was added to the supernatant. The reagent solution was heated to 95°C for 30 min. After cooling to 4°C, 1 mL n-butanol was added to each tube to extract the MDA-TBA complex. TBARS concentration was obtained by subtracting 20% of the absorbance at 453 nm from the
absorbance at 532 nm, using a molar extinction coefficient
of 1.56 x 10⁵ M-1 cm-1.
Spin labeling of lipid and protein components of the erythrocyte membrane
After exposure to oxidative stress, the erythrocytes were
sedimented by a 10-min centrifugation at 300 g and 4°C.
The lipid component of the membrane was spin labeled by adding ~1 µL 5-DSA (5 mg/mL in ethanol) to the RBC pellet. Maleimide labeling of erythrocyte membranes was
performed by first incubating the samples in 5 mM phos -phate, pH 8.0, for 2 h at 4°C, centrifuging for 30 min at
20,000 g and 4°C, and carefully removing the supernatant.
This procedure was repeated until the supernatant was free of residual hemoglobin. Then, ~2 µL 5-MSL (50 mg/mL in ethanol) was added to the membranes and was allowed to react for 30 min at 4°C. The unbound label was removed by centrifugation.
Preparation, oxidation and spin labeling of erythrocyte ghosts
Erythrocytes at ~6% hematocrit were incubated in 5 mM PBS, pH 8.0, for 2 h at 4°C. After a 30-min centrifugation at
20,000 g and 4°C, the supernatant was carefully removed.
The above procedure was repeated until the supernatant was free of residual Hb. The erythrocyte ghosts were then
resuspended in PBS. To induce oxidative stress, 2 mM H2O2
and 200 µM FeSO4 in 150 mM NaCl, pH 7.0, were added
de-sired aliquot of this antioxidant molecule and subjected to oxidative stress as described above.
Protein quantification of oxidized erythrocyte
membranes
The protein content of the membrane of oxidized eryth-rocytes was measured using a commercial kit (Sigma) based on the reaction of bicinchoninic acid (BCA) (21,22). After erythrocyte exposure to oxidative stress, erythrocyte ghosts were prepared and a small aliquot was added to a solution of BCA reagent. After incubation for 30 min at 37°C, absorbance was measured at 562 nm. The protein concentration was determined with a calibration curve prepared with bovine serum albumin (BSA).
EPR spectroscopy
EPR spectroscopy was performed with a Bruker ESP 300 spectrometer (Rheinstetten, Germany) equipped with an ER 4102 ST resonator and a Bruker temperature control-ler. The instrument settings were: microwave power of 2 mW, modulation frequency of 100 KHz, modulation amplitude of 1.0 G,
magnetic field scan of 100 G, sweep time of
168 s, and detector time constant of 41 ms. All measurements were performed at room temperature (24-26°C).
Results
Ascorbic acid and α-tocopherol as
inhibitors of H2O2-induced hemolysis
and TBARS formation in RBCs
The levels of H2O2-induced oxidative
hemolysis measured at 2% hematocrit (Figure 1A) indicate that RBC damage occurs in the
concentration range of 0.3 to 1 mM H2O2. The
protective effects of the antioxidants,
ascor-bic acid and α-tocopherol, against oxidative
hemolysis induced by 0.8 mM H2O2 (Figure
1B) show that ascorbic acid provided a maximum protective effect at concentrations around 160 µM, leading to almost
no oxidative damage, whereas α-tocopherol provided only
a discrete effect at concentrations near 300 µM, with a re-duction of the hemolytic level to about 30%. TBARS levels
increased significantly when erythrocytes were treated with
H2O2 (Figure 1A). The protective effects of ascorbic acid
and α-tocopherol against the oxidative damage of RBC
membranes were consistent with the results of protection against hemolysis (Table 1).
Alteration in erythrocyte membrane fluidity
EPR spectra of 5-DSA in erythrocyte membranes
previ-ously exposed to different H2O2 concentrations (Figure 2A)
demonstrate that the addition of H2O2 leads to an increase
in membrane stiffness as indicatedby the spectral EPR
pa-rameter 2A//. The behavior of 2A// with the oxidative stress
induced by H2O2 at 2% hematocrit is shown in Figure 2B.
Membrane fluidity assessed by the 2A// parameter results in a sigmoidal curve as in the case of the hemolytic effect
(Figure 1A), but the changes in membrane fluidity were
initiated at H2O2 concentration of about 50 µM, which is
approximately six times lower than for the hemolytic ef-fect (~300 µM). Also, the antioxidants ascorbic acid and
α-tocopherol at concentrations that were protective against
hemolysis (Figure 1B) did not show any ability to prevent
changes in erythrocyte membrane fluidity. Furthermore, the
oxidation process triggered by H2O2 occurred rapidly
be-cause the increase of the 2A// parameter was observed after
only 5 min of exposure to H2O2 and could not be prevented
Figure 1. Percent hemolysis (filled squares) and TBARS (open squares) induced
by different H2O2 concentrations in an erythrocyte suspension at 2% hematocrit
(Panel A). Protective effects of ascorbic acid (circles) and α-tocopherol (stars) on
percent hemolysis induced by 0.8 mM H2O2 (Panel B). TBARS = thiobarbituric
acid reactive species.
Table 1. Production of thiobarbituric acid reactive species (TBARS) in erythrocyte suspensions with 0.8 mM H2O2 and pro-tective effect of ascorbic acid and α-tocopherol at several con -centrations.
Antioxidant (µM) TBARS (µmol/mL)
Ascorbic acid α-tocopherol
0 1.44 ± 0.21 1.44 ± 0.21
20 0.53 ± 0.25
60 0.49 ± 0.14
-100 - 1.35 ± 0.28
160 0.54 ± 0.15
-200 - 1.32 ± 0.20
476 S.A. Mendanha et al.
by well-known antioxidants such as ascorbic acid and (+)-catechin.
The results presented above
indicate that the membrane fluid -ity changes in RBCs oxidized with
H2O2 were caused by the membrane
protein component. The formation of cross-links between spectrin and oxidized Hb (5) and/or the binding of hemichromes in the membrane (23) could alter the microenvironment around the spin probe and reduce its rotational motion. It is well known that integral membrane proteins restrict the motion of spin-labeled lipids that surround their hydrophobic regions in the membrane interior (24,25). Thus, the restricted motion of the lipid spin probe in the membrane upon oxidative stress could be explained by altera-tions in the protein component of the membrane. To examine the probable relationship between the observed
reduction in membrane fluidity and
the binding of Hb to the membrane, an experiment measuring protein content
as a function of H2O2 concentrations
was performed (Figure 3). A correla-tion between an increase in total protein concentration in erythrocyte membranes and the reduction in
membrane fluidity caused by gradual
increases in H2O2 concentration was
observed (Figure 3).
Oxidation of erythrocyte membrane proteins
To examine the dynamic changes in erythrocyte membrane proteins,
the thiol-specific spin label, 5-MSL,
was used. The EPR spectra of 5-MSL attached to sulfhydryl groups of RBC membrane proteins previously
exposed to different H2O2
concentra-tions are shown in Figure 4A. EPR spectra of nitroxide side chains are generally characterized by the coex-istence of two spectral components, indicating two probe populations with different states of mobility in thermodynamic equilibrium (26-28). Therefore, each 5-MSL spectrum is the overlap of two spectral compo-nents denoted S (strongly immobi-lized) and W (weakly immobiimmobi-lized).
Figure 2.A, Electron paramagnetic resonance (EPR) spectra of 5-doxyl stearic acid in erythrocyte membranes in the presence of gradually increasing H2O2 concentrations.
The vertical dotted lines are references for the control value of the 2A// parameter, the outer hyperfine splitting. The total scanning range of the magnetic field of all spectra
was 100 G. B, EPR parameter, 2A//, for the control (squares), the 160-µM ascorbic acid-treated (circles) and the 300-µM α-tocopherol-acid-treated (stars) samples as a function of
H2O2 concentration.
Figure 3. Protein content of the erythrocyte membranes (filled squares) and the electron
paramagnetic resonance parameter, 2A//, of 5-doxyl stearic acid in the erythrocyte
The S and W components are associated with restricted and less restricted motion of the nitroxide on the 9.4-GHz EPR time scale. Two parameters measured directly
in the EPR spectra, W/S and 2A// (Figure
4A), are useful for monitoring the effect of rigidity on the protein. As shown in Figure
4B, the parameters W/S and 2A// indicate
that H2O2 promotes the rigidity of
mem-brane proteins with the effect starting at 60 µM. The oxidative process of erythrocyte membrane proteins will probably cause the formation of complexes with oxidized Hb through intra- and interprotein cross-linkings, which restrict the segmental mo-tions of the protein backbone (5,23).
Furthermore, the increase in the signal intensity of 5-MSL during the oxidative process (Figure 5) indicates an increase in the number of SH groups that are ac-cessible to the spin probe. An increase of membrane-bound Hb aggregates could explain the additional reactive sites be-cause each Hb contributes its own free SH groups. The amount of accessible SH groups in the membrane increases with the
gradual increase of H2O2 concentration
Figure 4.A, Electron paramagnetic resonance (EPR) spectra of 5-MSL bound to erythrocyte membrane proteins in the presence of gradually increasing H2O2
con-centrations. The relative intensities of the resonance lines S and W (the fraction of labels in the strongly and weakly immobilized components, respectively) are related to protein dynamics, as well as the 2A// parameter (the separation between the verti-cal dotted lines in the magnetic-field unit). B, The W/S intensity ratio (filled squares)
and the electron paramagnetic resonance parameter 2A// (open squares) plotted as
a function of H2O2 concentration.
Figure 5. H2O2 concentration dependence of the signal intensity of
478 S.A. Mendanha et al.
and is well correlated with the membrane protein content
and the decrease of membrane fluidity as assessed by
5-DSA. Our results support the idea that cross-linking takes place between oxidized Hb and membrane proteins
during the oxidation process induced by H2O2. However,
above 0.3 mM H2O2 the amount of accessible SH groups
is diminished, suggesting the occurrence of oxidation of
these groups at higher H2O2 concentrations.
Effect of azide
In the present study, we used 1 mM sodium azide in erythrocyte suspension to inhibit catalase. Without azide, the hemolytic levels are dramatically reduced, reaching a
maximum of 5% over the entire range of measured H2O2
concentrations (Figure 6). In this case, the membrane rigidity
was only observed at very high H2O2 concentrations (20
mM), about two hundred times the H2O2 concentrations
necessary to obtain similar membrane rigidity in the ab-sence of azide (Figure 2). It is worth mentioning that even L-carnosine, a compound that is being extensively studied due to its ability to prevent protein damage and cross-linkings
mediated by agents such as MDA (the lipid peroxidation product) (29), had no protective effect against the membrane
rigidity induced by H2O2 oxidation (data not shown).
Because H2O2 induces damage on the erythrocyte
membrane that cannot be prevented by classical antioxi-dants, probably due to the high amount of iron present in the erythrocyte, we conducted an experiment using ghost
membranes with the addition of iron sulfate and H2O2. The
EPR parameter, 2A//, for 5-DSA indicated a less pronounced
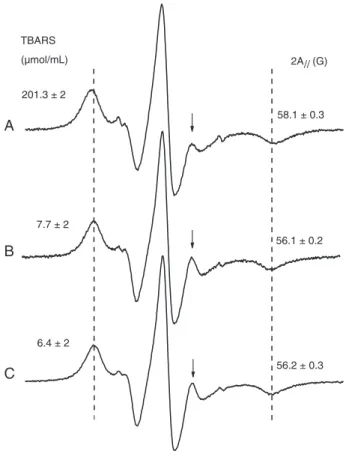
effect of membrane rigidity (Figure 7) and 100 µM (+)-cat-echin was able to protect the membrane against alterations in rigidity. TBARS production (Figure 7) also showed the protective effect of (+)-catechin on the ghost membranes.
Figure 6. Electron magnetic resonance parameter, 2A//, of 5-doxyl
stearic acid in erythrocyte membranes (circles) and oxidative hemolytic level (squares) plotted against H2O2 concentration for
samples with no inhibition of catalase present in the erythrocyte.
Figure 7. A, Electron magnetic resonance (EPR) spectrum of 5-doxyl stearic acid in erythrocyte ghosts oxidized with 2 mM H2O2 and 200 µM FeSO4. B, Control sample (not oxidized). C,
Samples pre-treated with 100 µM (+)-catechin and then oxidized as in A. The EPR parameter, 2A//, increases for the oxidized
sam-ple, indicating a reduction in molecular dynamics or increased
molecular order. The high-field resonance line of the inner hyper
-fine splitting (indicated by an arrow for each spectrum) decreases
in the spectrum of oxidized membranes, indicating a loss of probe
mobility. The figure also shows a decrease in the production of
Discussion
In the current study, the membrane dynamic changes
in erythrocytes subjected to oxidative stress with H2O2
were characterized by EPR spectroscopy using spin labels
specific for both lipid and protein components. Interestingly,
the lipid spin label 5-DSA was able to detect the alterations in the protein component of the membrane caused by the binding of Hb to erythrocyte membranes. The EPR spectra of lipid spin labels in lipid bilayers containing proteins are generally composed of two spectral components, a fact indicating the coexistence of two populations of spin la-bels differing in their state of mobility. The more restricted component is associated with the boundary lipids where the spin labels surround the hydrophobic regions of pro-teins, whereas the more mobile component arises from the spin labels located in the bulk bilayer phase, away from the protein (24,25). However, probably due to the high protein concentrations in the erythrocyte membrane (~50%), only the spectral component corresponding to the spin label contacting proteins appears in the EPR spectra of 5-DSA, indicating that the fraction of spin labels without any contact with proteins is too small. Thus, a spin-labeled lipid may detect changes in the protein component of RBC membranes. For oxidized samples of RBC ghosts,
increases in the 2A// parameter of up to about 2 G were
observed (Figure 7). For erythrocyte membranes, in which protein binding occurs in the membrane upon oxidation
with H2O2, the observed increases were about 5 G
(Fig-ure 2B). Equivalent increases of the 2A// parameter (2
and 5 G) could be achieved by lowering the temperature of the non-oxidized membrane by about 8° and 20°C, respectively (30).
Several studies have assessed the degree of lipid peroxi-dation using EPR spectroscopy of spin-labeled lipids incor-porated into membranes. For instance, the chilling stress in coffee seedlings caused by plant exposure to a temperature of 10°C for 6 days in darkness led to membrane stiffness of the plant root, which was associated with growth inhibi-tion, changes in metabolic rates and MDA formation and was interpreted to be due to lipid peroxidation (12,13). The
increase in the 2A// parameter of 5-DSA measured directly in
intact root-tip segments was about 2 G for coffee seedlings
exposed to chilling stress. Similar increases in 2A// were
caused by iron-induced lipoperoxidation in mitochondrial membranes, which was prevented by 25 µM dipyridamole, a coronary vasodilator (14). These data are consistent with
the increase of about 2 G in the 2A// parameter, observed
here for ghost membranes, which was caused by lipid
peroxidation with Fe2+ plus H
2O2. In the membrane model
of sonicated soybean phospholipid vesicles, the effect of
lipid peroxidation with iron/ascorbate on membrane fluidity
was dependent on the nitroxide position along the fatty-acid chain. Maximum rigidity was observed for the positional isomers 10- and 12-DSA (16).
Oxidative stress on the protein component of cell membranes has been monitored by EPR spectroscopy of spin-labeled maleimide in several studies, indicating that the spectral intensity ratio, W/S, may be a general index of oxidative injury to membrane proteins (17-19). For instance, it has been reported that oxidative stress induced by iron/ ascorbate on the rodent synaptosome membrane causes stiffness in the protein component as judged by the EPR parameter W/S from a thiol-selective spin-label (18). In the present study, we show that another more important
spectral parameter, 2A//, directly related to the dynamics
of the protein backbone, also indicates stiffening when the
proteins are oxidized. Here, the variation of 2A// for 5-MSL
in erythrocyte membranes oxidatively stressed by H2O2 was
1 G (Figure 4B), which is only half the variation observed with the spin-labeled lipid in RBC ghosts (Figure 7). The
experimental error of 2A// is 0.5 G, but the high
reproduc-ibility of the EPR technique allowed us to obtain a curve and
significant differences. EPR spectroscopy also allows an
assessment of the amount of free sulfhydryl groups in the sample that is proportional to the signal intensity of
thiol-specific spin labels. The amount of accessible SH groups
gradually increased with H2O2 concentration in RBCs,
suggesting that proteins, possibly Hb molecules, bind to the membrane during oxidative stress and contribute additional SH groups. The amount of free thiol groups in the erythrocyte membrane correlated with the membrane’s protein content
and degree of rigidity in the H2O2-concentration range of
50 to 200 µM (Figure 5). A decrease in the number of free SH groups was observed for concentrations of 300 to 1500 µM, the same concentration range at which the hemolytic and TBARS levels were increased. These results suggest that during the process of lipid peroxidation the SH groups are oxidized, in agreement with complementary studies showing that the SH group content in erythrocyte ghosts
decreases with lipid peroxidation by H2O2 (19).
Snyder et al. (5) showed that H2O2 induces the formation
of a spectrin-Hb complex in human erythrocyte membranes associated with a progressive alteration in the cell’s shape to echinocytic morphology, decreased cell deformability and increased phagocytosis. The authors pointed out that the role of heme proteins is crucial for the occurrence of these cellular changes because they can be completely inhibited by prior exposure of erythrocytes to carbon monoxide. Lipid peroxidation does not appear to be important because the antioxidant butylated hydroxytoluene was only able to inhibit lipoperoxidation, while failing to prevent the formation of the spectrin-Hb complex (5). In addition, Aydogan et al. (31)
showed that L-carnosine significantly improved the RBC
deformability, which is impaired by H2O2-induced oxidative
stress. In our experiments, the antioxidants ascorbic acid
and α-tocopherol prevented oxidative hemolysis and TBARS
production, but neither they nor L-carnosine were able to prevent large increases in membrane rigidity observed
480 S.A. Mendanha et al.
These results suggest that the oxidative hemolysis measured here was due to lipid peroxidation and that the antioxidants acted only as free radical scavengers. Similarly, the antioxidant (+)-catechin also prevented membrane rigid-ity and TBARS production in erythrocyte ghosts induced by the Fenton reaction but was unable to inhibit damage to the intact erythrocyte. Thus, catalase seems to be the only antioxidant able to prevent alterations in the erythrocyte membrane dynamics when oxidative stress is triggered by hydrogen peroxide in the presence of hemoglobin. In fact, oxidative damage to RBCs during refrigerated storage has been well documented (23,32) and recently, the probable formation of non-reducible cross-linkings of oxidized/denatured Hb or hemichromes was detected with RBC membranes (23). The present study highlights the role of catalase in protecting RBC against exogenous hydrogen peroxide. Although azide has been widely used
as an inhibitor of catalase in RBC, its specificity needs
to be further investigated. Along with catalase, hydrogen peroxide is also decomposed by glutathione peroxidase and cytoplasmic peroxiredoxins. Furthermore, it has been reported that peroxiredoxin 2, the third most abundant protein in erythrocytes, appears to play an important role in the metabolism of low-level hydrogen peroxide in the erythrocyte (33-35).
In conclusion, the present study showed that EPR spectroscopy of a spin-labeled lipid is highly sensitive to the binding of oxidized Hb to the membrane when RBCs
are subjected to oxidative stress with H2O2. The increase
in membrane rigidity caused by this oxidation process was
also detected by a thiol-specific spin label, which allowed
us to quantify the free sulfhydryl groups. The amount of ac-cessible thiol groups correlated with the protein content of the erythrocyte membrane and with the membrane rigidity
at low H2O2 concentrations. At higher H2O2 concentrations
(0.4 mM), there is oxidation of SH groups. Hemolysis and
TBARS formation, observed for higher H2O2 concentrations,
was inhibited by ascorbic acid and α-tocopherol, but these
antioxidants, as well as L-carnosine and (+)-catechin, were unable to prevent the membrane rigidity, which occurs even
for low H2O2 concentrations and short incubation periods.
Moreover, a reduction in the fluidity of erythrocyte ghosts
induced by the Fenton reaction was inhibited by the antioxi-dant (+)-catechin. We also showed that EPR spectroscopy can be useful to assess the molecular dynamics of RBC membranes in both the lipid and protein domains, and thus examine the oxidation processes in a system that is so vulnerable to oxidation.
Acknowledgments
The authors are grateful to INGOH - Goiano Institute of Oncology and Hematology and Hemolabor - Clinical Analysis Laboratories for the blood supply. Research sup-ported by CNPq, CAPES and FUNAPE. S.A. Mendanha, J.L.V. Anjos and A.H.M. Silva are recipients of fellowships from CAPES. A. Alonso gratefully acknowledges CNPq for a research grant.
1. Cimen MY. Free radical metabolism in human erythrocytes.
Clin Chim Acta 2008; 390: 1-11.
2. Nikoliæ-Kokiæ A, Blagojeviæ D, Spasiæ MB. Complexity of free radical metabolism in human erythrocytes. J Med
Biochem 2010; 29: 189-195.
3. Sadrzadeh SM, Graf E, Panter SS, Hallaway PE, Eaton JW. Hemoglobin. A biologic fenton reagent. J Biol Chem 1984; 259: 14354-14356.
4. Tedesco I, Russo M, Russo P, Iacomino G, Russo GL, Car-raturo A, et al. Antioxidant effect of red wine polyphenols on red blood cells. J Nutr Biochem 2000; 11: 114-119. 5. Snyder LM, Fortier NL, Trainor J, Jacobs J, Leb L, Lubin B, et
al. Effect of hydrogen peroxide exposure on normal human erythrocyte deformability, morphology, surface character-istics, and spectrin-hemoglobin cross-linking. J Clin Invest
1985; 76: 1971-1977.
6. Girotti AW, Thomas JP. Damaging effects of oxygen radicals on resealed erythrocyte ghosts. J Biol Chem 1984; 259: 1744-1752.
7. Singh N, Rajini PS. Antioxidant-mediated protective effect of potato peel extract in erythrocytes against oxidative dam-age. Chem Biol Interact 2008; 173: 97-104.
8. Davies KJ. Protein damage and degradation by oxygen radicals. I. General aspects. J Biol Chem 1987; 262:
9895-9901.
9. Halder J, Bhaduri AN. Protective role of black tea against oxi-dative damage of human red blood cells. Biochem Biophys
Res Commun 1998; 244: 903-907.
10. Durak I, Kavutcu M, Çimen MY, Avcý A, Elgün S, Öztürk HS. Oxidant/antioxidant status of erythrocytes from patients with chronic renal failure: effects of hemodialysis. Med Princ
Pract 2001; 10: 187-190.
11. Ajila CM, Prasada Rao UJ. Protection against hydrogen peroxide induced oxidative damage in rat erythrocytes by
Mangifera indica L. peel extract. Food Chem Toxicol 2008;
46: 303-309.
12. Alonso A, Queiroz CS, Magalhaes AC. Chilling stress leads to increased cell membrane rigidity in roots of coffee (Coffea
arabica L.) seedlings. Biochim Biophys Acta 1997; 1323:
75-84.
13. Queiroz CGS, Alonso A, Mares-Guia M, Magalhães AC.
Chilling-induced changes in membrane fluidity and anti -oxidant enzyme activities in Coffea arabica L. roots. Biol
Plantarum 1998; 41: 403-413.
14. Nepomuceno MF, Alonso A, Pereira-da-Silva L, Tabak M. Inhibitory effect of dipyridamole and its derivatives on lipid peroxidation in mitochondria. Free Radic Biol Med 1997; 23: 1046-1054.
15. Chen L, Yang X, Jiao H, Zhao B. Tea catechins protect against lead-induced cytotoxicity, lipid peroxidation, and
membrane fluidity in HepG2 cells. Toxicol Sci 2002; 69: 149-156.
16. Bruch RC, Thayer WS. Differential effect of lipid peroxidation
on membrane fluidity as determined by electron spin reso -nance probes. Biochim Biophys Acta 1983; 733: 216-222.
17. Trad CH, Butterfield DA. Menadione-induced cytotoxicity ef -fects on human erythrocyte membranes studied by electron paramagnetic resonance. Toxicol Lett 1994; 73: 145-155.
18. Hensley K, Carney J, Hall N, Shaw W, Butterfield DA. Elec -tron paramagnetic resonance investigations of free radical-induced alterations in neocortical synaptosomal membrane protein infrastructure. Free Radic Biol Med 1994; 17: 321-331.
19. Soszynski M, Bartosz G. Decrease in accessible thiols as an index of oxidative damage to membrane proteins. Free
Radic Biol Med 1997; 23: 463-469.
20. Gilbert HS, Stump DD, Roth EF Jr. A method to correct for errors caused by generation of interfering compounds dur-ing erythrocyte lipid peroxidation. Anal Biochem 1984; 137: 282-286.
21. Walker JM. The protein protocols handbook. Totowa: Hu-mana Press Inc.; 2002.
22. Smith PK, Krohn RI, Hermanson GT, Mallia AK, Gartner FH, Provenzano MD, et al. Measurement of protein using bicinchoninic acid. Anal Biochem 1985; 150: 76-85. 23. Kriebardis AG, Antonelou MH, Stamoulis KE,
Economou-Petersen E, Margaritis LH, Papassideri IS. Progressive oxidation of cytoskeletal proteins and accumulation of dena-tured hemoglobin in stored red cells. J Cell Mol Med 2007; 11: 148-155.
24. Jost PC, Griffith OH, Capaldi RA, Vanderkooi G. Evidence
for boundary lipid in membranes. Proc Natl Acad Sci U S A
1973; 70: 480-484.
25. Griffith OH, Jost PC. Lipid spin labels in biological mem
-branes. In: Berliner LJ (Editor), Spin labeling: theory and
application. New York: Academic Press; 1976. p 454-523.
26. Alonso A, Goncalves dos SJ, Tabak M. Stratum corneum protein mobility as evaluated by a spin label maleimide derivative. Biochim Biophys Acta 2000; 1478: 89-101. 27. Alonso A, Vasques da Silva J, Tabak M. Hydration effects
on the protein dynamics in stratum corneum as evaluated by EPR spectroscopy. Biochim Biophys Acta 2003; 1646: 32-41.
28. Alonso A, dos Santos WP, Leonor SJ, dos Santos JG, Tabak M. Stratum corneum protein dynamics as evaluated by a spin-label maleimide derivative: effect of urea. Biophys J
2001; 81: 3566-3576.
29. Hipkiss AR, Preston JE, Himswoth DT, Worthington VC, Ab-bot NJ. Protective effects of carnosine against malondialde-hyde-induced toxicity towards cultured rat brain endothelial cells. Neurosci Lett 1997; 238: 135-138.
30. Alonso A, Meirelles NC, Tabak M. Effect of hydration upon
the fluidity of intercellular membranes of stratum corneum:
an EPR study. Biochim Biophys Acta 1995; 1237: 6-15. 31. Aydogan S, Yapislar H, Artis S, Aydogan B. Impaired
eryth-rocytes deformability in H2O2-induced oxidative stress:
protective effect of L-carnosine. Clin Hemorheol Microcirc
2008; 39: 93-98.
32. Yoshida T, Shevkoplyas SS. Anaerobic storage of red blood cells. Blood Transfus 2010; 8: 220-236.
33. Low FM, Hampton MB, Winterbourn CC. Peroxiredoxin 2 and peroxide metabolism in the erythrocyte. Antioxid Redox
Signal 2008; 10: 1621-1630.
34. Manta B, Hugo M, Ortiz C, Ferrer-Sueta G, Trujillo M, Deni-cola A. The peroxidase and peroxynitrite reductase activity of human erythrocyte peroxiredoxin 2. Arch Biochem Bio-phys 2009; 484: 146-154.