Saline oscillator as a teaching experiment
(Oscilador salino como experimento de ensino)Lucas S. del Lama
1e Marcelo Mulato
Departamento de F´ısica, Faculdade de Filosofia, Ciˆencias e Letras de Ribeir˜ao Preto, Universidade de S˜ao Paulo, Ribeir˜ao Preto, SP, Brasil
Recebido em 23/2/2010; Aceito em 12/1/2011; Publicado em 1/12/2011
The saline oscillator consists of two aligned containers that are filled in by a pair of different solutions, exhibiting electrical potential oscillations when released. These oscillations occur due to a difference of mass density presented by the fluids and they cause varying ions flow, leading to electrical potential variations between both reservoirs. Many biological systems can be understood by this model. In this work, the saline oscillator was investigated using copper sulfate, CuSO4, and sodium chloride, NaCl, solutions, changing parameters as
the diameter and length of the capillary, diameter of the internal compartment and amount of unwanted ions in the main reservoir (distillated and deionized water). The system is shown to be very useful in undergraduate teaching classes.
Keywords: saline oscillator, non-linear equations, fluid dynamics.
O oscilador salino consiste em dois containers alinhados que s˜ao preenchidos por duas solu¸c˜oes distintas, exibindo oscila¸c˜oes de potencial el´etrico quando liberado. Essas oscila¸c˜oes ocorrem devido `a diferen¸ca de densi-dade apresentada pelos flu´ıdos e promovem varia¸c˜ao no fluxo de ´ıons, levando a varia¸c˜oes no potencial el´etrico entre os reservat´orios. Muitos sistemas biol´ogicos podem ser entendidos por este modelo. Neste trabalho, o oscilador salino foi investigado usando solu¸c˜oes de sulfato de cobre, CuSO4, e cloreto de s´odio, NaCl, alterando
parˆametros como o diˆametro e comprimento do capilar, diˆametro do compartimento interno e quantidade de ´ıons indesejados no reservat´orio principal (´agua destilada e deionizada). O sistema mostrou-se muito ´util para
aulas de gradua¸c˜ao.
Palavras-chave: oscilador salino, equa¸c˜oes n˜ao-lineares, dinˆamica dos flu´ıdos.
1. Introduction
From the fluid dynamics studies, oscillatory phenom-ena that are far from their respective stable equilibrium are of great interest, especially for membrane theories in biology, oceanography, meteorology and geophysics. In this context, the saline oscillator has provided innu-merous elucidations related with non-linear behaviors [1-3], interface instability between two fluids [4], beyond transient states [5]. Practical examples of the oscilla-tory behaviors are linked with teaching, from chemical themes [5] and electronic topics [6], to mathematical simulations [7-9], which could be applied in numerical calculus. In biology, it has already been used to supply information about our taste [10], as well as the dynamic of cellular membranes [11,12].
Although oscillatory behaviors are common in many distinct subjects, a particular interest lies on biolog-ical processes. In the last few years, significant in-creases have been achieved in experimental and
the-oretical studies in membranes and interfaces related to oscillatory transport phenomena far from equilibrium region. At the end of the 80’s, Yoshikawa designed a simple hydrodynamic oscillator which allies non-linear characteristics with great reproducibility, being useful for increasing student understanding of non-linear pro-cesses, and also is able to mimic many oscillatory phe-nomena in biology [2].
The saline oscillator was proposed in 1970 by Mar-tin [13] and consists in a very elementary setup. It is composed of two containers, usually a syringe and a cube, concentrically aligned, which separate two fluids of distinct densities. The denser fluid fills in the inter-nal compartment, while the exterinter-nal one is fulfilled by the lighter one. Through a vertical capillary, or even a hole, there is a possibility that the denser fluid flows downward and, sequentially, the lighter one goes up-ward. These flows exhibit self-sustained oscillations, oscillating between the compartments with a constant period for many cycles [14]. In the specific case of the
1E-mail: [email protected].
saline oscillator, the fluids often involved are copper sul-fate (CuSO4) or sodium chloride (NaCl) as saline
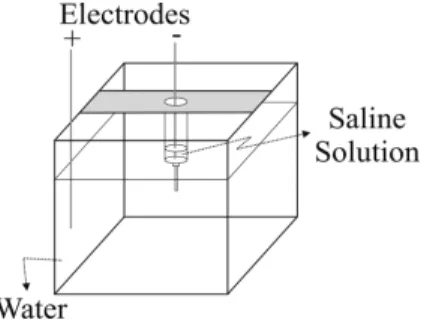
solu-tions (ρs) and purified water (ρw). A schematic draw-ing of the experimental setup is shown in Fig, 1. Dif-ferently from the density oscillator, the system shows, beyond the oscillatory flood, electric potential oscilla-tions, which are measured between the two containers by a pair of electrodes.
Figure 1 - Experimental setup. The outer reservoir is much larger than the inner compartment, which contains the saline solution.
Many theories were proposed to explain the electric behavior presented by the system. Among them, the streaming potentials [15] propose that a double layer is formed inside the capillary. One layer would be held on the internal surface of the capillary and the other, in the center of the capillary, would be mobile. As the solution moves out, only the mobile part of the layer is carried by the flux, separating electrical charges. Since the flood changes direction with time periodically, os-cillations are perceptive. Beyond the qualitative idea of the streaming potentials, an equation can be used to describe the fluids oscillations. The difference between the solutions densities, ρs – ρw, and their concentra-tions determine the magnitude of the buoyant force [16], which is related with the gradient of pressure between the superior and inferior segments of the needle. By means of mathematical simulations, it is known that the pressure term is the most important for driving the oscillations, although the viscosities of the fluids, which are altered with reversal flow, are also crucial [17-19]. In other words, the density and the viscosity of the fluids modify the pressure inside the needle. Mathematically, this was already stated [20] as
d2
dt2(∆P) +δ d
dt(∆P) +ξγ∆P = 0, (1)
where ∆P is the difference of pressure between the su-perior and inferior segments of the needle, δ is a con-stant dependent of the radius of the syringe and the density of the saline solution, ξ is another arbitrary normalization constant andγis a factor which depends of the radius and length of the needle. The solutions of this homogeneous differential equation have frequencies given by
ω= 1 2[−δ±
√
δ2−4γξ]. (2)
Electrical and fluid oscillations are schematically ex-hibited in Fig. 2. Experimental results show that they are synchronized, i.e., voltage oscillations occur every time solutions flow in different directions. The process can be described as follows: in the beginning, the wa-ter of the cube enwa-ters the syringe through the needle, because of the difference in levels between solutions in the interior and the exterior of the syringe (region a in Fig. 2). When this phenomenon happens, no electri-cal oscillations are perceived and this is in fact a tran-sient effect not observed in further oscillations. Note that the voltage difference is positive, because distil-lated water may, oftentimes, have a significant amount of positive ions (unwanted impurities). As time evolves, water keeps flowing to the interior of the syringe until a maximum level is achieved, which depends on the concentrations, pressure and properties of the syringe and the needle. As soon as the water flux seems to vanish, an increasing electrical potential can be noted (region b). The final potential difference value is larger than in the beginning of the process, and this might be due to a large dilution of ions inside the syringe, reducing the potential value of the reference electrode. After that, for a few moments, no flow is perceived in the system and the electric potential remains constant. The electrical signal starts to decrease synchronously when the salt solution starts to flow downward to the cube (region c). The reduction of the potential differ-ence is related to the smaller amount of liquid inside the syringe. Probably the smaller amount of liquid has a larger ion concentration. In other words, the ion density determines the potential value and the strong volume reduction can even invert the signal of the potential dif-ference. This would mean that inside the syringe exists a larger ion concentration than in the water cube at that moment. At the transition from regions c to d, water flow inverts upwards again, with correspondingly potential difference variation, and a new cycle initiates (region d). The period of each cycle was assumed to be the difference in time between the peaks P shown in the graph. As the properties of the fluids change along the time, drastic consequences can be noted in the electric behaviors.
Many geometrical factors influence the electric and dynamical behaviors of the system. Enlarging the length of the capillary, for example, increases the period of oscillations [14,20,21]. Moreover, as the diameter of the capillary increases, lower is the time for the system to reach equilibrium. There is even a critic diameter for which the regime goes from a fast to an irregular and non-oscillating behavior. To cite another exam-ple, increasing the concentration of salt, the oscillating period between upward and downward fluxes are essen-tially the same. Nevertheless, to the same situation, the electrical potential amplitude evidently raises, in consequence of the bigger number of ions [21].
Considering the important features and the simplic-ity of the experiment, a saline oscillator consists in a very useful apparatus, especially in teaching. In that sense, a system composed of copper sulfate, sodium chloride, distillated and deionized water (DI-water) was used in the present work. The diameter and length of the needle, the diameter of the syringe and the effects of the distillated and deionized water were investigated. The main focus was on experimental data and thus, be-sides the great field in numerical simulations, the saline oscillator was not investigated theoretically. This work tried to analyze the behavior of the saline oscillator when important parameters were changed.
2.
Materials and methods
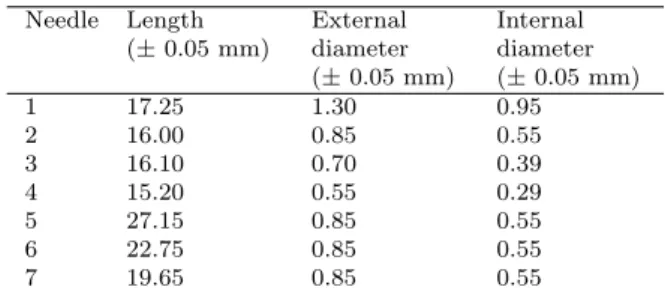
The experimental setup is shown in Fig. 1, in which two concentric reservoirs were aligned. The internal and smaller one corresponds to a conventional syringe. A hypodermic needle was used as the capillary, after modification of its sharp end by a cutting process. The main characteristics of each needle are described in Table 1. Varying concentrations of copper sulfate or sodium chloride, dissolved in DI-water, were used to fill this container as specified below. The cubic, external and bigger container was made of acrylic and had a fixed volume of 24 L (30.0 x 30.0 x 26.7 cm3).
Distil-lated water from a Pilsen distillatory TE-275 TECNAL model was used to fill the external reservoir. For every experiment, the level of the liquid in the external con-tainer was always higher than the internal one, and due to this difference, the whole oscillations process started. Before inserting the syringe in the cube, a few seconds were always awaited until the fluid in the interior of the syringe started pinging, what ensured that the air in the interior of the needle would not obstruct the free flow of copper sulfate.
The difference of electrical potentials between the two containers oscillates with time, according to mass density variations. These oscillations were detected by a pair of copper wires, each one inserted at the topmost part of each reservoir. The electric ground was always set inside the syringe and the signal was acquired in the cube using an AGILENT 34401A multimeter,
be-ing transferred to a computer through a GPIB (General Purpose–Interface Bus) 82357A board.
Table 1 - Length and diameter of the needles.
Needle Length (±0.05 mm)
External diameter (±0.05 mm)
Internal diameter (±0.05 mm)
1 17.25 1.30 0.95
2 16.00 0.85 0.55
3 16.10 0.70 0.39
4 15.20 0.55 0.29
5 27.15 0.85 0.55
6 22.75 0.85 0.55
7 19.65 0.85 0.55
The first parameter studied was the diameter of the needle. Four hypodermic needles with, approximately, the same length were used, as indicated in Table 1. The needles were numbered from 1 to 4, as a function of in-creasing diameter. A total volume of 2 mL of copper sulfate (0.5 mol/L and 1.5 mol/L) was inserted in a syringe with maximum volume of 10 mL.
The second experiment investigated the influence of the length of the needle, using a fixed diameter. Four needles with different lengths were used, see Table 1. They were numbered 2, 5, 6 and 7, respectively. The same volume and solution concentrations were used as before, as well as the 10 mL syringe.
The third study involved the diameter of the sy-ringes. In this case, the 10 mL (internal diameter of 1.50 ± 0.05 cm) syringe was substituted by a 60 mL
(internal diameter of 3.00±0.05 cm) syringe. In
addi-tion, 2 mL of copper sulfate solution with higher centration was prepared (1.5 mol/L). The higher con-centration was used in order to extend the total number of cycles,i.e., the total oscillation time, as will be dis-cussed.
Finally, the fourth and last experiment dealt with the role of unwanted ions in the larger container. For that aim, the distillated water was substituted with deionized water (DI). The deionized water was obtained by a Milli-Q unit and its conductivity was measured with a QUIMIS Q795M2 conductivimeter, calibrated with a 0.01 mol/L KCl solution. In this experiment, a 10 mL syringe was used with needle number 6. NaCl was used in place of CuSO4, because of its higher
dis-sociation constant. A concentration of 5.0 mol/L was adopted.
The analysis of the data from all four experiments was focused in the determination of the mean periods of oscillations and in the study of the different behaviors of the curves. The error propagation was calculated ac-cording to the uncertainty of the equipment and to the standard deviation of measurements.
3.
Results and discussion
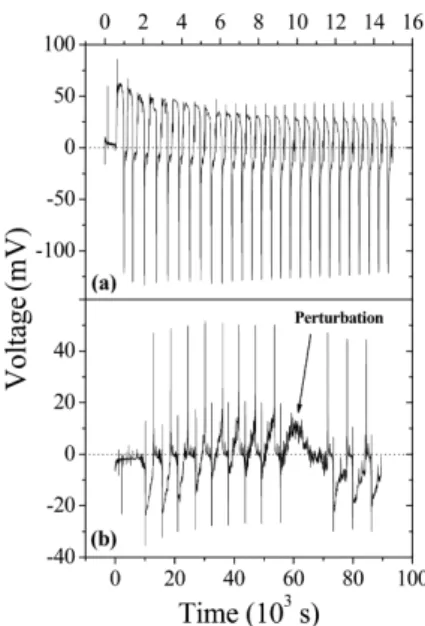
con-tainers, with the amplitude of the signal decaying expo-nentially with time, as seen in Fig. 3(a). The system is also very sensible to unwanted external perturbations such as mechanical vibrations. An example of momen-tarily interrupted oscillations is shown in Fig. 3(b). In this sense, all necessary procedures must be taken to warrant the validity of the experimental data.
Figure 3 - a) Voltage amplitude decay as a function of time for needle 6, using 2 mL of a 1.5 mol/L CuSO4solution and the 10
mL syringe b) Influence of external mechanical perturbations on the system.
It was already reported that the logarithm of the period of oscillations varies linearly with the logarithm of the diameter of the needles [20]. This has been also confirmed in this work for two different concentrations of copper sulfate, see Fig. 4. From Eqs. (1) and (2), a relation between the mean period of oscillations and the diameter of the needle can be inferred. In Eq. (2), the predominant term is the constant δ, which is directly proportional to the radius of the needle,a, elevated to the fourth power [15]. Since the radius and the diame-ter,d, are directly proportional, then
ω∝d4→logT =β−4 logd, (3)
where β depends on concentration and geometrical properties of the setup and T is the period of oscil-lations. Thus, theoretically the plot of log T x log d
should give a straight line with a negative angular co-efficient near four. Figure 4 presents our experimental data considering both, the external and internal diam-eters of the needles, resulting in linear dependences, as expected. Nevertheless, the angular coefficient corre-sponding to the external diameter shows a significant difference of 40% from the expected value. For the internal diameter, this difference was only about 1%. This was corroborated for two different copper sulfate concentrations, as shown in Fig. 4(a) and (b). The in-ternal radius shows better results, and the thickness of
the needle is an important parameter, as presumable. In summary, the results shown good relation with the theory proposed in the literature and the experiment would have great success in a teaching labs.
Figure 4 - Relation between mean period and needle diameter. Total solution of 2 mL inside the 10 mL syringe. CuSO4solutions
of a) 0.5 mol/L and b) 1.5 mol/L. Note the log-log dependence. The top graph shows angular coefficients of -5.46 ± 0.09 and
-3.98±0.06 for external and internal diameter, while the
bot-tom graph presents coefficients of -5.83±0.12 and -4.08±0.09,
respectively.
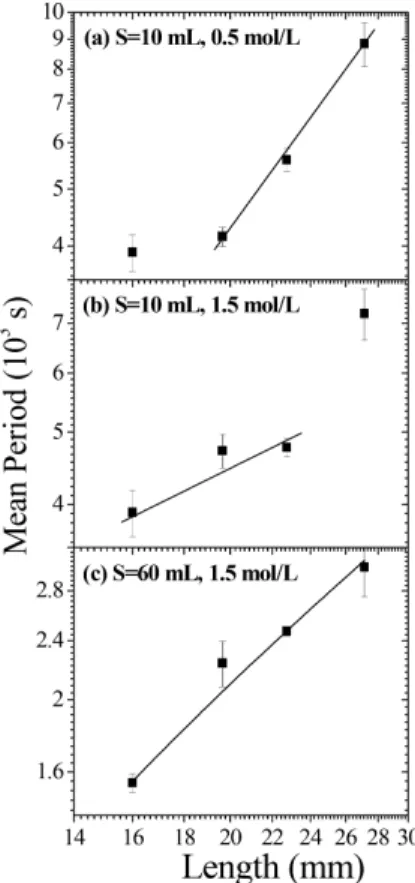
Figure 5 presents the results of the logarithm of the mean period (T) as a function of the logarithm of the length l of the needle. Two concentrations of copper sulfate were used: 0.5 mol/L, Fig. 5(a), and 1.5 mol/L, Fig. 5(b), respectively. According to Eq. (2), the pe-riod is inversely proportional to the constantδ[15], but
δis also inversely proportional to the length of the nee-dlel, what results in
logT ∝logl. (4)
Observe in Eq. (4) that the proportionality con-stant is not totally defined once it depends on the same parameter as β, in Eq. (3). According to Fig. 5, for both copper sulfate concentrations, at least one of the four points did not fit in a linear relation. For the low-est concentration the problem occurs at the shortlow-est length, the opposite being true for the highest concen-tration. We believe that the system is very sensible to external perturbations as already presented in Fig. 3. That might also be worsened for reduced syringe dimen-sions. This is illustrated by Fig. 5(c) where a bigger syringe of 60 mL was used. Note that in this case the linear behavior is present for the whole needle lengths range.
the needle, what increases the observed period. On the other hand, for larger concentrations and longer lengths, see Fig. 5(b), it is possible that an accumula-tion of solute at the internal walls of the needle leads to a slower flow behavior. That would also contribute to an increase in the observed period.
Figure 5 - Relation between mean periods and needle lengths. Total solution of 2 mL inside the 10 mL syringe. CuSO4
solu-tions of a) 0.5 mol/L and b) 1.5 mol/L. c) Relation between mean periods and needle lengths for the 60 mL syringe and the same parameters as before.
The findings of the previous experiments can also be understood in the light of Eqs. (3) and (4). They show that the period of the system is more sensitive to vari-ation in the length of the needle than in its diameter. This happens because, for the latter, a constant angular coefficient of four is predicted, while for the former this parameter depends on concentration and geometrical factors.
In order to show the influence of the syringe on the final period of oscillation, Fig. 6 presents the origi-nal results for experiments performed under the same conditions, but with syringes of varying volume and di-ameter. Figure 6(a) presents the results corresponding to the smaller syringe (volume of 10 mL and internal di-ameter of 1.50±0.05 cm), while Fig. 6(b) corresponds
to the bigger one (volume of 60 mL and internal di-ameter of 3.00±0.05 cm). The same concentration of
1.5 mol/L (CuSO4) and the same needle (number 1)
was kept constant. Note in Fig. 6(a) the inset that shows the behavior of the system for the initial
mo-ments. Once the pressure over the solution was bigger in the smaller syringe due to its smaller diameter, the time needed for the system to reach equilibrium was shorter. This shows that not only the length of the needle is responsible for the linearity between the mean period and the length of the needle, but, also, the pres-sure over the fluid. Besides the variation in the period of oscillations, a change in profile is also observed. The oscillations pattern changed drastically for different sy-ringes. As seen in Fig. 6, the oscillations last for longer times for the biggest diameter syringe. The oscillations corresponding to the smallest diameter syringe died at times at least one order of magnitude smaller. In ad-dition, the voltage difference decreased much faster in the first case. As said [12], the pressure also represents an important factor for oscillations, which was corrob-orated by the experiments.
Figure 6 - Voltage amplitude versus time for needle 1, 1.5 mol/L of CuSO4 and 2 mL of solution, using two syringes: a) 10 mL,
internal diameter of 1.50±0.05 cm and b) 60 mL, internal
di-ameter of 3.00±0.05 cm.
As previously discussed, a study involving the wa-ter of the main reservoir was accomplished. Deionized water was used in place of distillated water in order to check the influence of residual and unwanted ions in the bigger original solution. In addition, in order to use saline solutions with higher concentrations of starting solute, CuSO4 was changed to NaCl. Figure
7 presents the results for the use of needle number 6 and NaCl concentration of 5 mol/L. The smaller sy-ringe was filled with a total volume of 2 mL of this solution. Differences of about 60% in the mean period was observed between this experiment involving NaCl and another using CuSO4 (mean periods of 820 s
Figure 7 - Oscillations for needle 6, 2 mL of a 5.0 mol/L NaCl solution in the 10 mL syringe. Note that deionized water was used in this experiment.
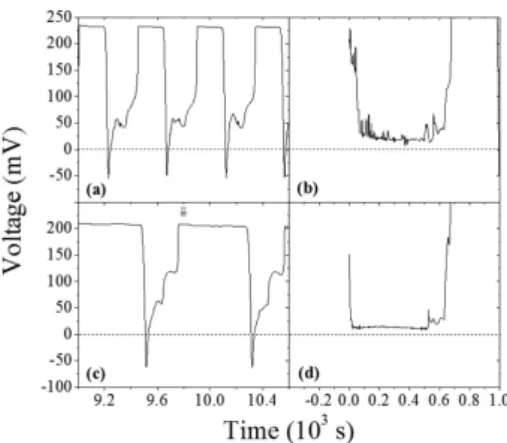
In order to keep the conductivity of the liquid of the main reservoir as the only varying parameter, ex-periments were performed and the data are presented in Fig. 8. The same conditions for the data in Fig. 7 were used, except with variations from distillated to deionized water. Figure 8(a) and (b) correspond to distillated water, while Fig. 8(c) and (d) correspond to deionized water. The difference of about 25% be-tween the electrical potential differences using distil-lated water or DI-water shows that the reduced amount of unwanted ions in the deionized water also plays an important role and is in agreement with the ratio of the conductivities of the waters in both experiments. The conductivity of deionized water was only 0.500 ±
0.003 µS/cm, while the corresponding value for distil-lated water was 2.34±0.02µS/cm (1:4.68 ratio).
Obvi-ously, for larger concentrations the system is expected to oscillate for longer times before stationary equilib-rium is reached. Note that the use of deionized water leads to smoother lines, with less noise, as compared in Fig. 8(b) and 8(d). Observe also that the mean period of oscillations using deionized water is much longer, as already discussed (820 s using DI-water and 440 s using distillated water). In this sense, if possible, teaching classes should employ deionized water in the experi-ments for better results. Nevertheless, when this is not possible, the use of distillated water would not compro-mise the final major results.
4.
Conclusions
In this work the saline oscillator was investigated us-ing saline solutions of copper sulfate and sodium chlo-ride, as well as distillated and deionized water. The essential parameters that influence the mean period of oscillation were analyzed and discussed. Good linear relations between the logarithm of the mean periods and the logarithm of the diameters, and the Logarithm of the lengths of the needle were found. The best con-ditions for linearity, especially for the latter case, were presented and discussed in order to optimize the exper-iment in teaching classes.
Figure 8 - Plots of voltage versus time comparing the use of distil-lated water (a) and (b). The corresponding results for deionized water are presented in (c) and (d). Configuration: needle 6, to-tal volume of 2 mL of a 5.0 mol/L NaCl solution in the 10 mL syringe.
The volume of the syringe played an important role considering the time during which the system exhib-ited self-sustained oscillations. In fact, this was related with the effective area of each syringe. Equilibrium was achieved faster for the larger difference in pressure.
Conductivities of the outer reservoir solutions were also measured. According to the experiments, deion-ized water was better suited, since it shows less noises, as well as longer mean periods along the experiment. However, if deionized water is not available, distillated water can be used instead, without compromising the major results and the learning of the topics involved.
In that sense, the saline oscillator can be employed in physics and biology classes, with great applications in understanding fluid dynamics and membrane theo-ries, as examples. Furthermore, important contribu-tions could be added to the experiments conciliating numerical simulations of non-linear systems.
Acknowledgements
This work was funded by CNPq, Brazil. The authors thank J.L. Aziani, T.Z. Pavan, V.R. Balbo, and C.A. Brunello.
References
[1] K. Yoshikawa, N. Oyama, M. Shoji and S. Nakata, The American Journal of Physics59, 137 (1991).
[2] K. Yoshikawa, S. Nakata, M. Yamanaka and T. Waki, Journal of Chemical Education66, 205 (1989).
[3] K. Yoshikawa, K. Fukunaga and H. Kawakami, Chem-ical Physics Letters174, 203 (1990).
[4] P.-H. Alfredsson and T. Lagerstedt, Physics of Fluids
24, 10 (1981).
[6] R. Cervellati and R. Solda, The American Journal of Physics69, 543 (2001).
[7] S. Nakata, H. Kitahata, A. Terada and T. Matsuyama, Chemical Physics Letters351, 379 (2002).
[8] Y. Takemoto, S. Chiba, M. Okamura, K. Yoshikawa, Computational Technologies1, 82 (1996).
[9] H. Kitahata, A.Yamada and S. Nakata, Journal of Chemical Physics119, 9 (2003).
[10] U. Roy, S.K. Saha, C.R.K. Priya, V. Jayashree and R.C. Srivastava, Instrumentation Science & Technol-ogy31, 425 (2003).
[11] T. Teorell, The Journal of General Physiology 42, 831 (1959).
[12] T. Teorell, The Journal of General Physiology 42, 847 (1959).
[13] S. Martin, 1970apud Ref. [7].
[14] O. Steinbock, A. Lange and I. Rehberg, Physical Re-view Letters81, 798 (1998).
[15] A.K. Das and A. Rao, in:National Conference on Non-linear System & Dynamics, NCNSD, in Hydrodynamic Oscillator - A Simple Non-Linear Dynamical System
(2003).
[16] K. Yoshikawa, Dynamical System and Applications, edited by N. Aoki (World Scientific, Singapore, 1987).
[17] M. Okamura and K. Yoshikawa, Physical Review E61, 2445 (2000).
[18] T. Kano and S. Kinoshita, Physical Review E 76, 046208 (2007).
[19] M. Ueno, F. Uehara, Y. Narahara and Y. Watanabe, Japanese Journal of Applied Physics45, 8929 (2006).
[20] R.P. Rastogi, R.C. Srivastava and S. Kumar, Journal of Colloid and Interface Science283, 139 (2005).