Micronutrients affecting leaf biochemical
responses during pineapple development
Aiala Vieira Amorim
1, Claudivan Feitosa de Lacerda
2, Elton Camelo Marques
3,
Francisco Jardelson Ferreira
2, Ricardo José da Costa Silva Júnior
2,
Francisco Luciano Andrade Filho
2, Enéas Gomes-Filho
3*1Universidade da Integração Internacional da Lusofonia Afro-brasileira, Redenção, CE, Brazil. 2Agricultural Engineering Department, Universidade Federal do Ceará (UFC), Fortaleza, CE, Brazil.
3Biochemistry and Molecular Biology Department, Instituto Nacional de Ciência e Tecnologia em Salinidade, UFC, Fortaleza, CE, Brazil.
*Corresponding author: [email protected]
Received: November 27, 2012; Accepted: April 08, 2013
ABSTRACT: An adequate mineral nutrition is essential for the development and productivity of pineapple. However, little is known about the
nutritional and metabolic changes that occur in this crop in response to micronutrient deficiency or excess, particularly on tropical conditions.
Thus, the objective of this study was to evaluate the application effects of micronutrients in soil and in leaf on biochemical responses of leaves during the development cycle of the pineapple crop. Samples were collected at 3, 6, 9, 12, and 17 months after transplantation. Leaf soluble carbohydrates and N-aminosoluble compounds were determined, as well as variations in the titratable acidity and pH. The soil and leaf micronutrient application increased the concentrations of carbohydrates and N-aminosoluble and reduced the leaf pH, and the changes
were more significant in the last sampling (17 months after transplantation). Reductions in concentrations of carbohydrates and increase
in the titratable acidity of the pineapple leaves collected at the end of the night were also observed, a fact that reflects the metabolism of Crassulacean acid metabolism species. The strategy of micronutrient application contributes positively to alter the metabolism of plants
of pineapple cv. Victoria, especially during flowering and fruit development.
KEYWORDS:Ananas comosus, carbohydrates, metabolism, mineral nutrition, titratable acidity.
The pineapple has always stood out in the horticulture, not only due to the qualities of its fruit, but also because of the high profitability and social importance, being an activ-ity that requires labor-intensive in the field. Monitoring of the plant metabolism is important as vigorous plants with adequate mineral nutrition may produce a high-quality fruit (Soares et al. 2005, Agbangba et al. 2011).
When analyzing the photosynthetic metabolism, notably the cycle of carbon reduction, it was found that higher plants and algae developed mechanisms of CO2 concentration, which minimize losses related to photorespiration and enhance water use efficiency (Leegood 2002, Moroney and Ynalvez 2007). Crassulacean acid metabolism (CAM) is a striking example of convergent evolution
that substantially improves plant water use efficiency, exceeding those of C4 and C3 plants by at least three and six times, respec-tively, enabling partial or predominant uptake of CO2 at night. At least 343 genera in 35 plant families are known to engage this photosynthetic specialization (Borland et al. 2011).
to maintain a positive carbon balance under a wide range of environmental stresses (Keller and Luttge 2005, José, Montes and Nikonova 2007).
The inadequate supply of a particular nutrient in the pine-apple crop often results in metabolic and nutritional disorders that can compromise growth, yield, and fruit quality (Soares et al. 2005, Vieira et al. 2010). However, little is known about the nutritional and metabolic changes that happen in this crop in response to micronutrient deficiency or excess, particularly on tropical conditions (Siebeneichler et al. 2008, Feitosa et al. 2011, Maeda et al. 2011). The most important micronutri-ents in pineapple are iron, zinc, copper, and boron (Su 1975). The supply of micronutrients in pineapple crop can be done by solid or liquid applications, the latter being the most used (Reinhardt and Cunha 2010). However, information that relates these types of micronutrient application with changes in metabolism during the development of this crop are rarely reported (Bartholomew et al. 2003). Therefore, the aim of this study was to evaluate the effects of soil and leaf application of micronutrients on leaf biochemical responses during the pine-apple crop cycle.
The experiment was conducted from December 2008 to October 2010 in an irrigated area located in Marco county, at the Northern region of State of Ceará, Brazil (3°07’13’’S and 40°05’13’’W). According to the Köppen’s classification, the climate type is Aw’ (tropical raining). The experimental area soil is classified as “Typic Quartzipsamment”, with a sandy texture and density of 1.590 kg m-3. The soil chemical
char-acteristics at 0 to 20 cm depth are: pH=5.8; EC=0.15 dS m-1;
and 0.77, 0.30, 0.08, 0.02, and 0.75 cmolc kg-1 of Ca, Mg, K,
Na, and Al, respectively.
The experimental design was in split plot with four levels of soil fertilization, four of leaf fertilization, and five sampling times with 90 days intervals, including five repetitions. Each plot consisted of four subplots, having four double rows with 11 plants in each, and the evaluations were taken at the two central lines of every subplot. The experimental areas were mulched with bagana (the straw resulting from the extraction of the carnauba wax sheet) of carnauba (Copernicia prunifera).
For the soil fertilization, the commercial micronutrient formulation FTE-12 (9, 1.8, 0.8, 3 and 3% of Zn, B, Cu, Fe and Mn, respectively) was used. It was applied in the pits of each plot before planting at doses of 0, 60, 120, and 180 kg ha-1. The
four levels of leaf fertilization were: LF0 (no fertilizer); LF1 (15 leaf fertilization applications, using 1158.8, 844.7, 391.5, 322.7, and 216.0 g ha-1 of Fe, Mn, Zn, Cu, and B, respectively);
LF2 (15 leaf fertilization applications, using twice the quanti-ties applied in LF1); and LF3 (15 leaf fertilization applications, using three times the amount in LF1).
The leaf fertilization with micronutrients was performed monthly, and the concentrations were defined having as reference the modified Murashige and Skoog (1962) nutrient solution. The concentrations of the salts used in the micronutrient solution for-mulation in the first two applications are shown in Table 1. These initial ones were doubled in the three following usages, tripled in three other ones and quadrupled in the last seven. To facilitate uptake of micronutrients, it was used urea 2%, which was added to all treatments from the third to the last application. The total vol-ume of the solution in each application was 463 L ha-1.
Macronutrients were applied to all plants via fertigation beginning two months after transplanting, following the same procedure done by producers. The total applied and the fertiliz-ers used were as follows: 688, 797, 98, 80, 20 e 24 kg ha-1 of urea,
K2SO4, H3PO4, NH4H2PO4, Ca(NO3)2 and MgSO4, respectively. Ninety days-old pineapple seedlings (Ananas comosus L. Merril) cv. Vitória , which is a cultivar resistent to fusariosis (Ventura et al. 2009), were transferred from trays to black poly-ethylene plastic bags containing sand as substrate, with 800 g m-3
of simple superphosphate. They were acclimated under shade cloth with 50% of shading for six months and irrigated twice a week with water (electrical conductivity of 0.44 dS m-1) during
this period. Transplantation was performed in April 2009, when the plants reached about 150 mm; they were arranged in double rows, spaced 0.9 x 0.4 x 0.3 m, with an area of 19.2 m wide and 44.0 m long, totaling 7,040 plants in 0.174 ha.
The leaf samples were taken at 3, 6, 9, 12, and 17 months after transplantation (MAT), the first four coinciding with the period of vegetative growth and the fifth corresponded to the time of development of inflorescences, as it was done about a month before harvesting. In each period, two leaves “D” (the leaf of greater length among the youngest of pineapple) were taken randomly in two plants of each subplot. They were col-lected in the late afternoon (between 4 and 5 pm) and in the end of the night (between 4 and 5 am). The environmental conditions in each sampling time are shown in Table 2.
The leaves were wrapped in foil and stored in a refrigerator at -20°C for about 72 hours. The frozen ones were ground in a mortar and whole juice from leaf tissues obtained was placed in
Table 1. Salt concentrations (g L-1) used in the formulation of
micronutrients solution in the first two applications for different
treatments
Salts LF0 LF1 LF2 LF3
Eppendorf tubes and immediately frozen to be used for deter-minations of soluble carbohydrates (Dubois et al. 1956) and N-aminosoluble compounds (Yemm and Cocking 1955). The rest of the juice and the residue resulting from grinding were used for the measurement of pH and titratable acidity (TA). For these determinations, samples of 1.0 g were weighted and
diluted with deionized water at a ratio of 1:50. The pH was determined by a pH meter. Then, three drops of a 1% phe-nolphthalein solution were added for determination of TA by titration with 0.1 N NaOH solution (IAL 1985).
The data were submitted to analysis of variance (ANOVA), and the regression one was performed for data in which signif-icant (p<0.05) effects occurred.
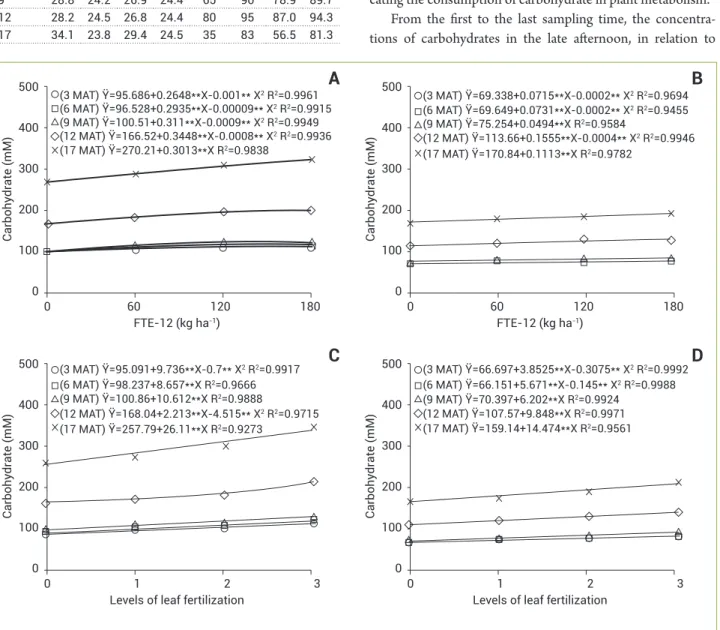
The two forms of micronutrients application caused increases in the concentration of carbohydrates in both late afternoon and in the end of the night (Figure 1). Regarding the sampling times, it was found that the highest responses were obtained at 12 and 17 MAT. Furthermore, it was concluded that the concentrations of soluble carbohydrates at the late afternoon were higher than those at the end of the night, indi-cating the consumption of carbohydrate in plant metabolism.
From the first to the last sampling time, the concentra-tions of carbohydrates in the late afternoon, in relation to
Table 2. Air temperature (T) and relative humidity (RH) at 5 and
16 hours; the average temperature (TL) and relative humidity
(RHL) of the light period; and the average temperature (TN) and relative humidity (RHN) at night.
Months T16 T5 TL TN RH16 RH5 RHL RHN
(ºC) (%)
3 26.7 21.7 23.8 22.1 77 95 91.5 94.2
6 33.6 22.9 28.8 23.5 41 88 61.4 86.3
9 28.8 24.2 26.9 24.4 65 90 78.9 89.7
12 28.2 24.5 26.8 24.4 80 95 87.0 94.3
17 34.1 23.8 29.4 24.5 35 83 56.5 81.3
500
(3 MAT) Ϋ=95.686+0.2648**X-0.001** X2 R2=0.9961
(12 MAT) Ϋ=166.52+0.3448**X-0.0008** X2 R2=0.9936
(17 MAT) Ϋ=270.21+0.3013**X R2=0.9838
(9 MAT) Ϋ=100.51+0.311**X-0.0009** X2 R2=0.9949
(6 MAT) Ϋ=96.528+0.2935**X-0.00009** X2 R2=0.9915
400
300
200
100
0
0 60 120 180
FTE-12 (kg ha-1)
Carbohy
drate
(mM)
A
500(3 MAT) Ϋ=69.338+0.0715**X-0.0002** X2 R2=0.9694
(12 MAT) Ϋ=113.66+0.1555**X-0.0004** X2 R2=0.9946
(17 MAT) Ϋ=170.84+0.1113**X R2=0.9782
(9 MAT) Ϋ=75.254+0.0494**X R2=0.9584
(6 MAT) Ϋ=69.649+0.0731**X-0.0002** X2 R2=0.9455
400
300
200
100
0
0 60 120 180
FTE-12 (kg ha-1)
Carbohy
drate
(mM)
B
500 (3 MAT) Ϋ=95.091+9.736**X-0.7** X2 R2=0.9917
(12 MAT) Ϋ=168.04+2.213**X-4.515** X2 R2=0.9715
(17 MAT) Ϋ=257.79+26.11**X R2=0.9273
(9 MAT) Ϋ=100.86+10.612**X R2=0.9888
(6 MAT) Ϋ=98.237+8.657**X R2=0.9666
400
300
200
100
0
0 1 2 3
Levels of leaf fertilization
Carbohy
drate
(mM)
C
500(3 MAT) Ϋ=66.697+3.8525**X-0.3075** X2 R2=0.9992
(6 MAT) Ϋ=66.151+5.671**X-0.145** X2 R2=0.9988
(17 MAT) Ϋ=159.14+14.474**X R2=0.9561
(9 MAT) Ϋ=70.397+6.202**X R2=0.9924
(12 MAT) Ϋ=107.57+9.848**X R2=0.9971
400
300
200
100
0
0 1 2 3
Levels of leaf fertilization
Carbohy
drate
(mM)
D
Figure 1. Concentrations of soluble carbohydrates in the leaves of pineapple cv. Vitória as a function of FTE-12 (A and B) doses and levels of foliar fertilization (C and D) at five sampling times (3, 6, 9, 12, and 17 months after transplantation), analyzed at late afternoon
FTE-12 doses, ranged from 95.69 to 270.21 mM (1.8 times increase) at the dose of 0 and from 110.95 to 324.44 mM (1.9 times increase) for the treatment containing 180 kg ha-1
FTE-12 (Figure 1A). At the end of the night, the variation was from 69.34 to 170.84 mM (1.5 times increase) for plants that were not receiving FTE-12, and from 75.73 to 190.87 mM (1.5 times increase) at the highest dose of this micronutrient formulation (Figure 1B). Similar results were observed when using increasing levels of leaf fertilization (Figures 1C and D).
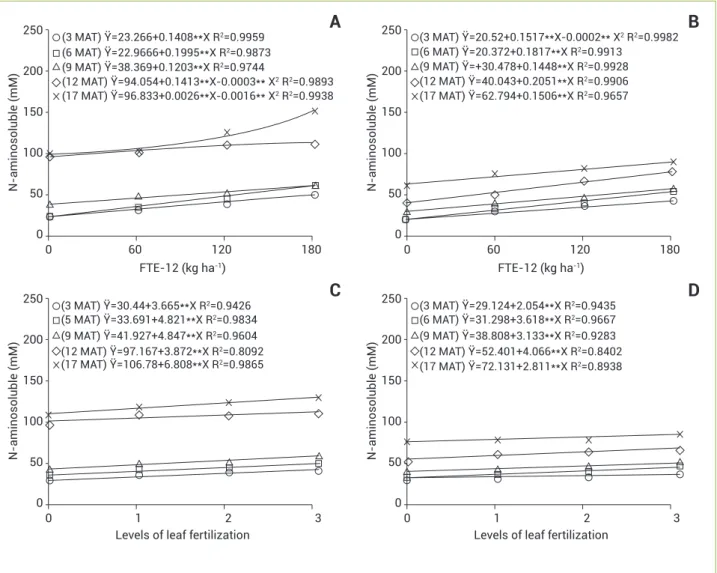
Likewise the concentrations of soluble carbohydrates, leaf concentrations of N-aminosoluble compounds also showed increments provided by the two types of the micronutrient application (Figure 2), with the highest values observed at 12 and 17 MAT. The increase was linear for almost all plants, except for those subjected to treatment with FTE-12 at 12 and 17 MAT in those harvested at late afternoon (Figure 2A) and to
those taken at 3 MAT at the end of the night (Figure 2B), which showed quadratic behavior.
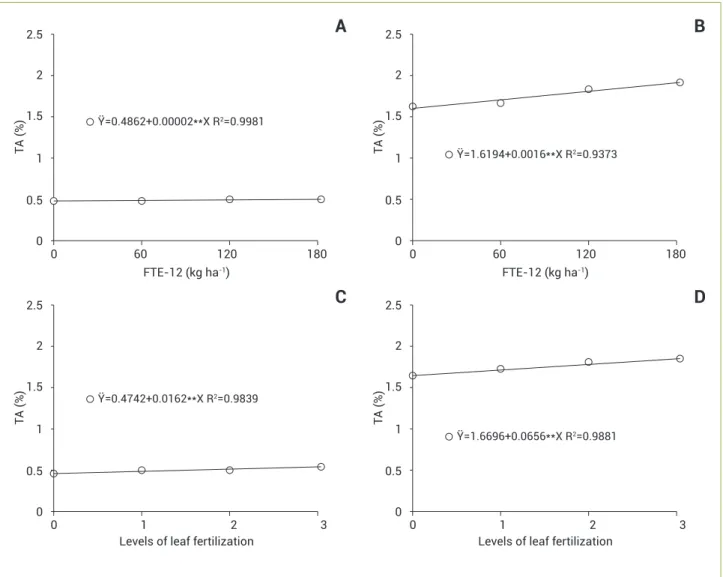
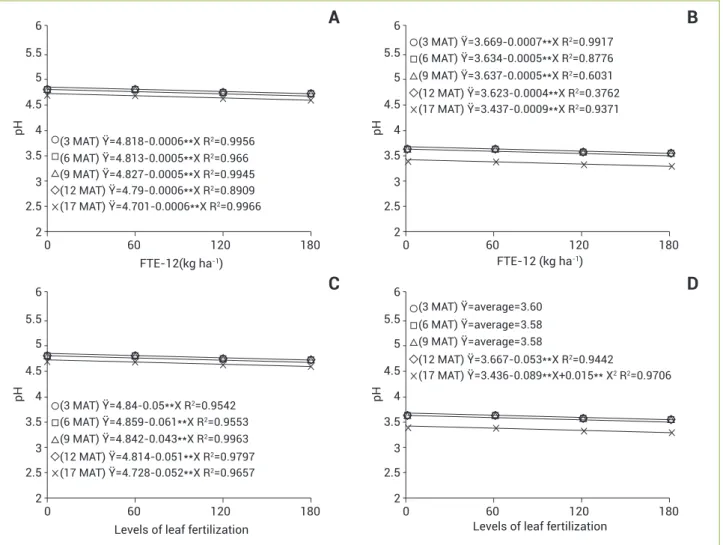
Despite TA not be changed significantly throughout the crop cycle, there were increases in TA in both types of micro-nutrient application (Figure 3), and the values at the end of the night were higher than those at late afternoon. The leaf pH values found herein decreased with increasing doses of micronutrients applied (Figure 4). The average of leaf pH changed from 4.74 at late afternoon to 3.5 at the end of the night, noting that the oscillations in TA between nighttime and day time on the leaves of pineapple were consistent with the values of pH in each period, therefore there is an inverse relationship between these variables.
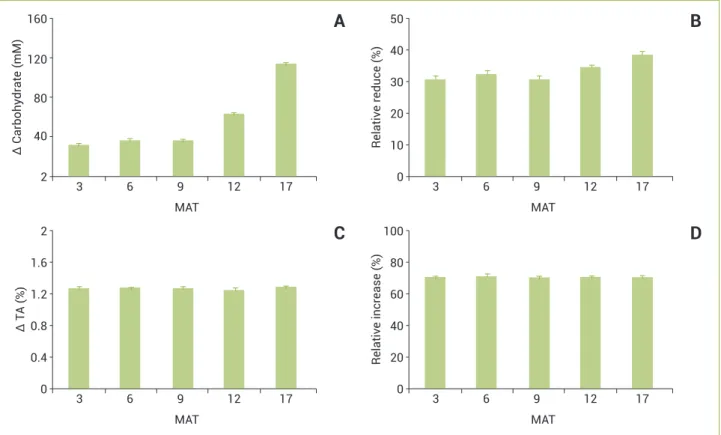
Making up a joint analysis of variations in the concentra-tion of carbohydrates between the end of the day and night, we observed that the largest differences occurred at the 12 and 17
250
(17 MAT) Ϋ=96.833+0.0026**X-0.0016** X2 R2=0.9938
(12 MAT) Ϋ=94.054+0.1413**X-0.0003** X2 R2=0.9893
(9 MAT) Ϋ=38.369+0.1203**X R2=0.9744
(6 MAT) Ϋ=22.9666+0.1995**X R2=0.9873
(3 MAT) Ϋ=23.266+0.1408**X R2=0.9959
200
150
100
50
0
0 60 120 180
FTE-12 (kg ha-1)
N-aminosoluble
(mM)
A
250(3 MAT) Ϋ=20.52+0.1517**X-0.0002** X2 R2=0.9982
(12 MAT) Ϋ=40.043+0.2051**X R2=0.9906
(17 MAT) Ϋ=62.794+0.1506**X R2=0.9657
(9 MAT) Ϋ=+30.478+0.1448**X R2=0.9928
(6 MAT) Ϋ=20.372+0.1817**X R2=0.9913
200
150
100
50
0
0 60 120 180
N-aminosoluble
(mM)
B
FTE-12 (kg ha-1)
250
(17 MAT) Ϋ=106.78+6.808**X R2=0.9865
(12 MAT) Ϋ=97.167+3.872**X R2=0.8092
(9 MAT) Ϋ=41.927+4.847**X R2=0.9604
(5 MAT) Ϋ=33.691+4.821**X R2=0.9834
(3 MAT) Ϋ=30.44+3.665**X R2=0.9426
200
150
100
50
0
0 1 2 3
N-aminosoluble
(mM)
C
Levels of leaf fertilization
250
(3 MAT) Ϋ=29.124+2.054**X R2=0.9435
(6 MAT) Ϋ=31.298+3.618**X R2=0.9667
(9 MAT) Ϋ=38.808+3.133**X R2=0.9283
(12 MAT) Ϋ=52.401+4.066**X R2=0.8402
(17 MAT) Ϋ=72.131+2.811**X R2=0.8938
200
150
100
50
0
0 1 2 3
N-aminosoluble
(mM)
D
Levels of leaf fertilization
Figure 2. Concentrations of N-aminosoluble compounds in leaves of pineapple cv. Vitória as a function of FTE-12 (A and B) doses and levels of foliar fertilization (C and D) at five sampling times (3, 6, 9, 12 and 17 months after transplantation), analyzed at late afternoon
MAT (Figure 5). While at the first sampling time this variation was 33.6 mM, it reached 116.5 mM at the last (Figure 5A).
Analyzing the relative reductions in the concentrations of soluble carbohydrates (late night towards the end of the day), it was also observed that the largest reductions occurred at the last sampling time (Figure 5B); however, the differences were less pronounced than the changes in absolute terms (Figure 5A). While in the first sampling time there is a reduction in carbohydrates concentrations of 30.9%, in the last sampling it reached a 38.7% value. On the other hand, variations in TA were relatively small throughout the crop cycle (Figures 5C and D). TA showed increases of over 70% during the night, indicating the occurrence of CAM metabolism.
The highest accumulation of carbohydrates observed at the last sampling (Figure 1) can be explained in part by the phys-iological stage of plant development. During the formation of
pineapple inflorescences, there is an increased demand for car-bohydrate and other organic solutes. According to Carvalho et al. (1991), concentrations of total sugars in leaves of Smooth Cayenne pineapple were higher at the harvest of inflorescences. The lowest leaf concentrations of soluble carbohydrates at night compared to day time (Figure 1) can be explained con-sidering the nocturnal acidification of CAM plants (Ceuters et al. 2009). According to Borland and Taybi (2004), the circadian clock plays a central role in controlling many of the metabolic, transport, and physiological components of CAM. The level of control exerted by the clock can range from transcriptional to post-translational regulation, depend-ing on genes, proteins, and even plant species. Further con-trol is provided by metabolites, including organic acids and carbohydrates, which show substantial reciprocal fluctua-tions in content over the daily cycle.
2.5
2
1.5
1
0.5
0
Ϋ=0.4862+0.00002**X R2=0.9981
0 60 120 180
T
A
(%)
A
FTE-12 (kg ha-1)
2.5
2
1.5
1
0.5
0
Ϋ=1.6194+0.0016**X R2=0.9373
0 60 120 180
T
A
(%)
B
FTE-12 (kg ha-1)
2.5
2
1.5
1
0.5
0
Ϋ=0.4742+0.0162**X R2=0.9839
0 1 2 3
T
A
(%)
C
Levels of leaf fertilization
2.5
2
1.5
1
0.5
0
Ϋ=1.6696+0.0656**X R2=0.9881
0 1 2 3
T
A
(%)
D
Levels of leaf fertilization
The carbohydrate used for the synthesis of organic acids can vary between CAM species. While pineapple uses soluble car-bohydrates, in most plants the starch is the source of hexoses for malate synthesis (Carnal and Black 1989, Cushman et al. 2008). Study conducted by Chen, Lin and Nose (2002) demonstrated in CAM plants the occurrence of increases in concentrations of glucose-6-phosphate, fructose-6-phosphate and glucose-1-phos-phate at the early hours of the night and decreases at the end of this period. The results suggest that hexoses-P produced in gly-colysis may be in more excess than that required to malate accu-mulation during the first part of dark period, while the opposite may be the case during its latter part. These authors also found that the concentrations of the abovementioned three hexoses were higher in leaves of pineapple than in two other CAM spe-cies: Kalanchoe daigremontiana and K. pinnata.
The highest leaf concentrations of N-aminosoluble com-pounds at the last two sampling periods (Figure 2) may be
6 5.5 5 4.5 4 3.5 3 2.5 2
(9 MAT) Ϋ=4.827-0.0005**X R2=0.9945
(17 MAT) Ϋ=4.701-0.0006**X R2=0.9966
(12 MAT) Ϋ=4.79-0.0006**X R2=0.8909
(6 MAT) Ϋ=4.813-0.0005**X R2=0.966
(3 MAT) Ϋ=4.818-0.0006**X R2=0.9956
0 60 120 180
FTE-12(kg ha-1)
pH
A
65.5 5 4.5 4 3.5 3 2.5 2
(9 MAT) Ϋ=3.637-0.0005**X R2=0.6031
(17 MAT) Ϋ=3.437-0.0009**X R2=0.9371
(12 MAT) Ϋ=3.623-0.0004**X R2=0.3762
(6 MAT) Ϋ=3.634-0.0005**X R2=0.8776
(3 MAT) Ϋ=3.669-0.0007**X R2=0.9917
0 60 120 180
FTE-12 (kg ha-1)
pH
B
6 5.5 5 4.5 4 3.5 3 2.5 2
(9 MAT) Ϋ=4.842-0.043**X R2=0.9963
(17 MAT) Ϋ=4.728-0.052**X R2=0.9657
(12 MAT) Ϋ=4.814-0.051**X R2=0.9797
(6 MAT) Ϋ=4.859-0.061**X R2=0.9553
(3 MAT) Ϋ=4.84-0.05**X R2=0.9542
0 60 120 180
Levels of leaf fertilization
pH
C
65.5 5 4.5 4 3.5 3 2.5 2
(17 MAT) Ϋ=3.436-0.089**X+0.015** X2 R2=0.9706
(12 MAT) Ϋ=3.667-0.053**X R2=0.9442
(3 MAT) Ϋ=average=3.60 (6 MAT) Ϋ=average=3.58 (9 MAT) Ϋ=average=3.58
0 60 120 180
Levels of leaf fertilization
pH
D
Figure 4. pH in leaves of pineapple cv. Vitória as a function of FTE-12 (A and B) doses and levels of foliar fertilization (C and D) at
five sampling times (3, 6, 9, 12 and 17 months after transplantation), analyzed at late afternoon (A and C) and at the end of the night (B and D). *p<0.05; **p<0.01.
Figure 5. Diurnal and nocturnal changes in concentrations of soluble carbohydrates (A) and titratable acidity (C) with their respective percentage of decrease or increase (B and D), in leaves of pineapple cv. Vitória at five sampling times (3, 6, 9, 12 and 17 months after transplantation).
2 40 80 120 160
3 6 9 12 17
MAT
∆
Carbohy
drate
(mM)
A
0 20 10 30 40 50
3 6 9 12 17
MAT
Relativ
e
reduce
(%)
B
0 0.8 0.4 1.2 1.6 2
3 6 9 12 17
MAT
∆
T
A
(%)
C
0 40 20 60 80 100
3 6 9 12 17
MAT
Relativ
e
incr
ease
(%)
D
Changes in pH and TA between day and night (Figures 3 and 4) reflect variations in acidity due to foliar CAM metabo-lism, with malate being the primary organic acid associated with increased acidity in pineapple plants (Medina et al. 1993, Chen et al. 2002). Nievola et al. (2005) conducted a study with Smooth Cayenne pineapple seedlings under two temperature regimes, 28°C for 24 hours and 28/15°C day/night, and found an increase in TA only when there was a reduction in night tem-perature. These authors concluded that pineapple plants acted as C3 ones when night temperatures remained high.
Differences in air temperature of about 5ºC between day and night were recorded throughout the crop cycle (Table 2), which may explain the increase in TA associated with CAM metabolism. However, it is possible the occurrence of C3 metabolism, especially at the late afternoon, when the sup-ply of CO2 generated by decarboxylation of organic acids, does not follow the demand of carbon dioxide for Calvin’s cycle (Borland et al. 2011). According to Drennan and Nobel (2000) and Cushman (2001), when some CAM plants are under adequate soil moisture, the stomata can be opened during the day and closed at night; therefore, it presents metabolism similar to that of C3 plants. However, work conducted with three genotypes of pineapple plants
demonstrated that they remained with the stomata closed most of the day, even with good water supply, and stomatal conductance equals to zero between 9 and 3 pm (Barreiro Neto et al. 2009). According to this study, the stomata began to open around 5 pm, stabilizing between 8 and 11:45 pm, with values of stomatal conductance from 2.8 to 2.7 mm s-1 in
Perola cultivar, 4.2 to 4.8 mm s-1 and 3.5 to 3.9 mm s-1 in the
hybrid Purple of Smooth Cayenne.
Soil and leaf application of micronutrients pro-vided increases in concentrations of carbohydrates and N-aminosoluble compounds and reduction in leaf pH of pineapple plants, in both diurnal and nocturnal evaluations. The effects provided by treatments with micronutrients in the plant metabolism studied were more significant at the last sampling (17 MAT), when plants required a greater amount of organic compounds for the final process of inflo-rescence formation. Reductions in leaf concentrations of carbohydrates and increases in the acidity of leaves col-lected at the end of the night confirm the CAM metabolism
Agbangba EC, Olodo GP, Dagbenonbakin GD, Kindomihou
V, Akpo LE, Sokpon N (2011) Preliminary DRIS model
parameterization to access pineapple variety ‘Perola’ nutrient status in Benin (West Africa). African Journal of Agricultural Research 6:5841-5847.
Barreiro Neto M, Fernandes PD, Gheyi HR, Santos ES, Fontinelli ISC
(2009) Condutância estomática em genótipos de abacaxizeiro
sob estresse salino. In: Anais do XII Congresso Brasileiro de
Fisiologia Vegetal, Fortaleza, Ceará, Brazil. p. 212.
Bartholomew DP, Paull RE, Rohrbach KG (2003) The pineapple: botany, production and uses. CAB International, Wallingford. Borland AM, Taybi T (2004) Synchronization of metabolic processes in plants with Crassulacean acid metabolism. Journal of Experimental Botany 55:1255-1265.
Borland AM, Zambrano VAB, Ceusters J, Shorrock K (2011) The
photosynthetic plasticity of crassulacean acid metabolism: an evolutionary innovation for sustainable productivity in a changing world. New Phytologist 191:619-633.
Carnal NW, Black CC (1989) Soluble sugars as the carbohydrate reserve for CAM in pineapple leaves: implications for the role of pyrophosphate:6-phosphofructokinase in glycolysis. Plant Physiology 90:91-100.
Carvalho VD, Paula MB, Abreu CMP, Chagas SJR (1991) Efeito da
época de colheita da planta na composição química das folhas de abacaxizeiro. Pesquisa Agropecuária Brasileira 26:1655-1661.
Ceusters J, Borland AM, Londers E, Verdoodt V, Godts C, Proft MP
(2009) Differential usage of storage carbohydrates in the CAM bromeliad Aechmea ‘Maya’ during acclimation to drought and recovery from dehydration. Physiologia Plantarum 135:174-184. Chen LS, Lin Q, Nose A (2002) A comparative study on diurnal changes in metabolite levels in the leaves of three crassulacean acid metabolism (CAM) species, Ananas comosus, Kalanchoe daigremontiana and K. pinnata. Journal of Experimental Botany 53:341-350.
Cushman JC (2001) Crassulacean acid metabolism. A plastic photosynthetic adaptation to arid environments. Plant Physiology 127:1349-1448.
Cushman JC, Agarie S, Albion S, Elliot SM, Taybi T, Borland AM (2008) Isolation and characterization of mutants of ice plant,
Mesembryanthemum crystallinum, defective in Crassulacean acid metabolism. Plant Physiology 147:228-238.
Drennan PM, Nobel PS (2000) Responses of CAM species to increasing atmospheric CO2 concentrations. Plant, Cell and Environment 23:767-781.
Dubois M, Gilles KA, Hamilton JK, Rebers PA, Smith F (1956) Colorimetric method for determination of sugars and related substances. Analytical Chemistry 28:350-356.
Feitosa HO, Amorim AV, Lacerda CF, Silva FB (2011) Growth and micronutrients extraction by ‘Vitoria’ pineapple. Revista Brasileira
de Fruticultura 33:706-712.
Huppe HC, Turpin DH (1994) Integration of carbon and nitrogen metabolism in plant and algal cells. Annual Review of Plant Physiology and Plant Molecular Biology 45:577-607.
Instituto Adolfo Lutz – IAL (1985) Normas analíticas, métodos químicos e físicos para análise de alimentos. 3. ed. São Paulo, IAL. José JS, Montes R, Nikonova N (2007) Seasonal patterns of carbon dioxide, water vapour and energy fluxes in pineapple. Agricultural and Forest Meteorology 147:16-34.
Keller P, Luttge U (2005) Photosynthetic light-use by three bromeliads originating from shaded sites (Ananas ananassoides, Ananas comosus cv. Panare) and exposed sites (Pitcairnia pruinosa) in the
medium Orinoco basin, Venezuela. Biologia Plantarum 49:73-79.
Leegood RC (2002) C4 photosynthesis: principles of CO2 concentration and prospects for its introduction into C3 plants. Journal of Experimental Botany 53:581-590.
Maeda AS, Buzetti S, Boliani AC, Benett CGS, Teixeira Filho MCM, Andreotti M (2011) Foliar fertilization on pineapple quality and yield. Pesquisa Agropecuária Tropical 41:248-253.
Mansour MMF (2000) Nitrogen containing compounds and adaptation of plants to salinity stress. Biologia Plantarum 43:491-500.
Martín M, Rius SB, Podestá FE (2011) Two phosphoenolpyruvate carboxykinases coexist in the Crassulacean Acid Metabolism plant REFERENCES
of pineapple plants. In relative terms, leaf carbohydrates and acidity were not affected either by application of micronu-trients nor plant age. It could be concluded that the strategy of soil and leaf micronutrients application may help to alter positively the metabolism of pineapple plants, especially during flowering and fruit development.
ACKNOWLEDGEMENTS
We thank Banco do Nordeste do Brasil (BNB) and Conselho
Nacional de Desenvolvimento Científico e Tecnológico (CNPq)
Ananas comosus. Isolation and characterization of the smaller 65 kDa form. Plant Physiology and Biochemistry 49:646-653. Medina E, Popp M, Olivares E, Janett HP, Lüttge U (1993) Daily fluctuations of titratable acidity, content of organic acids (malate and citrate) and soluble sugars of varieties and wild relatives of
Ananas comosus L. growing under natural tropical conditions. Plant, Cell and Environment 16:55-63.
Moroney JV, Ynalvez RA (2007) Proposed carbon dioxide
concentrating mechanism in Chlamydomonas reinhardtii. Eukaryotic Cell 6:1251-1259.
Murashige T, Skoog F (1962) A revised medium for rapid growth and bioassays with tobacco tissue culture. Physiologia Plantarum 15:473-497.
Nievola CC, Kraus JE, Freschi L, Souza BM, Mercier H (2005) Temperature determines the occurrence of CAM or C3 photosynthesis in pineapple plantlets grown in vitro. In Vitro
Cellular and Developmental Biology-Plant 41:832-837.
Reinhardt DH, Cunha GAP (2010) Cultivo do abacaxizeiro. Jaboticabal, Funep. 45 p.
Siebeneichler SC, Monnerat PH, Carvalho AJC, Silva JA (2008) Boro in pineapple plants ‘Pérola’ in the north fluminense - contents, distribution and characteristics of the fruit. Revista Brasileira de Fruticultura 30:787-793.
Soares AG, Trugo LC, Botrel N, Sousa LFS (2005) Reduction of internal browning of pineapple fruit (Ananas comusus L.) by preharvest soil application of potassium. Postharvest Biology and Technology 35:201-207.
Su NR (1975) Micronutrient problems in pineapples. Taipei, ASPAC/Food and Fertilizer Technology Center. 13p.
Ventura JA, Costa H, Cabral JRS, Matos AP (2009) Vitória: new
Pineapple cultivar resistent to fusariosis. Acta Horticulturae 822:51-56.
Vieira DAP, Portes TA, Stacciarini-Seraphin E, Teixeira JB (2010)
Fluorescence and levels of chlorophyll in pineapple plants cv. perola submitted to different concentration of ammonium sulphate. Revista Brasileira de Fruticultura 32:360-368.
Yemm EW, Cocking EC (1955) The determination of amino-acids