ISSN 2179-8087 (online)
Original Article
Conservation of Nature
Creative Commons License. All the contents of this journal, except where otherwise noted, is licensed under a Creative Commons Attribution License.
Contribution of Litter and Leaf Decomposition of
Byrsonima gardneriana
Mayara Andrade Souza
1
, Jacob Silva Souto
2, Alberício Pereira de Andrade
3,
Kallianna Dantas Araujo
4
, Danúbia Lins Gomes
51Centro Universitário Cesmac – CESMAC, Maceió/AL, Brasil 2Universidade Federal da Paraíba – UFPB, Patos/PB, Brasil 3Universidade Federal Rural de Pernambuco – UFRPE, Garanhuns/PE, Brasil
4Universidade Federal de Alagoas – UFAL, Maceió/AL, Brasil 5Universidade Federal de Maceió – UFAL, Maceió/AL, Brasil
ABSTRACT
The litter in tropical ecosystems is one of the compartments responsible for the transference of nutrients to the soil, having great importance for the conservation and maintenance of biodiversity. Thus, this study aimed to quantify the contribution and stock of litter and the leaf decomposition rate of Gardneriana byrsonima A. Juss (murici) in two areas of Caatinga, semiarid region of Alagoas State. Litter production was measured monthly from March of 2012 to February of 2013. The litter decomposition rate and the remaining leaf mass of the murici were also calculated and analyzed for its material chemically. The leaf decomposition was measured in litter bags and the material was chemically analyzed. In the area of Olho D’Água Casado, the litter produced was over Delmiro Gouveia. The leaf fraction contributed to the higher percentage in the litter training in both areas. The leaf material showed slow decomposition to high levels of lignin, cellulose, hemicellulose, and high C:N ratio.
1. INTRODUCTION
In the Brazilian Northeast, the semiarid region is characterized by an heterogeneity of natural conditions of climate, soil, topography, and vegetation. The most striking characteristic of this region is its climate, with high rainfall variability, where events are constituted by rainfall pulses (Andrade et al., 2008).
In this respect, nutrient cycling certainly plays a key role since the dynamics of litter production and decomposition contributes to maintaining the equilibrium and the functioning of this ecosystem. Changes by man’s actions have led to numerous ecological imbalances, such as burning, deforestation, firewood and charcoal production, which favor the process of degradation of natural ecosystems, largely established in low-fertility soils (Souto, 2006). Studies related to litter production and decomposition in other biomes evidence its importance in nutrient cycling (Dick et al., 2015; Caldeira et al., 2008), forest ecosystem functioning (Santos Neto et al., 2015), forest management (Almeida et al., 2015; Rodrigues et al., 2010) and recovery of degraded environments (Moreira & Silva, 2004; Machado et al., 2008).
Information on litter production and the analysis of its contents are important tools in the understanding and conservation of ecosystems, as well as its interactions with the environment (Costa et al., 2010). In this context, more detailed studies on the production, accumulation, and decomposition of litter are necessary since they area support for Caatinga biodiversity conservation programs and the recovery of degraded areas, determining the most appropriate management for this biome.
Despite its great extension and importance to the Northeast region, there is still a great need for studies focusing on the biology and dynamics of species, such as murici (Byrsonima gardneriana A. Juss). The study of the shrub-tree component of caatinga is essential for the definition of appropriate management techniques, especially in potential areas for the development of native species that present a highly relevant aspect, i.e., the persistence under the semi-arid conditions of the Northeast region, offering relevant subsidies for the protection of natural resources and the sustainable development of the caatinga.
Thus, the objective is to quantify the litter supply and the decomposition rate and leaf chemical composition of the species Byrsonima gardneriana A. Juss (murici) in two areas of Caatinga in the semi-arid region of Alagoas.
2. MATERIAL AND METHODS
2.1. Characterization of study areas
The research was conducted in the municipalities of Olho D’Água do Casado - Area I (9°31’S and 37°51’W, altitude of 209 m) and Delmiro Gouveia - Area II (9°23’S and 37°59’W, altitude of 256 m) (DCA, 2013), state of Alagoas, mesoregion of Sertão and microregion Alagoana of Sertão do São Francisco (SEPLANDE, 2013). The climate in the study areas is BSh - Hot Tropical Semiarid, with a rainy season from November to April (Mascarenhas et al., 2005). The mean annual rainfall is 545.6 mm and 512.1 mm for the municipalities of Olho D’Água do Casado and Delmiro Gouveia, respectively (DCA, 2013).
Planosols are the predominant soils in the Olho D’Água do Casado and Delmiro Gouveia. However, there are Regolithic Neosols, Quartzarenic Neosols, Litolic Neosols and Gleissolos (EMBRAPA, 2007). For the soils physical and chemical characterization, 20 simple samples were collected at the 0-20 cm layer in an area of 1.0 ha of vegetation and submitted to the laboratory for chemical and soil characterization, as presented in Table 1.
The predominant vegetation in the study areas is the Caatinga, with occurrence of hypoxerophilic variations with stretches of deciduous forest characterized by xerophilous, woody, deciduous, and usually thorny formations. The selected areas in each municipality had 1.0 hectare of arboreal-shrub vegetation with the presence of Byrsonima gardneriana, the species chosen for this study, which has a great socioeconomic importance in the region. Popularly known as “murici”, it is an alternative for producers because of the numerous uses of its fruits in the manufacture of juices, popsicles, liqueurs, jellies, jams, and pickles, as well as a great medicinal and animal feed potential.
is formed by a vegetation fragment inserted in a high plain area with the presence of shallow soil, rocky outcrops, and more open vegetation. According to local information on the use of the area and its occupation, the areas are in a good state of conservation, without agricultural crops due to a difficult access.
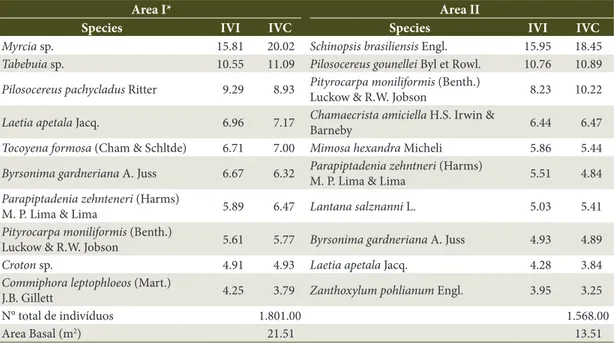
In the survey of the tree-shrub component carried out by Souza (2011), 35 species belonging to 18 families and 28 genera were recorded in Area I. In Area II, 40 species, 22 families and 35 genera were recorded. The families Mimosaceae, Euphorbiaceae, Caesalpinaceae, Anacardiaceae, Bignoniaceae, and Cactaceae were the
most representative, and Byrsonima gardneriana was among the species with the highest importance value and coverage in both areas (Table 2).
2.2. Characterization of the physical
environment
To characterize the physical environment, two Ville de Paris rain gauges were installed near the experimental areas to measure rainfall volumes at each rainfall event in order to calculate the total rainfall volume during the month. There were 20 soil samples were collected monthly at the 0-10 cm layer to determine
Table 1. Soil chemical of physical characterization in the Area I (Olho D`Água do Casado) and Area II (Delmiro Gouveia).
Area
Chemical Characterization
pH P Na Ca Mg K Al
CEC OM V
H2O mg Kg-1 ---cmol c Kg
-1---
---%---I 4.11 0.03 0.06 0.79 1.51 0.22 0.62 8.12 1.72 31.91 II 4.65 0.41 0.03 1.73 3.13 0.27 0.45 10.8 0.79 48.52
Physical Characterization
Sand Silt Clay Sd Pd TP
FP PWP
---g dm -3 --- -Kg dm -3- m3 m -3
I 907.65 52.14 40.20 1.46 2.70 0.46 5.89 3.38 II 882.20 77.73 40.89 1.41 2.68 0.46 7.57 4.36
CEC = cation exchange capacity; OM = organic matter; V = base saturation; Sd = soil density; Pd = particle density; TP = total porosity; FP = field capacity; and PWP = permanent wilting point.
Table 2. Species with high importance value indexes (IVI), covering (CVI), total number of individuals and basal area.
Area I* Area II
Species IVI IVC Species IVI IVC
Myrcia sp. 15.81 20.02 Schinopsis brasiliensis Engl. 15.95 18.45
Tabebuia sp. 10.55 11.09 Pilosocereus gounellei Byl et Rowl. 10.76 10.89
Pilosocereus pachycladus Ritter 9.29 8.93 Pityrocarpa moniliformisLuckow & R.W. Jobson (Benth.) 8.23 10.22
Laetia apetala Jacq. 6.96 7.17 Chamaecrista amiciellaBarneby H.S. Irwin & 6.44 6.47
Tocoyena formosa (Cham & Schltde) 6.71 7.00 Mimosa hexandra Micheli 5.86 5.44
Byrsonima gardneriana A. Juss 6.67 6.32 Parapiptadenia zehntneriM. P. Lima & Lima (Harms) 5.51 4.84
Parapiptadenia zehnteneri (Harms)
M. P. Lima & Lima 5.89 6.47 Lantana salznanni L. 5.03 5.41
Pityrocarpa moniliformis (Benth.)
Luckow & R.W. Jobson 5.61 5.77 Byrsonima gardneriana A. Juss 4.93 4.89
Croton sp. 4.91 4.93 Laetia apetala Jacq. 4.28 3.84
Commiphora leptophloeos (Mart.)
J.B. Gillett 4.25 3.79 Zanthoxylum pohlianum Engl. 3.95 3.25 N° total de indivíduos 1.801.00 1.568.00
Area Basal (m2) 21.51 13.51
the soil water content in each study area. The samples were stored in aluminum cans using the gravimetric method (Tedesco et al., 1995). The soil temperature was estimated monthly at the depth 0-15 cm using a digital skewer soil thermometer. All determinations were made from March 2012 to September 2013.
2.3. Production and stock of litter
To quantify litter production, 5 collectors were distributed in 4 plots (250 × 100 m), totaling 20 simple samples in each area. The collectors (1.0 × 1.0 m) were lined with 1.0 × 4.0 mm nylon meshes and suspended 15 cm above the soil surface. Their distribution was randomly stratified within the plots near Byrsonima gardneriana trees that presented the largest size (height > 2.5 m).
All material collected monthly (from March 2012 to February 2013) was packed in plastic bags previously identified and taken to the laboratory for sorting according to the fractions leaf, branches, reproductive structures (flowers and fruits) and miscellaneous (unidentified material). Afterward, these fractions were dried in a forced-air circulation oven (65 °C, for 72 h) to estimate dry biomass. From these data, the monthly averages of litter produced by the Caatinga vegetation (kg ha-1) were estimated.
The litter accumulated on the soil was randomly and monthly quantified using an iron frame measuring 0.5 × 0.5 m. Collections were carried out close to the collectors of litter. Thus, 20 simple samples were obtained in each study area.
The material circumscribed within the frame was collected and packed in previously identified plastic bags using the same procedure of drying and weighing as the litter production experiment. Subsequently, the monthly averages in kg ha-1 were estimated.
2.4. Leaf decomposition
The leaf litter decomposition rate was estimated following the methodology of Olson (1963) using the Equation 1:
/
K=L Xss (1)
where: K = decomposition constant; L = annual production of litter (gm-2); Xss = annual average of litter accumulated on the soil (gm-2).
From the value of K, the average total renewal time estimated by 1/K and the times in years required for
the occurrence of 50% (t0.5) and 95% decomposition (t0.05) of litter were calculated, which were estimated by the Equations 2 and 3:
. =In 2 /K = 0.693 /K
0 5
t (2)
and
.
3 /t0 05= K (3)
where: t = time; and K = decomposition constant. Bags (litterbags) of 20 × 20 cm were used to estimate the percentage of mass remaining during the decomposition process. They were made using a nylon mesh fabric of 1.0 × 4.0 mm. Each bag was filled with 15 g of mature and healthy leaves previously dried in an oven (65 °C/72 h). The leaves were obtained from different matrices of Byrsonima gardneriana at the end of the dry period (time 0) when 153 decomposition bags were distributed in each area on the soil surface near murici trees. Monthly, nine bags were randomly removed in each area, until September 2013 (time 18), obtaining a total of 18 sample times.
The residual mass was determined on an analytical scale with an accuracy of 0.01 g to estimate the decomposition rate (g/month) of that material of the initial mass. For the calculation of the percentage of remaining material, the Equation 4 was used:
( )
% /Remaining= FM IM ×100 (4)
where: % Remaining = percentage remaining; FM = final mass; and IM = initial mass.
Sixteen composite subsamples of the material used in decomposition bags were obtained for evaluation of chemical composition. Thus, the contents of lignin, cellulose, hemicellulose, carbon, and nitrogen (Tedesco et al., 1995) were determined, and the C:N and Lignin:N ratios were calculated.
2.5. Data analysis
3. RESULTS AND DISCUSSION
3.1. Characterization of the physical
environment
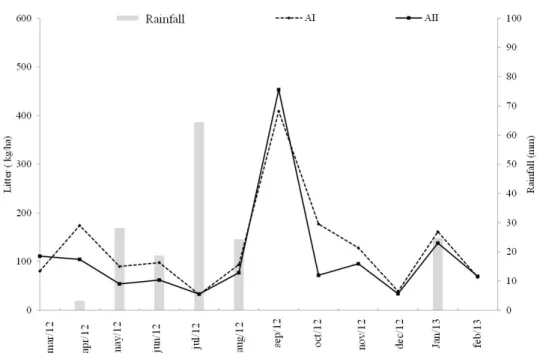
Rainfall distribution during 19 months of evaluation occurred seasonally for both study areas (Figures 1A and 1B). In Area I, the total rainfall was 355.2 mm, close to Area II: 330.0 mm. Both values were lower than the annual average, which is 545.6 mm and 512.1 mm for the Areas I and II, respectively. The highest rainfall volumes occurred in July 2012 (64.4 mm) and April 2013 (71.9 mm) in Area I, and in July 2012 (42.9 mm) and April 2013 (65.79 mm) in Area II.
The mean soil water content in the Area I was 3.5% and in the Area II was 1.7%. The highest values occurred in July 2012 (12.66%) (Area I) and April 2013 (8.18%)
(Area II) due to the higher rainfall recorded in these months (Figures 1A and 1B). The average monthly soil temperature was 28 °C for both areas; the highest values in Area I occurred in April, November and December 2012 and January, February and March 2013 (30 °C) (Figures 1A and 1B). The Area II had higher values thanthe Area I, reaching 35 °C in April 2012 and August 2013. The soil temperature was higher during the dry season due to a higher solar radiation in the region.
3.2. Production and stock of litter
The annual litter deposited was higher in the Area I than in the Area II (Table 3). Such increase in litter production is due to the presence of denser vegetation (1,801 individuals), allowing greater contributions of leaves and branches, when compared to the Area II, with more open vegetation (Table 3).
The annual litter production (March 2012 - February 2013) in the Area I was 1,822.2 kg ha-1.year-1 and in the Area II was 1,475.4 kg ha-1.year-1 (Table 3). The results are close to those of other Caatinga areas obtained by Silva et al. (2015) in the state of Paraíba (1,630.50 kg ha-1.year-1) and by Costa et al. (2015) in the state of Piauí (3,266.80 kg ha-1.year-1). According to Costa et al. (2010), the annual litter production in the Caatinga ranges between 1,500 and 3,500 kg ha-1.year-1.
The highest production of the leaf fraction occurred in September 2012, August 2013 and September 2013 (Table 4). Such high production of leaves in these months is due to the beginning of the dry period during that after the rainy season, the soil water content decreases and, with this, some Caatinga plants use a defense mechanism, i.e., abscission leaves, to minimize loss of water (Nascimento et al., 2013).
In the literature, there is an indication that the leaf fraction contributes the most to the formation of litter,
and the percentages obtained in the Area I (86.42%) and the Area II (80.20%) were higher than other studies conducted in Caatinga areas: Costa et al. (2010) reported 65%, Santos et al. (2011) reported 28.90%, Barbosa (2012) reported 72.72% and Nascimento et al. (2013) reported 60%.
For the fraction branches, there was a greater production of this material in September 2012 (32.32 kg ha-1), with higher contributions of this fraction after the rainy season by the action of winds, favoring breaks (Table 5). The production of reproductive and miscellaneous structures did not differ among the months, but there was a higher production of reproductive structures in the rainfall period due to flowering and fruiting.
Inthe litter production during the evaluation period, the same behavior was observed for the Areas I and II (Figure 2), evidencing a higher litter production in September 2012. There were greater litter
Table 3. Mean values of the fractions leaves, reproductive structures, branches and miscellaneous production of litter in kg ha-1.year-1 (March/2012 to February/2013) in the Area I (Olho D’Água do Casado) and the Area II (Delmiro Gouveia), Alagoas state.
Area I Area II
Leaves 127.44 a* 98.55 b
Reproductive structures 6.19 b 10.6 a
Branches 17.26 a 13.72 b
Miscellaneous 0.95 a 0.36 a
Production of litter (kg ha-1year-1) 1.822.20a 1.475.40b
*Means followed by the same letter, in the vertical, do not differ from each other by Tukey a 5%.
Table 4. Mean values of the fractions leaves, branches, reproductive structures and miscellanous in kg ha-1.year-1 during the months of the evaluation period (March 2012 to February 2013).
Period Leaves Branches Reproductive
structures Miscellanous Year 2012
March 57.65 d* 26.03 abc 11.62 a 0.49 a April 122.95 d 12.94 abcde 2.48 a 0.99 a May 267.45 bc 14.71 abcde 5.46 a 0.76 a June 63.52 d 9.17 bcde 7.24 a 0.00 a
July 30.01 d 2.34 e 0.23 a 0.27 a
August 68.74 d 11.63 abcde 3.10 a 2.08 a September 391.35 ab 32.32 a 7.35 a 0.00 a October 116.43 d 3.96 de 3.58 a 0.66 a November 91.82 d 14.97 abcde 5.02 a 0.18 a December 26.90 d 3.92 de 5.52 a 0.00 a
Year 2013
January 96.34 d 31.13 ab 19.98 a 2.30 a February 22.88 d 21.56 abcde 24.34 a 0.00 a
contributions shortly after the end of the rainy season and the beginning of the dry season when there was a decrease in rainfall and an increase in temperature.
This phenomenon occurs due to a decrease in soil water content during the dry season, where some Caatinga plants lose their leaves and abort flowers and fruits as a mechanism of survival to drought. Such results corroborate with those found for Caatinga environments Costa et al. (2010) and Nascimento et al. (2013). Related to the aggravation of water stress, the vegetation during the drought season loses its leaves due to the seasonality of deciduous species, reducing the leaf surface and, consequently, water loss by transpiration (Santana & Souto, 2011; Costa et al., 2007).
The average litter matter accumulated in the soil of the Area I varied from 2,706.80 to 6,864.40 kg ha-1 and in the Area II, it varied from 3,310.80 to 8,929.60 kg ha-1 during the study period (Figure 3).
Comparing to areas I and II, there was a greater accumulation of litter in March 2012. Such accumulation of litter in the soil is due to the dry season when most Caatinga plants lose their leaves, forming an organic blanket over the soil for a direct protection against the first raindrops, reducing the erosion process.
3.3. Leaf decomposition
The litter decomposition rate (K) in the Area I (0.32) was higher than in the Area II (0.27) (Table 5). Compared with other Caatinga areas, these values were close to values in Rio Grande do Norte by Santana (2005), i.e., 0.33, and higher than values found by Lima et al. (2015) in the south of Piauí, i.e., 0.20.
In order to decompose 50% of the litter accumulated in the Area I, 2.16 years (788 days) were required. In the area II, the required time was 2.56 years (934 days).
Table 5. Decomposition rate (K), average renewal time (1/K), and time required for the decomposition of 50% of the litter (t0.5) and of 95% of the litter (t.0.05).
Areas* Decomposition coefficient (K)
1/K t 0.5 t 0.05
-- Year
---I 0.32 3.12 2.16 9.37
II 0.27 3.70 2.56 11.11
*Area I = Olho D`Água do Casado and area II= Delmiro Gouveia
Thus, to decompose 95% of the material in the Area I, 9.37 years (3,420.05 days) would be required, and in the Area II, 11.11 years (4.055,15 days) would be required, evidencing that the decomposition of this material is slow when compared to other studies conducted in Caatinga areas (Alves, 2012; Souto, 2006; Santana, 2005), associating such a low decomposition with the high lignin and tannin contents in the litter (Lima et al., 2015).
The decomposition rate of murici occurred gradually, with no statistical differences (p>0.5) between the Areas I and II. However, there was a significant difference for the factor “month”. The period of greatest decomposition occurred from April to December 2012 (Figure 4).
The highest decomposition rate in the Areas I and II occurred in the first three months, with losses of 9.67 and 9.27% of initial matter, respectively. In the subsequent months, the decomposition was slower
Figure 3. Litter production accumulation in the soil (kg ha-1) in the Area I (Olho D’Água do Casado) and the Area II (Delmiro Gouveia).
and constant due to a lower soil water content, which decreased the decomposition rate, influencing the low activity of decomposing organisms. At the end of the experiment, only 33.49% (Area I) and 27.29% (Area II) of the material was decomposed, corresponding to an average material loss of 9.8 mg day-1 and 8.0 mg day-1, respectively.
Murici leaves had high levels of lignin, cellulose, hemicellulose, and C:N ratio (Table 6), which caused a slow decomposition of the material (Santos et al., 2009). Comparing to (Santana, 2005), the values were Pau-mocó: 23.47%, Velamen: 29.93%, Mofumbo: 13.51%, Quince: 19.02% and Faveleiro: 23.06% (Alves, 2012). Therefore, this material had a longer decomposition time.
4. CONCLUSIONS
The amount of litter produced in the Caatinga area Olho D ‘Água do Casado was higher than in Delmiro Gouveia, with a higher production at the end of the rainy season and at the beginning of the dry season.
The fraction “leaf ” contributed with a greater percentage to the formation of litter in both areas.
The leaves of Byrsonima gardneriana A. Juss (murici) presented high levels of lignin, cellulose and hemicellulose and a high C:N ratio. This material offered resistance during the decomposition process.
SUBMISSION STATUS
Received: 8 feb., 2017 Accepted: 26 oct., 2017
CORRESPONDENCE TO
Mayara Andrade Souza
Programa de Pós-graduação Análise de Sistemas Ambientais, Centro Universitário Cesmac – CESMAC, Campus VI, R. Prof. Ângelo Neto, 51, Farol, CEP 57051-530, Maceió, AL, Brasil e-mail: [email protected]
REFERENCES
Almeida EJ, Luizão F, Rodrigues DJ. Produção de serapilheira em florestas intactas e exploradas seletivamente no Sul da Amazônia em função da área basal da vegetação e da densidade de plantas. Acta Amazonica 2015; 45(2): 157-166. http://dx.doi.org/10.1590/1809-4392201402543. Alves GS. Dinâmica da serapilheira em áreas de Caatinga e Vulnerabilidade sócio econômica no município de Várzea, PB [tese]. Areia: Universidade Federal da Paraíba; 2012. Andrade RL, Souto JS, Souto PC, Bezerra DM. Deposição de serapilheira em área de caatinga na RPPN “Fazenda Tamanduá”, Santa Terezinha – PB. Revista Caatinga 2008; 21(2): 223-230.
Barbosa MD. Composição florística, regeneração natural, decomposição e ciclagem de nutrientes, em áreas de caatinga hipoxerófila em Arcoverde, Pernambuco [tese]. Recife: Universidade Federal Rural de Pernambuco; 2012. Caldeira MVW, Vitorino MD, Schaadt SS, Moraes E, Balbinot R. Quantificação de serapilheira e nutrientes em uma Floresta Ombrófila Densa. Semina: Ciências Agrárias
2008; 29(1): 53-68. http://dx.doi.org/10.5433/1679-0359.2008v29n1p53.
Costa CCA, Camacho RGV, Macedo ID, Silva PCM. Análise comparativa da produção de serapilheira em fragmentos arbóreos e arbustivos em áreas de caatinga na Flora de Açu-RN. Revista Árvore 2010; 34(2): 259-265. http://dx.doi.org/10.1590/S0100-67622010000200008. Costa CCA, Souza AM, Silva NF, Camacho GV, Dantas IM. Produção de serapilheira na Caatinga da Floresta Nacional do Açu-RN. Revista Brasileira de Biociências
2007; 5(1): 246-248.
Costa JTF, Silva LS, Alves AR, Holanda AC, Leite ML, Nunes AKA. Avaliação da serapilheira em área de mata ciliar na bacia do Rio Gurguéia sul do Piauí. Revista Verde
2015; 10(1): 13-19.
Departamento de Ciências Atmosféricas – DCA. Dados climatológicos do Estado de Alagoas [online]. Paraíba: DCA; 2013 [cited 2013 Apr 6]. Available from: http// www.dca.ufcg.edu.br
Dick G, Ávila M, Schumacher MV. Produção de serapilheira em fragmentos de Floresta Estacional Subtropical na região Norte do Rio Grande do Sul. Ecologia e Nutrição Florestal 2015; 3(1): 1-8.
Table 6. Lignin, cellulose and hemicellulose concentration (g kg-1) of dry matter, C:N ratio and Lignin:N ratio for leaves of Byrsonima gardneriana (murici) species.
Leaf concentration
Nitrogen Carbon Lignin Cellulose Hemicellulose C:N
Ratio
Lignin:N Ratio --- g kg-1
Empresa Brasileira de Pesquisas Agropecuárias – EMBRAPA.
Solos do Município de Olho D’Água do Casado Estado de Alagoas. 1. ed. Rio de Janeiro: Embrapa Solos; 2007. 4 p. (Comunicado Técnico).
Lima RP, Fernandes MM, Fernandes MRM, Matricardi EAT. Aporte e decomposição da serapilheira na Caatinga do Sul do Piauí. Floresta e Ambiente 2015; 22(1): 42-49. http://dx.doi.org/10.1590/2179-8087.062013.
Machado MR, Rodrigues FCMP, Pereira MG. Produção de serapilheira como bioindicador de recuperação em plantio adensado de revegetação. Revista Árvore 2008; 32(1): 143-151. http://dx.doi.org/10.1590/S0100-67622008000100016.
Mascarenhas JC., Beltrão BA, Souza LC Jr. Projeto cadastro de fontes de abastecimento por água subterrânea: diagnóstico do município de Olho D’ Água do Casado, estado de Alagoas. Recife: CPRM/PRODEEM, 2005. 12 p.
Moreira PR, Silva OA. Produção de serapilheira em área reflorestada. Revista Árvore 2004; 28(1): 49-59. http:// dx.doi.org/10.1590/S0100-67622004000100007. Nascimento AFJ, Silva TO, Sampaio EVSB, Araújo Filho RN, Dantas TVP. Quantificação de serapilheira em diferentes áreas sob fragmentos do Parque Nacional Serra de Itabaiana, Sergipe. Semina: Ciências Agrárias
2013; 34(1): 3271-3278. http://dx.doi.org/10.5433/1679-0359.2013v34n6Supl1p3271.
Olson JS. Energy storage and the balance of producers and decomposers in ecological systems. Ecology 1963; 44(2): 322-331. http://dx.doi.org/10.2307/1932179.
Rodrigues BD, Martins SV, Leite HC. Avaliação do potencial da transposição da serapilheira e do banco de sementes do solo para restauração florestal em áreas degradadas. Revista Árvore 2010; 34(1): 65-73. http:// dx.doi.org/10.1590/S0100-67622010000100008.
Santana JAS, Souto JS. Produção de serapilheira na Caatinga da região Semi-árida do Rio Grande do Norte, Brasil. Idesia 2011; 29(2): 87-94. http://dx.doi.org/10.4067/ S0718-34292011000200011.
Santana JAS. Estrutura fitossociológica, produção de serapilheira e ciclagem de nutrientes em uma área de Caatinga no Seridó do Rio Grande do Norte [tese]. Areia: Centro de Ciências Agrárias, Universidade Federal da Paraíba; 2005.
Santos Neto AP, Barreto PAB, Gama-Rodrigues EF, Novaes AB, Paula A. Produção de serapilheira em Floresta Estacional Semidecidual e em plantios de Pterogyne nitens Tul. e Eucalyptus urophylla S. T. Blake no sudoeste da Bahia. Ciência Florestal 2015; 25(3): 633-643. http:// dx.doi.org/10.5902/1980509819614.
Santos OS, Souza JT, Santos JMFF, Santos DM, Araújo EL. Diferenças sazonais no aporte de serapilheira em uma área de caatinga em Pernambuco. Revista Caatinga
2011; 24(4): 94-101.
Santos RHS, Siqueira RG, Lima CTA, Almeida AR, Pedrosa AW, Oliveira CS. Decomposição e Liberação de Nitrogênio de Duas Espécies de Adubos Verdes Manejados no Período Seco em Cafezal orgânico. Revista Brasileira de Agroecologia 2009; 4(2): 1342-1345.
Secretaria de Estado do Planejamento e do Desenvolvimento Econômico – SEPLANDE. Perfil municipal. 1. ed. Maceió: SEPLANDE/AL; 2013.
Silva VN, Souto LS, Dutra Filho JA, Souza TMA, Borges CHA. Deposição de serapilheira em uma área de caatinga preservada no semiárido da Paraíba, Brasil. Revista Verde
2015; 10(2): 21-25. http://dx.doi.org/10.18378/rvads. v10i2.3409.
Souto PC. Acumulação e decomposição da serapilheira e distribuição de organismos edáficos em área de caatinga na Paraíba, Brasil [tese]. Areia: Centro de Ciências Agrárias, Universidade Federal da Paraíba; 2006.