EXPERIMENTAL EVIDENCE OF THE EFFECT OF
NUTRIENT ENRICHMENT ON THE ZOOPLANKTON IN A
BRAZILIAN COASTAL LAGOON
KOZLOWSKY-SUZUKI, B. and BOZELLI, R. L.
Laboratório de Ecologia do Plâncton, Universidade Federal do Rio de Janeiro, Departamento de Ecologia, CCS, CEP 21941-590, Rio de Janeiro, RJ, Brazil
Correspondence to: Betina Kozlowsky-Suzuki, Marine Biology, Lund University, Campus Helsingborg, Box 882, SE-251 08 Helsingborg, Sweden, e-mail: betina.kozlowsky-suzuki@ekol.lu.se
Received September 21, 2001 – Accepted November 21, 2001 – Distributed November 30, 2002 (With 3 figures)
ABSTRACT
Non-treated sewage disposal is one of the main impacts to which Imboassica Lagoon has been sub-jected. The aim of this study was to evaluate the effect of a potential increase in the artificial enrichment on the environmental conditions and zooplankton of this system. To this end, an experimental study was conducted in mesocosms where nutrients were added daily. Bacterial numbers, chlorophyll-a, and picoplanktonic cyanobacteria densities showed an increase with the availability of nutrients. Bacterio- and phytoplankton seemed to be regulated by the rotifers Brachionus rotundiformis and Hexarthra brandorffi.
Key words: coastal lagoon, enrichment, zooplankton.
RESUMO
Evidência experimental do efeito do enriquecimento por nutrientes sobre o zooplâncton em uma lagoa costeira brasileira
O despejo de esgoto não tratado é um dos principais impactos aos quais a Lagoa Imboassica está submetida. O objetivo deste estudo foi avaliar o efeito de um aumento potencial no enriquecimento artificial das condições ambientais e do zooplâncton desse sistema. Para tanto, foi realizado estudo experimental em mesocosmos aos quais foram adicionados nutrientes diariamente. O número de bactérias e de cianobactérias picoplanctônicas e a clorofila-a apresentaram aumento com a disponibilidade de nutrientes. Bacterio- e fitoplâncton parecem ter sido regulados pelos rotíferos Brachionus rotundiformis e Hexarthra brandorffi.
Palavras-chave: lagoa costeira, enriquecimento, zooplâncton.
INTRODUCTION
As a consequence of the input of nutrients, inorganic and organic material, relative shallowness, high penetration of solar radiation, and frequent water column mixing, coastal lagoons usually present high rates of primary and secondary productivities (Kjerfve, 1994; Castel et al., 1996). Such ecosystems cover approximately 13% of coastal areas worldwide and in Brazil they occur almost all along the
coastline from the State of Rio Grande do Sul to the State of Maranhão (Schäfer, 1992).
enhance the eutrophication process, in several cases leading to massive phytoplanktonic development and the occurrence of distrophic crises (Faria, 1993; Suzuki, 1997). Such crises are a result of intense biological, physical, and chemical imbalance and culminate in system anoxia. This causes a temporary disappearance of aquatic organisms (Faria, 1993).
Imboassica Lagoon, located in the city of Macaé (22o24’S, 41o42’W), northern Rio de Janeiro State, receives daily approximately 65 kg of nitrogen and 7 kg of phosphorus through its main sewage canal (Lopes-Ferreira, 1995). According to this author, the dense littoral zone situated at the canal outlet is able to reduce at least 93% of the nitrogen and phosphorus concentrations in the water column before reaching the lagoon. However, expanding urbanization in this area may lead to increased nutrient input in Imboassica Lagoon.
An enrichment experiment was conducted to evaluate the short-term outcome of nutrient load increase in Imboassica Lagoon, based on an expected reduction of macrophyte depuration capability. The purpose was to investigate the alterations in water quality and the zooplanktonic community as a predictive measure providing subsides for future management strategies.
MATERIALS AND METHODS
Experimental setup
Six transparent 0.6 mm polyethylene enclo-sures, open to the atmosphere and sediment, with the following dimensions: 1.0 m height; 1.0 m width and 1.4 depth, were built in a wind-protected area in Imboassica Lagoon. They were organized for two treatments: (C) control, in which there was no nutrient addition and (E) enriched, in which there was a daily addition of 28 µM of N in ammonium form and 0.5 µM of P in ortho-phosphate form. These concentrations were calculated taking into account values observed by Lopes-Ferreira (1995) and others occasionally verified in Imboassica Lagoon during sandbar openings (Faria et al., 1998), when dilution is reduced and nutrient concentration in the water column is increased.
Sampling and laboratory analyses
The experiment was carried out for seven days (October 27 to November 2, 1996) and samples were collected inside the enclosures and in a nearby open-water station. The first sampling was done on the first day (one day after the enclosures were built). The second sampling occurred on the same day following nutrient addition in order to verify its efficiency. The other samplings were carried out on the second day, the fourth day and the seventh day, always prior to the daily nutrient addition.
At the open-water station and in the enclosures, temperature was measured at the surface and bottom of the water column and transparency was estimated with a Secchi disc. Water samples were collected along the entire water column (from the surface to the bottom) for posterior analyses, at the field station laboratory, for the following abiotic variables: pH and electrical conductivity measured potentiome-trically; total alkalinity according to Gran (1952); salinity estimated with a salinometer-refratometer; and dissolved oxygen according to Winkler’s method as modified by Golterman et al. (1978). Water samples were filtered on GF-C filters, which were used for suspended matter and chlorophyll-a determinations. Aliquots of non-filtered and filtered water samples were frozen for subsequent analyses. Total and dissolved Kjeldahl nitrogen (TkN and DkN) followed Mackereth et al. (1978); nitrate plus nitrite (NO3–+NO
2
–) were determined by flow
injection using the cadmium reduction method described in Zagatto et al. (1981). Ammonium (NH4+) was determined according to Koroleff (1976). Total phosphorus and total dissolved phosphorus (TP and TDP), orthophosphate (PO43–), and soluble reactive silica (Si) were measured according to methods described in Golterman et al. (1978). Dissolved organic carbon (DOC) was quantified in a Total Organic Carbon Analyser (Shimadzu TOC-5000).
described in del Giorgio et al. (1996). Phytoplankton samples from the initial and final sampling days were preserved with a lugol solution and counted in sedimentation chambers under an inverted microscope. Chlorophyll-a content was determined spectrophotometricaly after extraction with 80% ethanol (Nusch & Palme, 1975).
Zooplankton samples were obtained from the entire water column with the use of a pump, filtered through a 68 µm plankton net, and preserved with a 4% buffered sucrose formaldehyde solution. Small-bodied organisms (rotifers, naupliar forms, and larvae of some meroplanktonic organisms) were counted in Sedgewick-Rafter cells under an optic microscope. Larger organisms (cladocerans, and juvenile and adult forms of copepods) were enumerated in open chambers under a stereoscopic microscope.
Data analysis
Individual Contrast Multivariate Analysis of Variance (MANOVA; Wilks’ λ statistics) (von Ende, 1993) was used to test alterations in the values of the response variables (abiotic and biotic) as a function of nutrient additions and time (C x E and T in Table 1). In the case of a
significant result, variance analyses (ANOVA; F statistics) were done for successive sampling dates separately (von Ende, 1993). These statistical analyses were conducted with log (x + 1) transformed data. Spearman rank correlation was used to detect relations among variables in the enriched treatment.
RESULTS
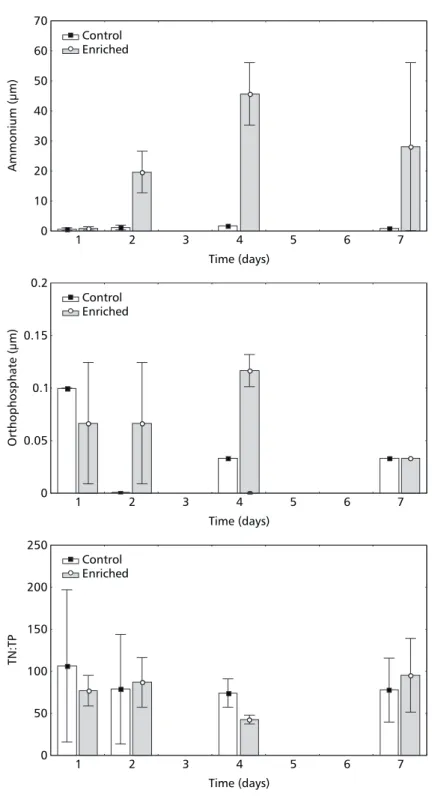
There was no significant difference (MANOVA, p > 0.05) between control and enriched enclosures or any time effect for the following abiotic variables: pH, ammonium, nitrate + nitrite, soluble reactive silica, total dissolved and total phosphorus, total Kjeldahl nitrogen, dissolved organic carbon, and TN:TP (Table 1).
It was not possible to test statistical differences in water transparency, salinity, and orthophosphate, as there was no variance in the values within and/or between groups. In the case of orthophosphate, some of the values fell beneath the detection limit of the analytical method used.
There was no overall statistical difference between treatments for ammonium and orthophos-phate concentrations, even though higher values were obtained for the enriched enclosures than for the controls, especially on the first day after nutrient addition (data not shown), and on the second and fourth sampling dates (Fig. 1). The average ammonium and orthophosphate concentrations measured after nutrient addition were 27.21 µM and 0.15 µM, respectively. The concentration of ammonium corresponded to approximately the aimed-at value (28 µM), whereas that of orthophosphate was 3.5 times inferior to the expected value.
Even though the average value of dissolved Kjeldahl nitrogen was higher for the enriched enclosures than for the controls (MANOVA, p < 0.000, Table 1), analysis of variance conducted on successive sampling dates was not able to detect significant differences (ANOVA, p > 0.05).
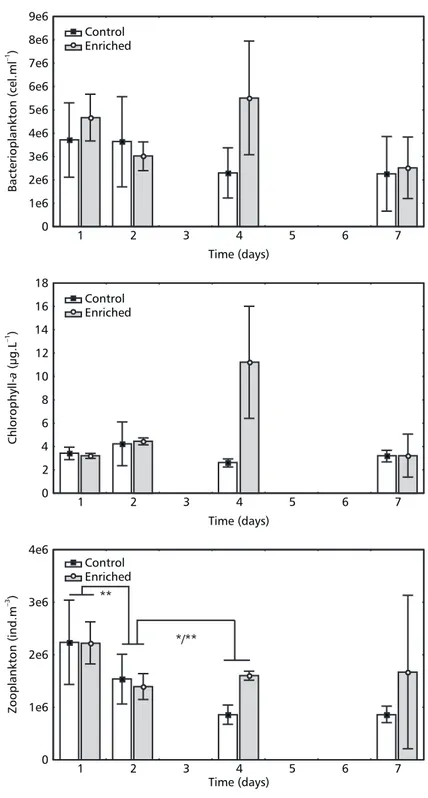
The highest mean value of the bacterial density was detected on the fourth day for the enriched enclosures (Fig. 2). No statistical difference was, however, observed between treatments or among sampling dates (MANOVA, p > 0.05). For the enriched enclosure, in which the highest bacteria number occurred, we simultaneously observed the highest chlorophyll-a and dissolved oxygen values. Overall bacterioplankton density showed a positive correlation with dissolved oxygen (r = 0.69, p < 0.02) and a negative correlation with TN:TP values (r = –0.70, p < 0.02).
Variable Lagoon Control Enriched SV Wilks’ λ p
24.90 (0.35) 25.25 (0.33) 25.12 (0.33) C x E 0.434 0.575 Temperature
(°C)
T 0.032 0.047
pH 8.24 (0.15) 8.19 (0.15) 8.07 (0.24) C x E 0.386 0.519
T 0.300 0.414
1.59 (0.11) 1.64 (0.19) 1.62 (0.23) C x E 0.301 0.416
Alkalinity
(mEq. L–1) T 0.008 0.012
1.10 (0.04) 1.02 (0.02) 0.95 (0.10) C x E – –
Secchi (m)
T – –
8.93 (0.13) 9.76 (0.18) 9.77 (0.24) C x E 0.770 0.890
Conductivity
(mS.cm–1) T 0.010 0.015
5.50 (0.58) 5.50 (0.52) 5.58 (0.51) C x E – –
Salinity (u.s.)
T – –
8.97 (0.85) 8.34 (0.48) 7.89 (1.31) C x E 0.065 0.110 O2 (mg.L
–1
)
T 0.007 0.010
14.60 (1.82) 13.52 (1.22) 14.44 (1.51) C x E 0.184 0.264 SM (mg.L–1)
T 0.013 0.020
1.45 (0.45) 1.06 (0.96) 24.48
(19.05) C x E 0.107 0.156 NH4
+
(µM)
T 0.069 0.101
0.71 (0.17) 0.78 (0.18) 0.95 (0.17) C x E 0.391 0.525
NO3 –
+ NO2 –
(µM) T 0.221 0.313
129.23 (9.56) 116.19 (17.42) 124.31
(15.19) C x E 0.164 0.277 Si
(µM)
T 0.117 0.170
ND – 0.13 * ND – 0.10 * ND – 0.24 * C x E – –
PO4 3–
(µM)
T – –
0.17 (0.15) 0.16 (0.10) 0.33 (0.16) C x E 0.075 0.111
TDP (µM)
T 0.206 0.292
0.46 (0.15) 0.52 (0.25) 0.84 (0.45) C x E 0.060 0.088 TP (µM)
T 0.063 0.093
TABLE 1
Mean values and standard deviations (in parentheses) of the abiotic and biotic variables measured in the open water station in Imboassica Lagoon, in the control (C) and in the enriched (E) enclosures from October to
Variable Lagoon Control Enriched SV Wilks’ λ p
24.75 (4.27) 27.00 (5.29) 44.20
(13.29) C x E 0.000 0.000 DkN (µM)
T 0.000 0.000
35.11 (3.75) 32.75 (4.69) 51.80
(15.99) C x E 0.040 0.059 TkN (µM)
T 0.055 0.082
0.97 (0.27) 1.00 (0.16) 1.12 (0.08) C x E 0.352 0.479
DOC (mM)
T 0.556 0.704
88.85 (44.78) 84.02 (52.35) 73.44
(29.39) C x E 0.272 0.378 TN:TP
T 0.154 0.221
2.8 x 10⁶ (3.5 x 10⁵)
3.7 x 10⁶ (2.3 x 10⁶)
3.9 x 10⁶
(1.8 x 10⁶) C x E 0.109 0.159
Bacterioplankton (cells.ml–1)
T 0.098 0.143
3.88 (1.66) 3.35 (1.06) 5.52 (4.11) C x E 0.280 0.390
Chlorophyll-a (µg. L–1)
T 0.282 0.391
2.1 x 10⁴
(8.1 x 10³)
2.0x 10⁴
(5.1 x 10³)
2.8 x 10⁴
(2.0 x 10⁴) C x E 0.853 # 0.408
T 5.784 # 0.074
Phytoplankton (ind.ml–1)
C x E x T 0.777 # 0.428
1.1x 10⁶
(6.7 x 10⁵)
1.4 x 10⁶
(7.2x 10⁵)
1.7x 10⁶
(7.3x 10⁵) C x E 0.087 0.128
Zooplankton (ind.m–3)
T 0.029 0.044
* Minimum–maximum values; # ANOVA: F values.
TABLE 1 (continued)
Cyanophyceae, Cryptophyceae, Dinophyceae, Chrysophyceae, Bacillariophyceae, Zygnemaphyceae, and Cholorophyceae constituted the phytoplankton community in Imboassica Lagoon. It was nume-rically dominated by picoplanktonic cyanobacteria of the Synechocystis and Synechococcus genera, which represented at least 62% of the total phytoplankton density. The lowest (62%) as well the highest (96%) contribution of this group to the
entire phytoplankton community was observed in enriched enclosures. Cyanobacteria were also the dominant group in the control enclosures and open water station.
0 10 20 30 40 50 60 70
1 2 3 4 5 6 7
0 0.05 0.1 0.15 0.2
1 2 3 4 5 6 7
0 50 100 150 200 250
1 2 3 4 5 6 7
Ammonium
(
m)
µ
Time (days) Control
Enriched
Time (days) Control
Enriched
Time (days) Control
Enriched
Orthophosphate
(
m)
µ
TN:TP
Fig. 1 — Mean (column) and standard deviation ± 1 (bars) of ammonium, orthophosphate concentrations, and TN:TP values
Zooplankton
(ind.m
)
–3
Time (days) Control
Enriched 0
1e6 2e6 3e6 4e6 5e6 6e6 7e6 8e6 9e6
1 2 3 4 5 6 7
0 2 4 6 8 10 12 14 16 18
1 2 3 4 5 6 7
0 1e6 2e6 3e6 4e6
1 2 3 4 5 6 7
*/** **
Bacterioplankton
(cel.ml
)
–1
Time (days) Control
Enriched
Chlorophyll-(
g.L
)
a
µ
–1
Time (days) Control
Enriched
Fig. 2 — Mean (column) and standard deviation ± 1 (bars) of total bacterioplankton density, chlorophyll-a concentration, and
There was no difference in Cyanophyceae density between treatments (ANOVA, p > 0.05). On the last day of the experiment, in one of the enriched enclosures there was an accentuated reduction in cyanobacteria density, together with an increase in flagellate (Rhodomonas) numbers. Besides their positive relation with chlorophyll-a chlorophyll-and totchlorophyll-al phytoplchlorophyll-ankton density, cychlorophyll-anobchlorophyll-acterichlorophyll-a were also associated with pH (r = 0.89, p < 0.02). The zooplankton was composed of 26 taxa (Table 2) represented by holoplanktonic (6 species of rotifers, 4 of cladocerans, and 3 copepod taxa and their naupliar and juvenile forms) and meroplanktonic organisms.
In general, no significant difference in to-tal zooplankton density as a function of the enrichment was observed, (MANOVA, p > 0.05, Table 2). A significant time effect was, however, noted (MANOVA, p < 0.05, Table 1). A significant decrease was observed from the first to the second day (ANOVA, p < 0.01, Fig. 2), although treatments did not differ (ANOVA, p > 0.05). From the second to the fourth day, there was a reduction in the average zooplankton density in the controls and, simultaneously, zooplankton density was higher in the enriched treatment (ANOVA, p < 0.01, Fig. 2). No enrichment or time effect was observed on the Calanoida, Cyclopoida and Cirripedia nauplii, Calanoida copepodits, Gastropoda veligers, and Polychaeta larvae (MANOVA, p > 0.05).
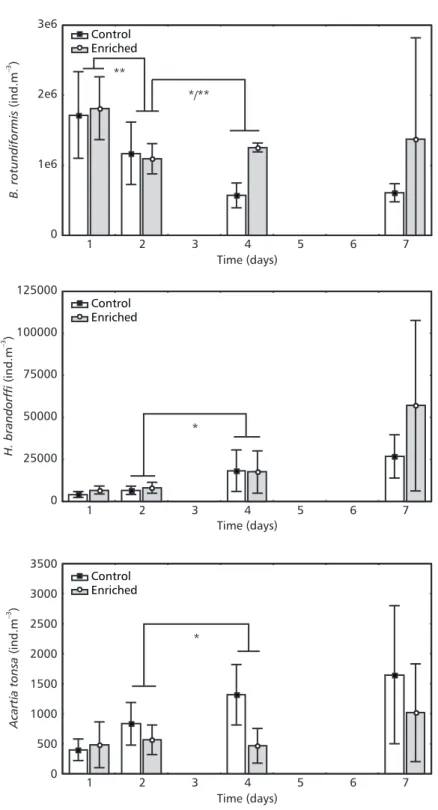
In the enriched treatment, Brachionus rotundiformis (previously known as Brachionus plicatilis S type, Segers, 1995) composed 63% to 91% of the total zooplankton community. For this species a time effect (MANOVA, λ = 0.017, p < 0.05) but no nutrient effect was detected (MANOVA, λ = 0.061, p > 0.05). Similarly, as observed for the total zooplankton density, B. rotundiformis presented a density decrease from the first to the second day of the experiment (ANOVA, p < 0.001, Fig. 3). From the second to the fourth day, this decrease continued in the control treatment (ANOVA, p < 0.05, Fig. 3). At this time a higher density of this species was detected in the enriched treatment when compared to the control (ANOVA, p < 0.001, Fig. 3). Even though the B. rotundiformis density tended to decline over time, its highest number was observed on the last day of the experiment in one of the enriched enclosures.
Hexarthra brandorffi, another rotifer species present on all sampling dates, showed no significant density difference between treatments (MANOVA, λ = 0.152, p > 0.05), but did present changes in time (MANOVA, λ = 0.007, p < 0.05). Contrary to B. rotundiformis, this species demonstrated an increase in its density over time, which was considered significant from the second to the fourth day (ANOVA, p < 0.05, Fig. 3). However, both rotifer species showed their highest numbers on the last sampling in the same enriched enclosure. We observed a nutrient effect on the density of Acartia tonsa (MANOVA, λ = 0.011, p < 0.05), but there was no effect of time (MANOVA, λ = 0.179, p > 0.05) even though densities of this species tended to be higher in both treatments at the end of the experiment. On the fourth day Acartia tonsa density was higher in the controls than in the enriched enclosures (ANOVA, p < 0.05, Fig. 3).
DISCUSSION
TABLE 2
Mean values and standard deviations (in parentheses) or minimum and maximum densities (*) of the zooplankton
taxa, expressed in ind./m3, in the open water station in Imboassica Lagoon, in the control and in the enriched
enclosures from October to November 1996.
Taxa Lagoon Control Enriched Rotifera
Brachionus rotundiformis 8.0 x 10⁵
(6.8 x 10⁵)
1.0 x 10⁶
(6.0 x 10⁵)
1.3 x 10⁶
(7.1 x 10⁵)
Hexarthra brandorffi 3.6 x 10³
(2.4 x 10³)
1.4 x 10⁴
(1.2 x 10⁴)
2.2 x 10⁴
(3.1 x 10⁴)
Keratella cochlearis 0 – 5.0 x 10²*
Lecane bulla 0 – 5.0 x 10²*
Lecane stenroosi 0 – 5.0 x 10²*
Lepadella patella 0 – 5.0 x 10²*
Cladocera
Alona cf. monacantha 0 – 1.0 x 10²*
Bosmina hagmanni 0 – 5.0 x 101* 0 – 5.0 x 101* 0 – 5.0 x 101*
Ceriodaphnia cornuta 0 – 5.0 x 101*
Diaphanosoma spinulosum 0 – 5.0 x 101*
Copepoda Calanoida nauplii 1.8 x 10⁵
(4.3 x 10⁴)
2.5 x 10⁵
(1.5 x 10⁵)
2.0 x 10⁵
(6.4 x 10⁴)
Cyclopoida nauplii 4.5 x 10³ (2.9 x 10³)
4.2 x 10³ (2.3 x 10³)
4.4 x 10³ (2.4 x 10³) Harpacticoida nauplii 0 – 1.5 x 103* 0 – 2.0 x 103* 0 – 1.5 x 10³*
Calanoida copepodids 1.3 x 10⁴ (1.7 x 10⁴)
1.4 x 10⁴ (1.0 x 10⁴)
1.1 x 10⁴ (5.7 x 10³)
Cyclopoida copepodids 0 – 1.5 x 102* 0 – 1.0 x 102* 0 – 1.0 x 10²* Harpacticoida copepodids 0 – 2.5 x 102* 0 – 3.0 x 102* 0 – 1.5 x 10³*
Acartia tonsa 1.6 x 10²
(1.4 x 10²)
8.7 x 10² (7.6 x 10²)
6.7 x 10² (4.4 x 10²)
Pseudodiaptomus richardi 0 – 5.0 x 101*
Parasitic copepods 0 – 5.0 x 101* 0 – 5.0 x 101*
Cirripedia cipris 0 – 5.0 x 101* 0 – 5.0 x 101* 0 – 5.0 x 101*
Cirripedia nauplii 5.8 x 10³ (4.2 x 10³)
9.9 x 10³ (7.0 x 10³)
6.6 x 10³ (2.7 x 10³)
Chironomidae larvae 0 – 5.0 x 101* 0 – 1.0 x 102* 0 – 1.0 x 10²* Polychaeta larvae 2.3 x 10⁴
(1.3 x 10⁴)
2.6 x 10⁴
(1.3 x 10⁴)
3.0 x 10⁴
(1.5 x 10⁴)
Nematoda 0 – 5.0 x 102* 0 – 5.0 x 101* 0 – 5.0 x 101* Bivalvia veligers 0 – 1.0 x 103* 0 – 5.0 x 102* 0 – 1.0 x 10³*
B.
rotundiformis
(ind.m
)
–3
Time (days)
Control Enriched
0 1e6 2e6 3e6
1 2 3 4 5 6 7
**
*/**
0 25000 50000 75000 100000 125000
1 2 3 4 5 6 7
*
0 500 1000 1500 2000 2500 3000 3500
1 2 3 4 5 6 7
*
H.
brandorffi
(ind.m
)
–3
Time (days)
Control Enriched
Acartia
tonsa
(ind.m
)
–3
Time (days)
Control Enriched
Fig. 3 — Mean (column) and standard deviation + 1 (bars) of Brachionus rotundiformis, Hexarthra brandorffi and Acartia
The phytoplankton community of Imboassica Lagoon was dominated during this study by picoplanktonic cyanobacteria of the genera Synechocystis and Synechococcus. In the enriched treatment, total cyanobacteria density showed a positive correlation with chlorophyll-a content (r = 0.89, p < 0.05). This indicchlorophyll-ates thchlorophyll-at the increase in numbers of these organisms was, at least in part, responsible for the increase in chlorophyll-a values.
On the fourth day, higher Brachionus rotundiformis and lower Acartia tonsa densities in the enriched enclosures than in the controls, concomitant with an increase in chlorophyll-a concentration and bacterial density, indicate a positive effect of the enrichment on the first species and a negative one on the second. Higher relative importance of microzooplankton in relation to macrozooplankton is commonly observed under higher trophic conditions, especially in sub-tro-pical systems (Bays & Crisman, 1983; Beaver & Crisman, 1990). Within the microzooplankton, the rotifer contribution can be important in such conditions, while calanoids are generally the most affected in the macrozooplankton. Blancher (1984) observed that rotifers numerically predominated in eutrophic lakes in Florida, whereas copepods predominated in less rich ones.
Acartia tonsa seemed to experience released predation pressure, since it showed an increase in numbers both in the control and enriched enclosures when compared to the open water station (data not shown). This might suggest that predation is an important structuring factor for the zooplankton community in Imboassica Lagoon. Abreu et al. (1994) observed a reduction in copepodit and adult A. tonsa densities when juvenile Xenomelaniris brasiliensis were present in an enclosure study in Patos Lagoon (Rio Grande do Sul). This fish species also occurs in Imboassica Lagoon (Aguiaro, 1994) and its absence inside the enclosures might have favored A. tonsa.
On the last day of the experiment, some variables in the enriched treatment showed differential behaviour. For instance, in two enclosures a considerable reduction in nutrient concentrations, bacterial density, and chlorophyll-a vchlorophyll-alues wchlorophyll-as observed, which hchlorophyll-ad not been
expected since nutrients were added daily. Reduction or stabilization of the nutrient con-centrations could have happened as a result of uptake by phyto- and/or bacterioplankton, neither of which was observed. Therefore, some dilution may have occurred within these enclosures as a result of water influx. During the period in which the experiment was conducted, a 15 cm increase in the water level took place due to high rain precipitation, and even though the enclosures apparently suffered no water influx during samplings, this is not certain.
The third enriched enclosure showed signs of environmental stress. It had the highest ammonium and lowest pH and dissolved oxygen levels. Bacterial and cyanobacterial densities and chlorophyll-a concentrations were very low, while Brachionus rotundiformis and Hexarthra brandorffi had their highest densities. Dominance in the zooplankton community was the highest and diversity the lowest observed for all enclosures. These results suggest that zooplankton, mainly the rotifers, were capable of regulating or even suppressing bacterial and cyanobacterial densities since rotifer species of the genera found in this study can effectively use particles of the picoplankton size range (Pourriot, 1977; Vadstein et al., 1993; Heerkloβ & Hlawa, 1995). Arcifa et al. (1994), observed a significant negative correlation between B. plicatilis and cyanobacteria (Synechococcus elongatus and Synechocystis aquatilis f. salina) in Barra Lagoon. Vadstein et al. (1993) demonstrated that Brachionus plicatilis presented maximum filtration rate in the presence of 2 µm diameter particles, being able to ingest 0.3 µm particles as well. These authors concluded that in high densities, such those observed under cultivation conditions, B. plicatilis can effectively remove bacteria. This rotifer species can use several food items, including bacteria, Enteromorpha debris and some algae species, showing positive selectivity to smaller particle size (2 µm) (Heerkloβ & Hlawa, 1995).
Acknowledgments — We thank Sérgio de Melo for his valuable assistance, especially in fieldwork, and Prof. Marina Suzuki for assistance in phytoplankton counting. We thank Prof. Wilhelm Granéli for allowing us to use a flow cytometer and other facilities of the Limnology Department of Lund University, Sweden. Diana Lee Jareo corrected the language. Grants were received from CNPq, Petrobras, and Pronex.
REFERENCES
ABREU, P. C., GRANÉLI, E., ODEBRECHT, C., KITZMANN, D., PROENÇA, L. A. & REAGALLA, C. J. R., 1994, Effect of fish and mesozooplankton manipulation on the phytoplankton community in the Patos lagoon estuary, southern Brazil. Estuaries, 17: 575-584.
AGUIARO, T., 1994, Estrutura da comunidade de peixes de três lagoas costeiras da região de Macaé (RJ). Masters Thesis, UFRJ, RJ, 114p.
ARCIFA, M. S., CASTILHO, M. S. M. & CARMOUZE, J. P., 1994, Composition et évolution du zooplancton dans une lagune tropicale (Brésil) au cours d’une période marquée par une mortalité de poissons. Rev. Hydrobiol Trop., 27: 251-263.
BAYS, J. S. & CRISMAN, T. L., 1983, Zooplankton and trophic state relationships in Florida lakes. Can J. Fish Aquat. Sci., 40: 1813-1819.
BEAVER, J. R. & CRISMAN, T. L., 1990, Use of microzooplankton as an early indicator of advancing cultural eutrophication. Verh. Internat. Verein. Limnol., 24: 532-537.
BLANCHER, E. C., 1984, Zooplankton-trophic relationship in some north and central Florida lakes. Hydrobiologia, 109: 251-263.
CARMOUZE, J. P. & VASCONCELOS, P., 1992, The eutrophication of the lagoon of Saquarema, Brazil. Sci. Tot. Environ. Suppl., 1992: 851-859.
CASTEL, J., CAUMETTE, P. & HERBERT, R., 1996, Eutrophication gradients in coastal lagoons as exemplified by the Bassin d’Arcachon and the Étang du Prévost. Hydrobiologia, 329: ix-xxviii.
DEL GIORGIO, P. A., BIRD, D. F., PRAIRIE, Y. T. & PLANAS, D., 1996, Flow cytometric determination of bacterial abundance in lake plankton with the green nucleic acid stain SYTO 13. Limnol. Oceanogr., 41: 783-789.
FARIA, B. M., 1993, Metabolismo e crises distróficas na laguna da Barra, Maricá, RJ. Masters Thesis, UFF, RJ, 86p.
FARIA, B. M., SUZUKI, M. S., PETRUCIO, M. M. & ENRICH-PRAST, A., 1998, Changes in metabolism of a Brazilian lagoon related to man-made marine entrances.
Verh. Internat. Verein. Limnol., 26: 1442-1444. GOLTERMAN, H. L., CLIMO, R. S. & OHNSTAD, M. A.
M., 1978, Methods for physical and chemical analysis of freshwaters. I.B.P. Handbook n.8. Blackwell Scientific Publications, Oxford, 213p.
GRAN, G., 1952, Determination of the equivalent point in potentiometric titrations. Part II. Analyst, 77: 661-671. HEERKLOβ, R. & HLAWA, S., 1995, Feeding biology of two brachionid rotifers: Brachionus quadridentatus and
Brachionus plicatilis. Hydrobiologia, 313/314: 219-221. KJERFVE, B., 1994, Coastal lagoons, pp. 1-8. In: B. Kjerfve (ed.), Coastal lagoon processes. Elsevier Science, Amsterdam.
KOROLEFF, F., 1976, Determination of phosphorus, pp. 117-126. In: K. Grasshoff (ed.), Methods of seawater analysis. Verlag Chemie, Weinheim/New York. LOPES-FERREIRA, C. M., 1995, O papel de uma região
colonizada por macrófitas aquáticas na depuração de efluentes domésticos na lagoa Imboacica (Macaé, RJ). Masters Thesis, UFRJ, RJ, 85p.
MACKERETH, F. J. H., HERON, J. & TALLING, J. F., 1978, Water analysis: some revised methods for limnologists. Freshwater Biological Association Scientific Publication n. 36,Ambleside, 120p.
NUSCH, E. A. & PALME, G., 1975, Biologische Methoden für die Praxis der Gewässeruntersuchung. GWF-Wasser/ Abwasser, 116:562-565.
POURRIOT, R., 1977, Food and feeding habits of Rotifera.
Arch. Hydrobiol. Beih. Ergebn. Limnol., 8: 243-260. SCHÄFER, A., 1992, Ecological characteristics of the coastal
lakes in southern Brazil: a synthesis. Acta Limnol. Brasil., 4: 111-122.
SEGERS, H., 1995, Nomenclatural consequences of some recent studies on Brachionus plicatilis (Rotifera, Brachionidae). Hydrobiologia, 313/314: 121-122. SUZUKI, M. S., 1997, Abertura da barra da lagoa de
Grussaí, São João da Barra, RJ: Aspectos hidroquímicos, dinâmica da comunidade fitoplanctônica e metabolismo. Ph.D. Thesis, UENF, Campos dos Goytacazes, RJ, 124p. STERNER, R. W., 1989, The role of grazers in phyto-plankton sucession, pp. 107-170. In: U. Sommer (ed.),
Plankton ecology. Springer-Verlag, Berlin.
URABE, J., NAKANISHI, M. & KAWABATA, K., 1995, Contribution of metazoan plankton to the cycling of nitrogen and phosphorus in Lake Biwa. Limnol. Oceanogr., 40(2): 232-241.
VADSTEIN, O., ∅IE, G. & OLSEN, Y., 1993, Particle size dependent feeding by the rotifer Brachionus plicatilis.
Hydrobiologia, 255/256: 261-267.
VON ENDE, C. N., 1993, Repeated-measures analysis: Growth and other time-dependent measures, pp. 113-137.