ABSTRACT:Insight of nutrient release patterns associated with the decomposition of plant resi-dues is important for their effective use as a green manure in food production systems. Thus, this study aimed to evaluate the ability of the Century, APSIM and NDICEA simulation models for predicting the decomposition and N mineralization of crop residues in the tropical Atlantic forest biome, Brazil. The simulation models were calibrated based on actual decomposition and N mineralization rates of three types of crop residues with different chemical and biochemical composition. The models were also validated for different pedo-climatic conditions and crop residues conditions. In general, the accuracy of decomposition and N mineralization improved after calibration. Overall RMSE values for the decomposition and N mineralization of the crop materials varied from 7.4 to 64.6 % before models calibration compared to 3.7 to 16.3 % after calibration. Therefore, adequate calibration of the models is indispensable for use them under humid tropical conditions. The NDICEA model generally outperformed the other models. How-ever, the decomposition and N mineralization was not very accurate during the first 30 days of incubation, especially for easily decomposable crop residues. An additional model variable may be required to capture initial microbiological growth as affected by the moisture dynamics of the residues, as is the case in surface residues decomposition models.
Keywords: modeling, nutrient cycling, organic agriculture, soil organic matter
Introduction
Nutrient release associated with the addition of or-ganic materials in agricultural systems plays a prominent role in the management of tropical soils where nutrient availability is limited (Tian et al., 2007). The addition of organic amendments influences short-term soil nutrient supply and in the long-term can also favor the build-up of organic matter and formation of stable soil aggregates (Palm et al., 2001). Insight of nutrient release patterns associated with the decomposition of plant residues is important for their effective use as a green manure in food production systems.
The decomposition of organic material in terrestrial ecosystems is controlled by its composition, soil biotic activity, and pedo-climatic conditions (Swift et al., 1979). The quality of organic materials used as a soil amendment has been considered being the most important factor con-trolling their subsequent decomposition and nutrient re-lease (Heal et al., 1997). A close correlation was observed between nutrient content of plant materials and decom-position rate (Cobo et al., 2002). On the other hand, lignin (L):nitrogen (N) ratio along with polyphenol (PP) content may influence decomposition and subsequent N release from plant material even to a larger extend than L and N contents (Melillo et al., 1982; Mendonça and Stott, 2003). The C:N, L:N, PP:N and (L+PP):N ratios were observed Received October 25, 2011
Accepted May 15, 2012
1UFV – Depto. de Solos, Av. P.H. Rolfs, s/n–36570-000 – Viçosa, MG – Brasil.
2UFES – Depto. de Produção Vegetal, C.P. 16 – 25000-000 – Alegre, ES – Brasil.
3Embrapa Meio Norte, C.P. 01 – 64006-220 – Teresina, PI – Brasil.
4University of Wageningen – Biological Farming Systems, Droevendaalsesteeg 1 – 6708 – PB, Wageningen – The Netherlands.
*Corresponding author <[email protected]>
Edited by: Fernando César Bachiega Zambrosi
Calibration and validation of models for short-term decomposition and N mineralization
Alexandre Ferreira do Nascimento1,§, Eduardo de Sá Mendonça1,2*, Luiz Fernando Carvalho Leite3, Johannes Scholberg4, Julio
Cesar Lima Neves1
of plant residues in the tropics
§Present Address: Embrapa Solos/UEP Recife, Rua Antônio Falcão, 402 – 51020-240 – Recife, PE – Brasil.
to be inversely correlated with N release from herbaceous material, while the weight loss of the material (decompo-sition) was increased with decrease in L:N and (L+PP):N ratios (Cobo et al., 2002).
In addition to the several intrinsic factors of organ-ic material, a number of interactive climatorgan-ic and edaphorgan-ic factors also control decomposition and nutrient release (Heal et al., 1997). However, it is difficult to quantify how these interactive factors affect the decomposition rate of organic material due to the inherent complex-ity of the underlying processes. Therefore tools such as simulation models can be effective to enhance our understanding of decomposition and N mineralization processes of crop residues used in agriculture. In this manner, specific field data may be used to generate more generic and useful management guidelines for farmers (Whitmore and Handayanto, 1997).
The study developed by Nascimento et al. (2011) indicated the difficulty of the models to estimate the de-composition and N mineralization in short-term. So, the purpose of this study was to evaluate the ability of the Cen-tury, APSIM and NDICEA simulation models to correctly predict the decomposition and subsequent N release rates of crop residues in the tropical Atlantic forest biome.
Materials and Methods
Material and experimental setup
42°32’30” W, 790 m asl), Minas Gerais state, Brazil. During the experiment the minimum temperature av-erage observed was 14.9 ºC, maximum temperatures average was 25.6 °C and the sum of rainfall during this period was 465 mm. The soil is classified as a Typic Hapludox (Soil Taxonomy), has a pH measured in water of 5.16, dystrophic, low aluminum satura-tion, a soil organic matter content of 57.4 g kg–1 and contains 520 g kg–1 clay.
The decomposition dynamics was determined dur-ing a period of 150 d for residues of Sunn Hemp ( Cro-talaria juncea L.) which is an annual leguminous cover-crop,Inga (Inga edulis) a perennial leguminous tree, and Brachiaria (Brachiaria decumbens Stapf.) a perennial tropical grass. The chemical and biochemical properties of the corresponding residues used in the experiment are listed in Table 1. The method using litter bag, located at the middle of the plot, with 4 mm of mesh and size 30 × 30 cm was used to estimate mass loss and N miner-alization rate with residue materials in litterbags being measured at 30, 60, 90, 120 and 150 d. The experiment was carried out in random blocks design with four repli-cates in a place cultivated with Coffea arabica cropping. Samples of the plant residues were collected at flowering of the plants and 100 g of dry matter were put into the litter bags and deposited in the respective treatments. The nitrogen remaining in the residue was determined by dry combustion in an elemental analyzer (Perkin El-mer CHNS/O 2400).
Model Parameterization and Calibration
Biomass decomposition and N mineralization rate predicted during 150 d by the models were tested based on surface application of organic materials. For Century, a scenario was created where the residue was applied on the soil surface (CLITTR in site.100). For APSIM, the residue module was used that simulates surface-applied residues. In the NDICEA the fresh organic matter was used as input variable based on the quantity and the characteristics of the applied organic materials.
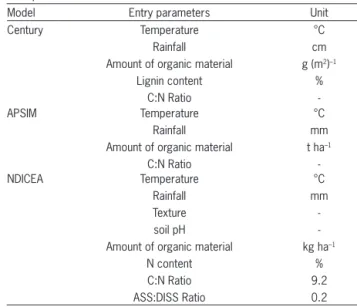
The models have some input variables in general, as temperature, rainfall and amount of organic material which were parameterized using the experimental data-set, such as weather and soil. More details and other in-put variables for the models are shown in Table 2. Model equations and further details can be found in Keating et al. (2003), Nascimento et al. (2011), Parton et al. (1994) and Van de Burgt et al. (2006).
After model parameterization, calibration was performed to ensure that observed and predicted values matched observed data by modifying pertinent model parameters for each model. For the Century model, the model parameters for both structural (DEC1) and meta-bolic residue (DEC2) material were adjusted; in APSIM, the value for the potential decomposition rate was modi-fied; for the NDICEA model coefficients for Initial Age of organic amendments was calibrated, which is directly related to its chemical and biochemical composition, thus an indication how recalcitrant organic materials are (Yang and Janssen, 2002). The other input variables of the models were not modified during model calibration since they were assumed to be linked to environmental or plant-specific material properties (such as tempera-ture, moistempera-ture, C:N ratio, etc.) that are defined by model input parameters. The adjusting of the parameters val-ues described above was done manually, which a lot of combinations were run until to reach the best fit (with smallest RMSE, such as described by equation 1).
Model Validation
The models thus parameterized were then evalu-ated under different conditions, which included differ-ent plant species, differdiffer-ent soil type for differdiffer-ent tem-perature regimes. The parameters calibrated (DEC1 and DEC2 in Century; potential decomposition rate in
Table 1 – Chemical and biochemical composition of plant material used in the calibration of the models.
Plant material C N P K Ca Mg HEM CEL LIG TSP
--- g kg–1
---Sunn Hemp 468 34.2 1.9 13.6 8.1 2.5 170 360 123 23.2
Inga 463 32.4 2.0 11.4 5.2 1.9 150 296 240 51.3
Brachiaria 422 17.8 1.8 10.3 6.0 6.6 262 385 78.0 18.3
HEM = hemicellulose; CEL = cellulose; LIG = lignin; TSP = total soluble polyphenols.
Table 2 – Main input variables in the simulation models tested for tropical conditions.
Model Entry parameters Unit
Century Temperature
Rainfall Amount of organic material
Lignin content C:N Ratio
°C cm g (m2)–1
%
-APSIM Temperature
Rainfall Amount of organic material
C:N Ratio
°C mm t ha–1
-NDICEA Temperature
Rainfall Texture soil pH Amount of organic material
N content C:N Ratio ASS:DISS Ratio
°C mm
-kg ha–1
APSIM; and initial age in NDICEA) were not modified during the models validation, maintaining the calibra-tion according to the chemical and biochemical composi-tion of the organic material. Experimental dataset were used from a study conducted by Espindola et al. (2006). This study was conducted in Seropédica, (22°45’40” S, 43°41’4” W, 25 m asl) Rio de Janeiro state (Typic Hap-ludult), with four plant materials: forage Peanut ( Ara-chis pintoi), tropical Kudzu (Pueraria phaseoloides), Sira-tro (Macroptilium atropurpureum) and weed fallow with predominantly Guinea grass (Panicum maximum). The content of C and N during the dry season in the forage Peanut residues was 45.9 % and 2.9 %, respectively; in the tropical Kudzu was 47.8 % and 2.5 %; in the Siratro was 47.2 % and 2.1 %; in the weed was 45.9 % and 1.1 %. The content of C and N during the rainy season in the forage Peanut residues was 48.4 % and 2.4 %, respec-tively; in the tropical Kudzu was 50.7 % and 2.4 %; in the Siratro was 49.5 % and 2.5 %; in the weed was 49.2 % and 0.6 %.
The dry matter remaining and N mineralization were evaluated for 150 days during the dry season and 150 days during the rainy season using litter bags. During the dry season the average maximum and min-imum temperatures were 29.2 and 17.5 °C, respec-tively, and rainfall of 197 mm; while during the rainy season the average maximum and minimum tempera-tures were 33.6 and 21.6 °C, respectively, and rainfall of 745 mm.
At the end of each period the authors calculated the constant k and the dry matter and N half-life using equations 2 to 4. So, to compare the data simulated and observed in the validation we used the same calculation (equations 2 to 4).Litter bags with 4 mm of mesh and size of 30 × 30 cm were used to estimate the mass loss and N mineralization. The experiment was carried out in random blocks design with 4 replicates in a place culti-vated with Musa spp. cropping.
Statistical analysis
Calibration
Evaluation of model performance for decompo-sition rate and N mineralization was based on visual/ graphical comparison of model-predicted values with observed field measurements. Such method provides a simple and qualitative way to assess if model predictions match actually data (Smith et al., 1996).
For the quantitative assessment of model perfor-mance we used the following statistic tests: root mean square error (RMSE) and linear regression equations.
Root mean square error (RMSE) was calculated following:
RMSE= [Σ(y – ŷ)2/n]1/2 (1)
where: y = measured value, ŷ = estimated value of y and n = number of observations.
Linear regression equations of the observed data were adjusted to those simulated by the models for each material, and it was statistically verified whether the intercept (β0) differed from zero and slope (β1) differed from one, calculated by the confidence interval of each component of the equation at 95 % probability. If the intercept, the slope or both components of the adjusted equations deviated from the tangent value (zero and one, respectively), this means that the models did not accu-rately simulate the plant material decomposition or N mineralization rate.
Validation
For the purpose of validation, the half-time life of or-ganic soil amendment was used as a quantitative compari-son of observed and simulated results of decomposition and N mineralization. For this, the constant k was calculat-ed (equation 2) for the simulatcalculat-ed data and comparcalculat-ed with the observed results. The following equation was used:
X = X0 e (-k x t) (2)
where: X is the amount of dry matter and N mineralized after a period of time, t; and X0 is the initial amount of dry matter or N in organic material. By rearranging the terms of equation 2 it is possible to calculate constant k as follows:
k = - ln (X / X0) / t (3)
Next step in the procedure to evaluate and rank simulation models is to compare the simulated and ob-served half-time life which expresses the time required for half of the residue to decompose or until half of the N contained in the residue is mineralized. The half-time life can be calculated using the following equation:
t1/2 = ln (2) / k (4)
where: t1/2 is the dry matter or nutrient half-life, ln(2) is a constant value and k is the constant of decomposition described above (Rezende et al., 1999).
Results
Calibration
great-Table 3 – Variable that controls the decomposition rate in the models in the original (default) and calibrated value for different plant materials for 150 days of decomposition in Araponga.
Plant material
Model
Century APSIM NDICEA
Default Calibrated Default Calibrated Default Calibrated
DEC 1a DEC 2b DEC 1 DEC 2
Decomposition
---Sunn Hemp 3.90 14.80 3.90 9.80 0.100 0.018 0.99 0.84
Inga 3.90 14.80 1.90 2.80 0.100 0.010 0.99 1.41
Brachiaria 3.90 14.80 1.90 4.80 0.100 0.014 0.99 0.99
N mineralization
---Sunn Hemp 3.90 14.80 3.90 9.80 0.100 0.030 0.99 0.54
Inga 3.90 14.80 1.90 2.80 0.100 0.010 0.99 1.07
Brachiaria 3.90 14.80 1.90 4.80 0.100 0.014 0.99 0.59
adecomposition of the structural compartment of the organic material. bdecomposition of the metabolic compartment of the organic material.
est for APSIM (RMSE range from 17 to 65 %) and low-est for NDICEA (RMSE range from 7 to 24 %), while Century had intermediate values (RMSE range from 12 to 47 %) (Figure 1).
To correctly describe N mineralization from Sunn Hemp, Inga and Brachiaria residues, initial age (IA) val-ues used to predict N mineralization rate in the NDI-CEA model were slightly lower (0.54, 1.07 and 0.59, re-spectively) than corresponding values that gave a best fit for decomposition (0.84, 1.41 and 0.99, respectively) (Table 3). However, though these processes are coupled and it appears that other model parameters that affect N mineralization may have to be adjusted as well. Cali-brated values for APSIM to correctly simulate N
miner-alization from Sunn Hemp residue were higher (0.030) than those determined for decomposition (0.018). For Century, calibrated values were identical for both the decomposition and N mineralization rates materials (Table 3).
Calibration enhanced the accuracy of the models to describe decomposition and N mineralization from plant residues (Figure 2). Overall RMSE values for the decomposition of the crop materials ranged from 7.4 to 64.6 % before models calibration compared to 2.7 to 10.8 % after calibration. For N mineralization similar observations were made (Figure 1 and 2). NDI-CEA described these two processes more accurately, and decomposition and N mineralization dynamics
typically fell within the confidence interval of the observed mean (Figure 2), while overall RMSE were relatively low and regression equations of measured vs. observed values never significantly deviated from the 1:1 line (Table 4).
For Sunn Hemp (Figure 2A; B), which is rep-resentative of tropical herbaceous legumes, the NDICEA-predicted values for decomposition and N mineralization rates most often fell within the con-fidence interval of the observed values while RMSE values were relatively low. None of the models con-sistently captured decomposition and mineralization dynamics of the Brachiaria residues (Figure 2E; F). For Inga, which was the most recalcitrant residue, NDI-CEA-based predictions (Figure 2C; D) for decomposi-tion and N mineralizadecomposi-tion rates more frequently fell within the confidence interval of the observed value compared to APSIM and Century. The NDICEA model also had the lowest RMSEvalues deviation followed by Century and APSIM, respectively.
Although designed for medium and long-term simulations, the accuracy of Century was generally adequate (RMSE values typically were below 20 % for decomposition and N mineralization) for the giv-en field conditions and in most cases predictions fell within the confidence interval of the observed means (Figure 2). However, for Sunn Hemp the intercept of the regression equation of the 1:1 line of predicted vs observed values deviated significantly from zero (Table 4).
For the APSIM model, the intercept and slope of the regression equation for decomposition of Inga residues differed from zero and one, respectively (Table 4). However, for N mineralization, the corresponding regression coefficients were not significantly, although overall R-squared values were a bit lower. Although RMSEvalues of APSIM were highest, overall model performance were still deemed satisfactory, since de-viation fell well below the 20 % limit considered excel-lent (Leite and Mendonça, 2007).
Validation
The calibration of the parameters that control the de-composition of the models (Table 2) were maintained and added to the climatic data, plant composition and soil attri-butes of the study developed by Espindola et al. (2006).
The simulated half-life for weed fallow plants by APSIM during the dry and rainy season differed from the other plant residues (Table 5), indicating that this model is
Table 4 – Linear regression equation of the decomposition and N mineralization rates observed ( ) in the plant materials in relation to the data simulated (x) by NDICEA, Century and APSIM, after 150 days of decomposition in Araponga.
Plant material Decomposition equation R² N mineralization equation R²
Century
Sunn Hemp = 8.070 + 0.890x 0.987 = 2.816 + 0.831x 0.819
Inga = 7.354 + 0.861x 0.861 = 14.550 + 0.763x 0.816
Brachiaria = 3.840 + 0.882x 0.903 = 12.820 + 0.754x 0.814
APSIM
Sunn Hemp = 1.036 + 0.908x 0.932 = -0.011 + 0.853x 0.812
Inga = 31.021 + 0.624x 0.862 = 17.976 + 0.728x 0.815
Brachiaria = 8.758 + 0.824x 0.888 = 5.725 + 0.825x 0.814
NDICEA
Sunn Hemp = 3.656 + 0.942x 0.988 = 0.538 + 0.935x 0.930
Inga = -1.081 + 1.013x 0.960 = 17.047 + 0.769x 0.892
Brachiaria = -1.858 + 0.960x 0.932 = 10.782 + 0.803x 0.866
Values in bold of the components of the adjusted equation, intercept or inclination differ statistically from 0 and 1, respectively, at 95 % probability.
Table 5 – Half-life (T1/2 - day) of the observed and simulated dry matter
and N remaining by NDICEA, Century and APSIM in 150 days of decomposition in the dry and rainy season in Seropédica, RJ.
Plant Material
Models
Observed¹ Century APSIM NDICEA d
---Dry season Dry matter
Peanut 34.65 ± 3.90 72.44 175.86 66.40
Kudzu 69.30 ± 21.60 67.47 168.55 66.40
Siratro 69.30 ± 94.96 75.94 181.17 66.40
Weed 138.60 ± 37.70 72.69 220.82 107.26
N
Peanut 43.31 ± 11.99 45.05 106.63 52.47
Kudzu 115.50 ± 32.92 44.67 103.01 49.03 Siratro 86.63 ± 35.54 46.19 109.69 53.42
Weed ND
Rainy season Dry matter
Peanut 23.90 ± 25.52 60.03 74.76 54.99
Kudzu 63.00 ± 19.87 62.37 74.77 54.99
Siratro 30.13 ± 10.10 59.85 75.13 54.99
Weed 99.00 ± 23.71 60.10 149.70 78.27
N
Peanut 31.50 ± 13.79 32.79 45.19 41.83
Kudzu 57.75 ± 16.46 33.32 45.34 41.83
Siratro 33.00 ± 11.00 32.77 45.34 41.16
Weed ND
more sensitive to the C:N ratio of organic residues, since the C:N ratios for weed fallow residues were much higher.
NDICEA-predicted values for the half-life of the residue dry matter during the dry season fell with-in the confidence with-interval for the residues of Kudzu, Siratro and weed fallow plants while for Peanut, the NDICEA matched actual values most closely (Table 5). The half-life of N in the plant materials simulated by NDICEA also feels within the confidence interval of Peanut and Siratro.
During the rainy season NDICEA estimated the half-life of dry matter within the confidence interval for both Kudzu and weed fallow plants residue, but over-predicted the persistence of the other residues although it matched actual values better for Peanut and Siratro residues (Table 5). It also estimated the N half-life in all plant materials within the confidence interval.
Although the performance of all models was good when estimating the half-life of dry matter and N in the rainy and dry season, NDICEA stood out with relative-ly more accurate estimates compared to the other mod-els (Table 5). During the dry season APSIM appeared to perform rather poorly in predicting the amount of dry matter remaining since it underestimated the de-composition rate of all tested materials (Table 5). This behavior was observed especially for the peanut resi-dues, which had an observed half-life of 35 days while APSIM predicted this value to be 176 days. This may be attributed to the greater sensitivity to climatic condi-tions. In this case model-predictions also showed a fac-tor two difference in decomposition rates between dry and rainy seasons; where as predicted differences were much smaller for the other models.
Discussion
The original default parameters of the models led to an over- or under-prediction of decomposition and N mineralization rates (Figure 1). Model calibration was therefore essential to improve the accuracy of model pre-dictions in short-term (Figure 2) (Müller et al, 2003). This can be attributed to the development and design of the simulation models, once the climatic conditions for the dataset used for model development differ greatly from the conditions prevailing in the tropics (Parton et al., 1987; Thorburn et al., 2001; Van de Burgt et al., 2006). However, the overall differences between predicted and observed values are still relatively small, specially with NDICEA, once predicted values below 20 % are consid-ered excellent when dealing with field simulation (Leite and Mendonça, 2007).
Owing to the different chemical and biochemical composition of plant residues, the parameters control-ling decomposition rates within Century (DEC 1 and 2), APSIM (decomposition potential) and NDICEA (IA) were calibrated (Table 3) for a range of residue materials differing in persistence. Therefore, decomposition pro-ceeds more slowly in materials that are more recalcitrant
(Constantinides and Fownes, 1994; Lupwayi and Haque, 1998), the parameter that controls the decomposition of the model was therefore adjusted accordingly.
Although NDICEA contains the IA (initial age) val-ues for a number of organic materials (Janssen, 1984; Janssen, 1996), these values were not corroborated by those observed in this study. Therefore, calibrated IA values were linked to the biochemical composition of the plant materials, mainly with the N, lignin and poly-phenols content, and their ratios, which influence the decomposition and N mineralization rate of plant organ-ic materials directly (Cobo et al., 2002; Constantinides and Fownes, 1994; Fox et al., 1990).
To simulate accurately the decomposition of plant residues of organic material,the parameter that controls the decomposition process in Century and APSIM was calibrated so as to decrease decomposition (Table 4), such as observed by Nascimento et al. (2011) to calibrate the same models to decomposition and N-release for 360 days. In the calibrated models, this reduction of the de-fault value of the parameter of Century and, more mark-edly for APSIM, suggested high sensitivity of the models to prevailing environmental conditions (Addiscott, 1995). Century integrates both temperature and precipitation conditions into a single parameter (Parton et al., 1987), which may reduce its sensitivity to variations of environ-mental characteristics in comparison with APSIM. The decomposition rate in Century is also controlled by the lignin content (Parton et al., 1987), which helps to adjust the decomposition estimated by this model, resulting in the minor discrepancies in the calibration compared to the original model.
After calibration, the models simulated decompo-sition and N mineralization rates from plant materials more accurately for the first 150 days of the process (Ta-ble 4). So once calibrated, the tested models can be used to describe both processes also for tropical conditions, as the validation data suggests (Table 5). However, after calibration NDICEA prediction generally matched ob-served data well for a range of environmental conditions and residues materials. Nevertheless, all models failed to correctly predict initial decomposition of residues, it is suggested that in this period (about 30 days) the loss of some chemical compounds by leaching (washing by rain or dew) or initial microbiological growth is presum-ably not taken into account by the models (Jans-Ham-mermeister and McGill, 1997; Heal et al., 1997; Swift et al., 1979).
with mechanistic ones that are appropriate for tropical conditions), examples included run-off and tillage compo-nents that are especially relevant for tropical conditions. However, a mechanistic representation of plant residue decomposition in the soil is rather difficult because the transformation of the original plant material cannot be measured directly in the soil (Jans-Hammermeister and McGill, 1997). Jans-Hammermeister and McGill (1997) listed two methods that can be used to overcome these problems: 1) regression analysis of the C mineralization curve (assuming that mineralization is equal to the decom-position rate), 2) calculation of microbiological growth in the decomposing residues. As suggested for Nascimento et al. (2011), even for trees and grass residues, a way of solving the difficulty in estimating decomposition and N mineralization during the initial months (rapid decompo-sition and N release) by Century and APSIM and even by NDICEA should be the incorporation of a variable repre-senting microbiological growth on the residue.
Conclusions
Century, APSIM and NDICEA overestimated or un-derestimated the decomposition and N mineralization rates of all plant materials. For the humid tropics initial models calibration of these models is therefore imperative when first introducing them into a specific pedo-climatic region.
The calibration of the models enhanced the accu-racy of estimates of the decomposition and N mineraliza-tion rates from organic plant materials. The accuracy of all models was satisfactory. By using the calibration and validation, NDICEA had the highest degree of accuracy when describing decomposition and N mineralization of plant residues under local conditions during 150 days.
Acknowledgements
The authors are thankful to the Brazilian Federal Agency for Support and Evaluation of Graduate Education (CAPES) for granting a fellowship to the first author. They are also indebted to the Agricultural Production Systems Research Unit (APSRU) of the University of Queensland, mainly to Dr. Christopher Murphy, who granted permis-sion to use the APSIM model. The authors also wish to thank Dr. Walter A.H. Rossing for providing support within the scope of the CAPES-Wageningen agreement.
References
Addiscott, T.M. 1995. Critical evaluation of models and their parameters. Journal of Environmental Quality 24: 803–807. Cobo, J.G.; Barrios, E.; Kass, D.C.L.; Thomas, R.J. 2002.
Decomposition and nutrient release by green manures in a tropical hillside agroecosystem. Plant and Soil 240: 331–342. Constantinides, M.; Fownes, J.H. 1994. Nitrogen mineralization
from leaves and litter of tropical plants: Relationship to nitrogen, lignin and soluble polyphenol concentrations. Soil Biology & Biochemistry 26: 49–55.
Espindola, J.A.A.; Guerra, J.G.M.; Almeida, D.L.; Teixeira, M.G.; Urquiaga, S. 2006. Decomposition and nutrient release of perennial herbaceous legumes intercropped with banana. Revista Brasileira de Ciência do Solo 30: 321–328 (in Portuguese, with abstract in English).
Fox, R.H.; Myers, R.J.K.; Vallis, I. 1990. The nitrogen mineralization rate of legume residues in soil as influenced by their polyphenol, lignin, and nitrogen contents. Plant and Soil 129: 251–259.
Heal, O.W.; Anderson, J.M.; Swift, M.J. 1997. Plant litter quality and decomposition: an historical overview. p. 3–30. In: Cadisch, G.; Giller, K.E., eds. Driven by nature: plant litter quality and decomposition. CAB International, Wallingford, UK.
Jans-Hammermeister, D.C.; McGill, W.B. 1997. Evaluation of three simulation models used to describe plant residue decomposition in soil. Ecological Modelling 104: 1–13. Janssen, B.H. 1984. A simple method for calculating decomposition
and accumulation of ‘young’ soil organic matter. Plant and Soil 76: 297–304.
Janssen, B.H. 1996. Nitrogen mineralisation in relation to C:N ratio and decomposability of organic materials. Plant and Soil 181: 39–45.
Keating, B.A.; Carberry, P.S.; Hammer, G.L.; Probert, M.E.; Robertson, M.J.; Holzworth, D.; Huth, N.I.; Hargreaves, J.N.G.; Meinke, H.; Hochman, Z.; Mclean, G.; Verburg, K.; Snow, V.; Dimes, J.P.; Silburn, M.; Wang, E.; Brown, S.; Bristow, K.L.; Asseng, S.; Chapman, S.; McCown, R.L.; Freebairn, D.M.; Smith, C.J. 2003. An overview of APSIM, a model designed for farming systems simulation. European Journal of Agronomy 18: 267–288.
Leite, L.F.C.; Mendonça, E.S. 2007. Prospects and limitations of modeling the dynamics of organic matter in tropical soils. v.5 p. 181–217. In: Ceretta, C.A.; Silva, L.S.; Reichert, J.M., eds. Tópicos em ciência do solo. Sociedade Brasileira de Ciência do Solo, Viçosa, MG, Brazil (in Portuguese, with abstract in English).
Lupwayi, N.Z.; Haque, I. 1998. Mineralization of N, P, K, Ca and Mg from Sesbania and Leucaena leaves varying in chemical composition. Soil Biology & Biochemistry 30: 337–343. Melillo, J.M.; Aber, J.D.; Muratore, J.F. 1982. Nitrogen and
lignin control of hardwood leaf litter decomposition dynamics. Ecology 63: 621–626.
Mendonça, E.S.; Stott, D.E. 2003. Characteristics and decomposition rates of pruning residues from a shaded coffee system in Southeastern Brazil. Agroforestry Systems 57: 117–125. Müller, T.; Magid, J.; Jensen, L.S.; Nielsen, N.E. 2003.
Decomposition of plant residues of different quality in soil: DAISY model calibration and simulation based on experimental data. Ecological Modelling 166: 3–18.
Nascimento, A.F.; Mendonça, E.S.; Leite, L.F.C.; Neves, J.C.L. 2011. Calibration of the Century, APSIM and NDICEA models of decomposition and N mineralization of plant residues in the humid tropics. Revista Brasileira de Ciência do Solo 35: 917–928.
Parton, W.J.; Ojima, D.S.; Cole, C.V.; Schimel, D.S. 1994. A general model for soil organic matter dynamics: sensitivity to litter chemistry, texture, and management. p. 147–167. In: Bryant, R.B.; Arnold, R.W., eds. Quantitative modelling of soil forming processes. Soil Science Society of America, Madison,WI, USA. Parton, W.J.; Schimel, D.S.; Cole, C.V.; Ojima, D.S. 1987. Analysis
of factors controlling soil organic matter levels in great plains grasslands. Soil Science Society of American Journal 51: 1173– 1179.
Rezende, C.P.; Cantarutti, R.B.; Braga, J.M.; Gomide, J.A.; Pereira, J.M.; Ferreira, E.; Tarré, R.; Macedo, R.; Alves, B.J.R.; Urquiaga, S.; Cadisch, G.; Giller, K.E; Boddey, R.M. 1999.
Litter deposition and disappearance in Brachiaria pastures in
the Atlantic Forest region of the south of Bahia, Brazil. Nutrient Cycling in Agroecosystems 54: 99–112.
Smith, J.U.; Smith, P.; Addiscott, T. 1996. Quantitative methods to evaluate and compare soil organic matter (SOM) models. p. 181–200. In: Powlson, D.S.; Smith, P.; Smith, J.U., eds. Evaluation of soil organic matter models using existing, long-term datasets. Springer, Berlin, Germany.
Swift, M.J.; Heal, O.W.; Anderson, J.M. 1979. Decomposition in Terrestrial Ecosystems. Blackwell Scientific, Berkeley, CA, USA.
Thorburn, P.J.; Probert, M.E.; Robertson, F.A. 2001. Modelling decomposition of sugar cane surface residues with APSIM-Residue. Field Crops Research 70: 223–232.
Tian, G.; Badejo, M.A.; Okoh, A.I.; Ishida, F.; Kolawole, G.O.; Hayashi, Y.; Salako, F.K. 2007. Effects of residue quality and climate on plant residue decomposition and nutrient release along the transect from humid forest to Sahel of West Africa. Biogeochemistry 86: 217–229.
Van de Burgt, G.J.H.M.; Oomen, G.J.M.; Habets, A.S.J.; Rossing, W.A.H. 2006. The NDICEA model, a tool to improve nitrogen use efficiency in cropping systems. Nutrient Cycling in Agroecosystems 74: 275–294.
Whitmore, A.P.; Handayanto, E. 1997. Simulating the mineralization of N from crop residues in relation to residue quality. p. 337–362. In: Cadisch, G.; Giller, K.E., eds. Driven by nature: plant litter quality and decomposition. CAB International, Wallingford, UK.