LEAF AREA INDEX OF GROUND COVERS IN
A SUBTROPICAL WATERSHED
Alexandre Cândido Xavier; Carlos Alberto Vettorazzi*
USP/ESALQ - Depto. de Engenharia Rural, C.P. 9 - 13418-900 - Piracicaba, SP- Brasil. *Corresponding author <[email protected]>
ABSTRACT: Leaf Area Index (LAI), an important structural variable descriptive of vegetation, is directly related to evapotranspiration and productivity. The objective of this work was to measure and analyze monthly LAI of different ground covers in a subtropical watershed. A field campaign to collect monthly LAI data was carried out during the year 2001, with a LAI-2000 (plant canopy analyzer) device, in sugarcane, pasture, corn, eucalypt, and riparian forest patches. Riparian forest presented a maximum LAI of 4.90; LAI values decreased as precipitation decreased, as it is a characteristic of this type of semideciduous vegetation. LAI for sugar cane presented the greatest variability throughout the year, related to plant characteristics and crop management in the study area. Results represent an initial step for the understanding of LAI dynamics in the study area and areas under similar conditions.
Key words: LAI-2000, plant canopy, biophysical variable
ÍNDICE DE ÁREA FOLIAR DE COBERTURAS DO SOLO
EM UMA MICROBACIA HIDROGRÁFICA SUBTROPICAL
RESUMO: O Índice de Área Foliar (IAF) é uma importante variável estrutural descritora da vegetação, diretamente relacionada com a evapotranspiração e a produtividade. O objetivo deste trabalho foi estruturar e analisar um banco de dados de valores mensais de IAF de diferentes coberturas do solo em uma microbacia hidrográfica subtropical. Uma campanha de campo de coleta de dados mensais de IAF, com o auxílio do equipamento LAI-2000 (analisador de dossel de plantas), foi realizada durante o ano de 2001, em áreas de cana-de-açúcar, pastagem, milho, eucalipto e floresta ripária. O valor máximo do IAF foi de 4,90, para floresta ripária; este valor apresentou uma queda com a diminuição da precipitação, característica deste tipo de vegetação semidecidual. O IAF da cana-de-açúcar apresentou a maior variabilidade durante o período de coleta, devido às características próprias da cultura e seu manejo na área em estudo. Os resultados apresentados representam um passo inicial para o entendimento da dinâmica do IAF na área em estudo e áreas similares.
Palavras-chave: LAI-2000, dossel, variável biofísica
INTRODUCTION
Leaf Area Index (LAI), the ratio of leaf area per soil surface area (Watson, 1947), is an important struc-tural variable of vegetation, and associated by model-ling, with variations in primary net yield (Matsushita & Tamura, 2002) and evapotranspiration for a given area (Sellers et al., 1997), as well as with climatic global changes (Betts et al., 1997). LAI models are directly related to several physical processes of the vegetation; for example: the fraction of photosyntheti-cally active radiation that is absorbed by the canopy (Wiegand & Richardson, 1990); the canopy’s ability to intercept rain (van Dijk & Bruijnzeel, 2001); the canopy’s resistance and conductance (Saigusa et al., 1998); etc.
Remote Sensing (RS) data is the only possible way to estimate this variable and calculating evapotrans-piration on a regional basis. One convenient way of esti-mating LAI by RS is using relational functions between
Vegetation Indices (VIs) and LAI (Myneni et al., 1995). However, VIs are sensitive to the combined effect of the canopy’s structure and the sun-sensor geometry (Goetz, 1997; Deering et al., 1999), making it difficult to esti-mate LAI without an adequate calibration of this variable with LAI data acquired in the study area at the same time RS data were collected.
MATERIAL AND METHODS
Study area
The study area was the Ribeirão dos Marins wa-tershed, an area of approximately 5,973 ha located be-tween coordinates 22º41’ S and 22°51’ S, and 47º40’ W and 47°45’ W, in Piracicaba, SP, Brazil. The watershed is part of the State of São Paulo’s Hydrological Network, and is operated by the Departamento de Águas e Energia Elétrica e Centro Tecnológico de Hidráulica, Universidade de São Paulo. Several hydrological instru-ments, such as pluviographs and a limnimetric station, are installed in the area. Region’s climate is subtropical hu-mid (Cwa), according to Koeppen’s classification, with rainy summer and dry winter; mean annual precipitation is 1278.0 mm (Sentelhas et al., 1998). The soils in the region are represented by Typic Paleudults, Rhodic Eutrudox, Rhodic Hapludox, Xanthic, Lithic Udorthents and Kandiudalfic Eutrudox (Oliveira, 1999). The topog-raphy of the area varies between rolling and strongly roll-ing hills (Teramoto, 1995).
LAI Data Collection
Between the 15th and the 20th day of each month,
41 areas were visited and LAI was measured with a plant canopy analyzer, model LAI-2000 (LI-COR, 1992), ac-cording to the presence of vegetation in the area. To cal-culate LAI, the LAI-2000 device utilizes the canopy’s gap fraction, which allows a view of the sky in some direc-tions below the canopy (Welles, 1990). The ratio between readings obtained with the LAI-2000 below the canopy and those obtained outside the canopy is utilized to ob-tain an estimate of the gap fraction in five angles: LAI is them calculated based on those readings, as follows:
(1)
where: Ti represents the 5 gap fractions; Wi represents sinθdθ for the five view angles of the LAI-2000 sensor; Si=1/cosθ; and θis the zenith angle.
Areas for LAI evaluation represented the exist-ing variety of land uses and ground covers in the water-shed; showed homogeneous traits, such as plant vigor, height and distribution; allowed the selection of a greater number of sugarcane samples, since this crop occupies the largest area of occurrence and presents great LAI vari-ability in a given period, related to variations in planting season. To avoid underestimation, LAI measurements were performed in cloudy days, and when that was not possible, measurements were taken before 9:00 a.m. and after 4:00 p.m., when solar elevation angle was smaller, and the sensor was kept constantly in the shade. The num-ber of replicates per type of land use was calculated ac-cording to the LI-COR (1992) methodology. Six replicates
were performed with the sensor within the canopy, and the number of replicates necessary to estimate the true mean was determined by the ratio between the corre-sponding standard deviation and replicates mean, at the 95% confidence level.
The numbers of replicates determined for sugar-cane, maize and pasture areas were 16 for replicates made within and 2 made above the canopy, while for native for-est and eucalyptus plantations, those numbers were 10 for replicates below, and 1 for replicates above the canopy. With respect to the distribution of LAI measurements un-der the canopy, measurements were made within the canopy in sugarcane and maize by varying the position among planting rows. The measurement height in those crops varied according to the presence of senescent leaves, and an attempt was made to avoid these, by al-ways raising the sensor above them. In eucalyptus plan-tations, the row spacing between replicates was prefer-entially 5 m at 0.5 m above the ground.
RESULTS AND DISCUSSION
During the field campaign, the mean temperature was 22.5oC (annual mean of 21.4ºC) with a mean monthly
maximum of 26.0oC and mean monthly minimum of
18.5oC during the months of February and June (mean
annual maximum of 24.9oC and mean annual minimum
of 17.1oC), respectively (DCE, 2002, Figure 1a). The
to-tal annual precipitation was 1,371.8 mm (DAEE, 2002) (1,278.0 mm mean), and the accumulated precipitation for months between April and August corresponded to only 21% of the total precipitation, with the remainder distrib-uted through the other months. Figure 1b depicts the re-lation between temperature and precipitation (R2 = 0.84).
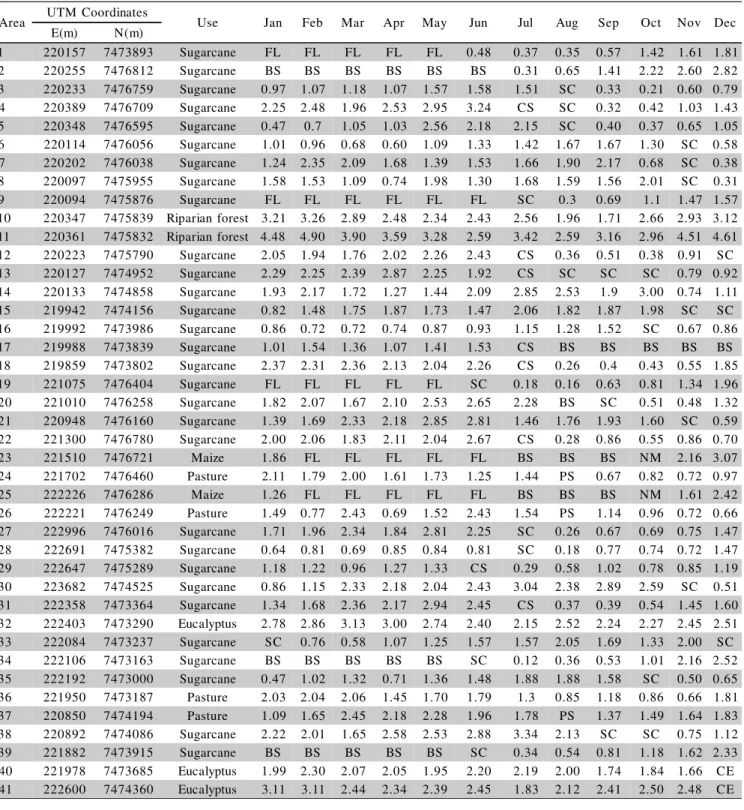
Forty one areas with different ground covers were visited monthly (Table 1). The measured LAI values in the study area ranged from a minimum of 0.16 and a maximum of 4.90, in sugarcane and riparian forest areas, respectively. The LAI measurements showed a mean stan-dard deviation of 0.13, and 80% of the stanstan-dard devia-tion values were smaller than 0.20. It must be taken into account that part of the variation in LAI measured be-tween months, for different ground covers in each area, was attributed to the fact that measurement locations were not precisely the same; despite the fact that the selected areas were as homogeneous as possible, they still showed internal variations in vigor, and were not located pre-cisely, since the GPS receptor utilized to locate the mea-surement points showed a positioning error of approxi-mately 15 m. An evaluation of LAI variation for differ-ent ground cover types found at the watershed is pre-sented ahead.
some assumptions required by the methodology to cal-culate LAI with this equipment, which may not occur un-der forest canopies, for instance the random distribution of leaves, since leaf overlapping usually occurs in forest canopies (Chen et al., 1991).
The most typical species that occur in the region’s riparian forest areas are: fig trees (Ficus spp.), louveira (Cyclolobium vecchii A. Samp.), guanandi (Callophyllum brasiliensis Camb.), inga trees (Inga affinis CD. Hook et
Arn), and canela-do-brejo (Endlicheria paniculata (Spreng.) Macbr.), among others (Rodrigues, 1999). Two riparian forest areas were observed throughout the year, and the mean LAI was 3.14, with a maximum of 4.90 (February, area 11), recorded after the rainy months (Fig-ure 2a). The smallest LAI value was 1.71 (area 10), re-corded during the last dry month (September). No LAI value for this type of ground cover was found in the lit-erature for comparison purposes.
Table 1 - Results from LAI data collection in the field, where: FL, fallow; BS, bare soil; CS, cut sugarcane; SC, planted/ ratoon sugarcane; DP, dry pasture; CE, clear cut eucalyptus; and, NM, new maize.
Area UTM Coordinates Use Jan Feb Mar Apr May Jun Jul Aug Sep Oct Nov Dec
E(m) N(m)
1 220157 7473893 Sugarcane FL FL FL FL FL 0.48 0.37 0.35 0.57 1.42 1.61 1.81
2 220255 7476812 Sugarcane BS BS BS BS BS BS 0.31 0.65 1.41 2.22 2.60 2.82
3 220233 7476759 Sugarcane 0.97 1.07 1.18 1.07 1.57 1.58 1.51 SC 0.33 0.21 0.60 0.79 4 220389 7476709 Sugarcane 2.25 2.48 1.96 2.53 2.95 3.24 CS SC 0.32 0.42 1.03 1.43 5 220348 7476595 Sugarcane 0.47 0.7 1.05 1.03 2.56 2.18 2.15 SC 0.40 0.37 0.65 1.05 6 220114 7476056 Sugarcane 1.01 0.96 0.68 0.60 1.09 1.33 1.42 1.67 1.67 1.30 SC 0.58 7 220202 7476038 Sugarcane 1.24 2.35 2.09 1.68 1.39 1.53 1.66 1.90 2.17 0.68 SC 0.38 8 220097 7475955 Sugarcane 1.58 1.53 1.09 0.74 1.98 1.30 1.68 1.59 1.56 2.01 SC 0.31
9 220094 7475876 Sugarcane FL FL FL FL FL FL SC 0.3 0.69 1.1 1.47 1.57
10 220347 7475839 Riparian forest 3.21 3.26 2.89 2.48 2.34 2.43 2.56 1.96 1.71 2.66 2.93 3.12 11 220361 7475832 Riparian forest 4.48 4.90 3.90 3.59 3.28 2.59 3.42 2.59 3.16 2.96 4.51 4.61 12 220223 7475790 Sugarcane 2.05 1.94 1.76 2.02 2.26 2.43 CS 0.36 0.51 0.38 0.91 SC
13 220127 7474952 Sugarcane 2.29 2.25 2.39 2.87 2.25 1.92 CS SC SC SC 0.79 0.92
14 220133 7474858 Sugarcane 1.93 2.17 1.72 1.27 1.44 2.09 2.85 2.53 1.9 3.00 0.74 1.11 15 219942 7474156 Sugarcane 0.82 1.48 1.75 1.87 1.73 1.47 2.06 1.82 1.87 1.98 SC SC 16 219992 7473986 Sugarcane 0.86 0.72 0.72 0.74 0.87 0.93 1.15 1.28 1.52 SC 0.67 0.86
17 219988 7473839 Sugarcane 1.01 1.54 1.36 1.07 1.41 1.53 CS BS BS BS BS BS
18 219859 7473802 Sugarcane 2.37 2.31 2.36 2.13 2.04 2.26 CS 0.26 0.4 0.43 0.55 1.85
19 221075 7476404 Sugarcane FL FL FL FL FL SC 0.18 0.16 0.63 0.81 1.34 1.96
20 221010 7476258 Sugarcane 1.82 2.07 1.67 2.10 2.53 2.65 2.28 BS SC 0.51 0.48 1.32 21 220948 7476160 Sugarcane 1.39 1.69 2.33 2.18 2.85 2.81 1.46 1.76 1.93 1.60 SC 0.59 22 221300 7476780 Sugarcane 2.00 2.06 1.83 2.11 2.04 2.67 CS 0.28 0.86 0.55 0.86 0.70
23 221510 7476721 Maize 1.86 FL FL FL FL FL BS BS BS NM 2.16 3.07
24 221702 7476460 Pasture 2.11 1.79 2.00 1.61 1.73 1.25 1.44 PS 0.67 0.82 0.72 0.97
25 222226 7476286 Maize 1.26 FL FL FL FL FL BS BS BS NM 1.61 2.42
26 222221 7476249 Pasture 1.49 0.77 2.43 0.69 1.52 2.43 1.54 PS 1.14 0.96 0.72 0.66 27 222996 7476016 Sugarcane 1.71 1.96 2.34 1.84 2.81 2.25 SC 0.26 0.67 0.69 0.75 1.47 28 222691 7475382 Sugarcane 0.64 0.81 0.69 0.85 0.84 0.81 SC 0.18 0.77 0.74 0.72 1.47 29 222647 7475289 Sugarcane 1.18 1.22 0.96 1.27 1.33 CS 0.29 0.58 1.02 0.78 0.85 1.19 30 223682 7474525 Sugarcane 0.86 1.15 2.33 2.18 2.04 2.43 3.04 2.38 2.89 2.59 SC 0.51 31 222358 7473364 Sugarcane 1.34 1.68 2.36 2.17 2.94 2.45 CS 0.37 0.39 0.54 1.45 1.60 32 222403 7473290 Eucalyptus 2.78 2.86 3.13 3.00 2.74 2.40 2.15 2.52 2.24 2.27 2.45 2.51 33 222084 7473237 Sugarcane SC 0.76 0.58 1.07 1.25 1.57 1.57 2.05 1.69 1.33 2.00 SC
34 222106 7473163 Sugarcane BS BS BS BS BS SC 0.12 0.36 0.53 1.01 2.16 2.52
35 222192 7473000 Sugarcane 0.47 1.02 1.32 0.71 1.36 1.48 1.88 1.88 1.58 SC 0.50 0.65 36 221950 7473187 Pasture 2.03 2.04 2.06 1.45 1.70 1.79 1.3 0.85 1.18 0.86 0.66 1.81 37 220850 7474194 Pasture 1.09 1.65 2.45 2.18 2.28 1.96 1.78 PS 1.37 1.49 1.64 1.83 38 220892 7474086 Sugarcane 2.22 2.01 1.65 2.58 2.53 2.88 3.34 2.13 SC SC 0.75 1.12
39 221882 7473915 Sugarcane BS BS BS BS BS SC 0.34 0.54 0.81 1.18 1.62 2.33
The reason for LAI variation in the riparian for-est is related to traits of this type of vegetation, which is semideciduous, i.e., part of the species shed their leaves under water stress. As a matter of fact, LAI shows a de-pendence relationship with precipitation (Figure 2b), with a positive correlation of 0.57.
Figure 3 shows the variation in LAI for adult eu-calyptus throughout the year, in the three areas where measurements were obtained for this variable. Minimum, maximum and mean LAI values in those areas were 1.66 (area 40, November), 3.13 (area 32, March) and 2.36, re-spectively. In December, two areas planted with eucalyp-tus were clear cut (areas 40 and 41). The LAI-2000 equip-ment has been utilized by several authors to estimate LAI in eucalyptus (Hingston et al., 1998; Xavier et al., 2002; Ares & Fownes, 2000). In addition to the edaphic and cli-matic factors that cause LAI variations, Xavier et al. (2002) observed that LAI was distinct for different ge-netic materials with the same age and that LAI can ei-ther become stabilized or show decline with age.
Ares & Fownes (2000) observed that LAI in eu-calyptus plantations decreased as the local altitude increased, but this does not explain LAI variations in our study area, located practically at the same altitude,
Figure 3 - LAI variation throughout the year for eucalyptus plantations with corresponding confidence interval. 0
1 2 3 4 5
Jan Feb Mar Apr May Jun Jul Aug Sep Oct Nov Dec
Month
LAI
Area 32 Area 40 Area 41
approximately 600 m. Xavier et al. (2002) in Brazil, and Hingston et al. (1998), in Australia, found a maximum LAI of 4.31 and 4.03, respectively, measured with the LAI-2000 device. LAI variability in this crop is quite high, depending on factors such as those mentioned be-fore, so that the LAI data found in this work are in agreement with those found in other studies.
No relationship between LAI and monthly pre-cipitation or mean monthly temperature was observed. For the most part of the year, LAI values for eucalyptus in the three areas were distinct (P < 0.05). In area 41 there was a 25% LAI decrease along the months, while in the
0 50 100 150 200 250
Jan Feb Mar Apr May Jun Jul Aug
f Sep Oct Nov Dec
Month
Precipitation (mm)
0 5 10 15 20 25 30
Temperature (
ºC)
Precipitation Temperature
Figure 1 - Climatological data for the Ribeirão dos Marins watershed. Precipitation variation (DAEE, 2002) and mean monthly temperature (a) and its corresponding scatter diagram (b), where: R2 is the coefficient of determination; N is the number of samples; se is the standard error of the estimate and P is the level of significance.
Prec. = 21.2T – 364.0 R2 = 0.70;N= 12
se= 42.03;P < 0.01
0 50 100 150 200 250
15 20 25 30
Temperature (ºC)
Precipitation (mm)
(a) (b)
0 1 2 3 4 5
Jan Feb Mar Apr May Jun Jul Aug Sep Oct Nov Dec Month
LAI
Riparian forest (area 10) Riparian forest (area 11)
Figure 2 - LAI variation throughout the year with the corresponding confidence interval (95% confidence) (a) and monthly LAI scatter diagram for the riparian forest with the corresponding precipitation (b).
0 1 2 3 4 5
Jan Feb Mar Apr May Jun Jul Aug Sep Oct Nov Dec
Month LAI Area 34 Area 9 Area 19 Area 2 Area 39
other areas (32 and 40) this was not verified, since the mean values for January and December were equal (P < 0.05).
The estimation of LAI values with the LAI-2000 equipment in pasture areas is subject to restrictions be-cause of the sensor’s height (Welles & Norman, 1991), which is 3 cm. Therefore, the index can be underesti-mated in shallow pastures. However, the studied pastures showed heights always above 10 cm, except in August, when no measurements were made since they were com-pletely dry, because of drought and/or heavy grazing. The highest, lowest, and mean LAI values measured in pas-ture areas were 2.45 (area 26, June), 0.66 (area 36, No-vember) and 1.49, respectively (Figure 4). LAI values de-termined by the weighings method (Daughtry, 1990) in Brazil varied from 0.49 to 3.90 (Roberts et al., 1996). Because of the crop’s intense dynamics, related to cattle grazing, no significant LAI relationship was found, ei-ther with the monthly precipitation or with the mean tem-perature.
The highest LAI value in sugarcane was 3.34 (area 38, July), which is lower than values found in other studies (Keating et al., 1999; Cheeroo-Nayamuth et al., 2000), and even lower than the measurement made by Machado et al. (1982), in the same region (3.70, 300-day old sugarcane). In addition to the relative measurements provided by the LAI-2000 equipment, the highest LAI values must be associated with the fact that the type of genetic material is distinct, and the management tech-niques utilized for the crop are different (for example: spacing between plants, fertilization, irrigation etc.) in the several study areas.
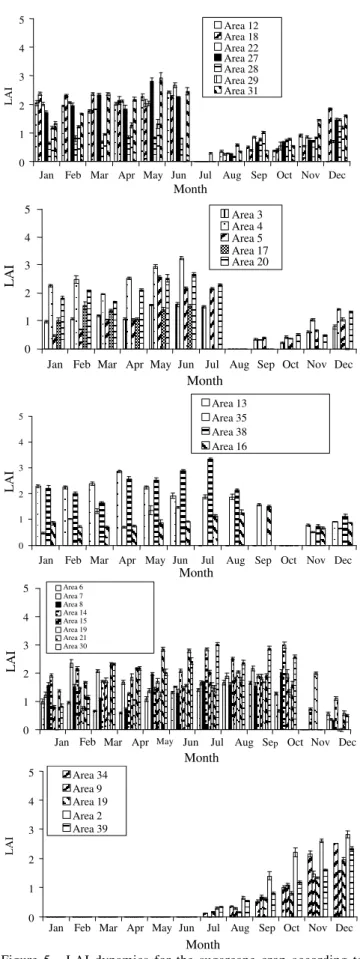
In the area under study, sugarcane planting/re-growth is concentrated in the beginning of the first se-mester, with harvest occurring after 18 months (1.5-year old sugarcane) or in the middle of the second semester if harvest happens after 12 months (one-year old sugarcane) (Koffler et al., 1979). Figure 5 represents the temporal variability for planting/regrowth and for LAI development in sugarcane planted or cut in the months of June and July (Figure 5a), extending through October and November (Figure 5c), coincident with the beginning of the rainy
Figure 4 - LAI variation throughout the year for pasture with its corresponding confidence interval (P < 0.05).
0 1 2 3 4 5
Jan Feb Mar Apr May Jun Jul Aug Sep Oct Nov Dec
Month LAI Area 24 Area 26 Area 36 Area 37
Figure 5 - LAI dynamics for the sugarcane crop according to planting months: June and July (a); August and September (b); October and November (c); without a defined planting month (d); and, fallowing area until May but planted in June and July (e).
0 1 2 3 4 5
Jan Feb Mar Apr May Jun Jul Aug Sep Oct Nov Dec Month LAI Area 13 Area 35 Area 38 Area 16 0 1 2 3 4 5
Jan Feb Mar Apr May Jun Jul Aug Sep Oct Nov Dec Month LAI Area 3 Area 4 Area 5 Area 17 Area 20 0 1 2 3 4 5
Jan Feb Mar Apr May Jun Jul Aug Sep Oct Nov Dec
Month LAI Area 12 Area 18 Area 22 Area 27 Area 28 Area 29 Area 31 0 1 2 3 4 5
season in the region. Some areas under observation were fallowed until June, when planting was done (Figure 5e). Finally, Figure 5d presents the areas where planting sea-son could not be determined.
Figure 6 presents the relationship of sugarcane LAI with planting/regrowth month (Planting) and the crop’s age (Age), for field-collected samples, where only LAI data from Figures 5a, 5b, 5c and 5e were considered, hence these areas were planted with sugarcane grown at a 12-month cycle. Samples in Figure 5d were not con-sidered, since the planting season could not be estab-lished. The total LAI variation explained by the planting month and crop age was 47% (P < 0.01). LAI showed the highest values after approximately 10 months after planting, in agreement with results of Machado et al. (1982). It is quite difficult to generate LAI maps during a given season in a watershed without a good knowledge of land use, since each sugarcane area has its own plant-ing season and age and, therefore, distinct LAI develop-ments. The mean error while obtaining LAI estimates was 0.65. LAI=f(Age, Planting) was determined by:
LAI=-0.7647+0.6219Age-0.0227Age2+0.0085Planting2
-0.0221Age.Planting, (2)
Two maize stands planted in October were ob-served; the maximum LAI value obtained was 3.07 (area 23). A reference point is provided by Oliveira et al. (1993), who obtained a maximum LAI of 2.45 with irri-gated maize in Brazil. Again, differences in genetic ma-terial and management between the studies explain this difference.
CONCLUSIONS
LAI data found in this work are not conclusive, since the LAI measurements obtained with the LAI-2000 equipment are relative. An evaluation between the LAI estimate obtained with LAI-2000 and the LAI evaluated by direct measurements should be done in future stud-ies. The measured LAI data showed great temporal vari-ability, depending on the type of cover, climatological conditions and type of management.
ACKNOWLEDGEMENTS
To Fundação de Amparo a Pesquisa do Estado de São Paulo Research Foundation (FAPESP) for the finan-cial support to this study (2000/09325-0) and for the fel-lowship for the first author (98/14499-5).
REFERENCES
ARES, A.; FOWNES, J.H. Productivity, nutrient and water-use efficiency
of Eucalyptus saligna and Toona ciliata in Hawaii. Forest Ecology and
Management, v.139, p.227-236, 2000.
BATTAGLIA, M.; CHERRY, M.L.; BEADLE, C.L.; SANDS, P.J.; HINGSTON A. Prediction of leaf area index in eucalypt plantations: effects of water stress and temperature. Tree Physiology, v.18, p.521-528, 1998.
BETTS, R.A.; COX, P.M.; LEE, S.E.; lan WOODWARD, F. Contrasting physiological and structural vegetation feedbacks in climate change simulations. Nature, v.387, p.796-799, 1997.
CHEEROO-NAYAMUTH, F.C.; ROBERTSON, M.J.; WEGENER, M.K.; NAYAMUTH, A.RH. Using a simulation model to assess potential and attainable sugar cane yield in Mauritius. Field Crops Research, v.66, p.225-243, 2000.
CHEN, J.M.; BLACK, T.A.; ADAMS, R.S. Evaluation of hemispherical photography for determining plant area index and geometry of a forest stand. Agricultural and Forest Meteorology, v.56, p.129–143, 1991.
DAUGHTRY, C.S.T. Direct measurement of canopy structure. In: GOEL, N.S.; NORMAN, J.M. (Ed.) Instrumentation for studying vegetation
canopies for remote sensing in optical and thermal infrared regions.
New York: Harwood Academic, 1990. p.45-60.
DEPARTAMENTO DE ÁGUAS E ENERGIA ELÉTRICA. http:// www.daee.sp.gov.br/servicos/tabbmt.htm. (10 jan. 2002).
DEPARTAMENTO DE CIÊNCIAS EXATAS. http://www.ciagri.usp.br/ ~emdabreu/MEDIAS.TXT. (10 jan. 2002).
DEERING, D.W.; ECK, T.F.; BANERJEE, B. Characterization of the reflectance anisotropy of boreal forest canopy in spring-summer. Remote
Sensing of Environment, v.67, p.205-229, 1999.
GOETZ, S.J. Multi-sensor analysis of NDVI, surface temperature and biophysical variables at a mixed grassland site. International Journal
of Remote Sensing, v.18, p.71-94, 1997.
HINGSTON, F.J.; GALBRAITH, J.H.; DIMMOCK, G. M. Application of the process-based model BIOMASS to Eucalyptus globulus subsp.
globulus plantations on ex-farmland in southwestern Australia - I. Water
use by trees and assessing risk of losses due to drought. Forest Ecology
and Management, v.106, p.141–156, 1998.
KEATING, B.A.; ROBERTSON, M.J.; MUCHOW, R.C.; HUTH, N.I. Modelling sugarcane systems: I. Development and performance of the sugarcane module. Field Crops Research, v.61, p.253-271, 1999. KOFFLER, N.F.; CAVALLI, A.C.; CHIARINI, J.V.; NOGUEIRA, F.P.
Inventário canavieiro com o auxílio de fotografias aéreas. Boletim
Técnico Planalsucar, v.1, p.3-38, 1979.
LI-COR. LAI-2000 plant canopy analyzer: instruction manual.Nebraska, 1992. 182p.
Received August 30, 2002 Accepted April 28, 2003 MACHADO, E.C.; PEREIRA, A.R.; FAHL, J.I.; ARRUDA, H.V.; CIONE
J. Índices biométricos de duas variedades de cana-de-açúcar. Pesquisa
Agropecuária Brasileira, v.17, p.1323-1329, 1982.
MATSUSHITA, B.; TAMURA, M. Integrating remotely sensed data with an ecosystem model to estimate net primary productivity in East Asia.
Remote Sensing of Environment, v.81, p.58-66, 2002.
MYNENI, R.B.; MAGGION, S.; IAQUINTA, J.; PRIVETTE, J.L.; GOBRON, N.; PINTY, B.; KIMES, D.S.; VERSTRAETE, M.M.; WILLAMS, D.L. Optical remote sensing of vegetation: modeling, caveats, and algorithms. Remote Sensing of Environment, v.51, p.169–188, 1995. OLIVEIRA, F.A.; SILVA, J.J.S.; CAMPOS T.G.S. Evapotranspiração e desenvolvimento radicular do milho irrigado. Pesquisa Agropecuária
Brasileira, v.28, p.1407-1415, 1993.
OLIVEIRA, J.B. Solos da folha de Piracicaba. Campinas: Instituto Agronômico, 1999. 173p. (Boletim Científico, 48).
ROBERTS, J.M.; CABRAL, O.M.R.; da COSTA, J.P.; McWILLIAN, A.-L.C.; de A. SÁ, T.D. An overview of the leaf area index and physiological measurements during ABRACOS. In: GASH, J.H.C.; NOBRE, C.A.; ROBERTS, J.M.; VICTORIA, R.L. (Ed.) Amazon deforestation and
climate. Chichester: John Wiley, 1996. p.287-306.
RODRIGUES, R.R. A vegetação de Piracicaba e municípios do entorno. Piracicaba: IPEF, 1999. 18p. (Circular Técnica, 189).
SAIGUSA, N.; OIKAWA, T.; LIU, S. Seasonal variations of the exchange CO2 and H2O between a grassland and the atmosphere: An experimental study. Agricultural and Forest Meteorology, v.89, p.131-139, 1998. SELLERS, P.J.; DICKINSON R.E.; RANDALL, D.A.; BETTS, A.K.;
HALL, F.G.; BERRY, J.A.; COLLATZ, G.J.; DENNING, A.S.; MOONEY, H.A.; NOBRE, C.A.; SATO, N.; FIELD, C.B.; HENDERSON-SELLERS, A. Modeling the exchanges of energy, water, and carbon between continents and the atmosphere. Science, v.275, p.502-509, 1997.
SENTELHAS, P.C.; MARIN, F.R.; PEREIRA, A.R.; ANGELOCCI, L.R.; VILLA NOVA, N.A.; BARBIERI, V. Analise dos dados climáticos e
do balanço hídrico climatológico de Piracicaba. Piracicaba: ESALQ,
Depto. de Física e Meteorología. 1998. 81p.
TERAMOTO, E.R. Relações solo, substrato geológico e superfícies geomórficas na microbacia do Ribeirão dos Marins (Piracicaba, SP). Piracicaba: USP/ESALQ, 1995. 93p. (Dissertação - Mestrado) TURNER, D.P.; COHEN, W.B.; KENNEDY, R.E.; FASSNACHT, K.S.;
BRIGGS, J.M. Relationships between leaf area index and Landsat TM Spectral Vegetation Indices across three temperate zone sites. Remote
Sensing of Environment, v.70, p.52-68, 1999.
VAN DIJK, A.I.J.M.; BRUIJNZEEL, L.A. Modelling rainfall interception by vegetation of variable density using an adapted analytical model. Part 2. Model validation for a tropical upland mixed cropping system.
Journal of Hydrology, v.247, p.239-262, 2001.
WATSON, D.J. Comparative physiological studies on growth of field crops: I. Variation in net assimilation rate and leaf area between species and varieties, and within and between years. Annals of Botany, v.11, p.41-76, 1947.
WELLES, J.M. Some indirect methods of estimating canopy structure. In: GOEL, N.S.; NORMAN, J.M. Instrumentation for studying vegetation
canopies for remote sensing in optical and thermal infrared regions.
London: Harwood Academ Publishers, 1990. cap.5, p.31-43. WELLES, J.M.; NORMAN, J.M. Instrument for indirect measurement of
canopy architecture. Agronomy Journal, v.83, p.818-825, 1991. WIEGAND, C.L.; RICHARDSON, A.J. Use of spectral vegetation indices
to infer leaf area, evapotranspiration and yield: II. Results. Agronomy
Journal, v.82, p.630-636, 1990.
XAVIER, A.C.; SOARES, J.V.; ALMEIDA, A.C. Variação do índice de área foliar em clones de eucalipto ao longo de seu desenvolvimento.