Concordance of Epileptic Networks
Associated with Epileptic Spikes Measured by
High-Density EEG and Fast fMRI
Vera Jäger1, Matthias Dümpelmann2, Pierre LeVan3, Georgia Ramantani2, Irina Mader4, Andreas Schulze-Bonhage2, Julia Jacobs1*
1Department of Neuropediatrics and Muscular Diseases, University Medical Center Freiburg, Freiburg, Germany,2Section for Epileptology, University Medical Center Freiburg, Freiburg, Germany,3Medical Physics, University Medical Center Freiburg, Freiburg, Germany,4Department for Neuroradiology, University Medical Center Freiburg, Freiburg, Germany
Abstract
Objective
The present study aims to investigate whether a newly developed fast fMRI called MREG (magnetic resonance encephalography) measures metabolic changes related to interictal epileptic discharges (IED). For this purpose BOLD changes are correlated with the IED dis-tribution and variability.
Methods
Patients with focal epilepsy underwent EEG-MREG using a 64 channel cap. IED voltage maps were generated using 32 and 64 channels and compared regarding their correspon-dence to the BOLD response. The extents of IEDs (defined as number of channels with
>50% of maximum IED negativity) were correlated with the extents of positive and negative BOLD responses. Differences in inter-spike variability were investigated between interictal epileptic discharges (IED) sets with and without concordant positive or negative BOLD responses.
Results
17 patients showed 32 separate IED types. In 50% of IED types the BOLD changes could be confirmed by another independent imaging method. The IED extent significantly corre-lated with the positive BOLD extent (p = 0.04). In 6 patients the 64-channel EEG voltage maps better reflected the positive or negative BOLD response than the 32-channel EEG; in all others no difference was seen. Inter-spike variability was significantly lower in IED sets with than without concordant positive or negative BOLD responses (with p = 0.04).
OPEN ACCESS
Citation:Jäger V, Dümpelmann M, LeVan P, Ramantani G, Mader I, Schulze-Bonhage A, et al. (2015) Concordance of Epileptic Networks Associated with Epileptic Spikes Measured by High-Density EEG and Fast fMRI. PLoS ONE 10(10): e0140537. doi:10.1371/journal.pone.0140537
Editor:Dezhong Yao, University of Electronic Science and Technology of China, CHINA
Received:March 24, 2015
Accepted:September 28, 2015
Published:October 23, 2015
Copyright:© 2015 Jäger et al. This is an open access article distributed under the terms of the Creative Commons Attribution License, which permits unrestricted use, distribution, and reproduction in any medium, provided the original author and source are credited.
Data Availability Statement:Due to patent privacy, the data are ethically restricted and are available upon request. Requests for a de-identified, minimal data set can be made to Pierre LeVan (pierre. [email protected]). Tables and EEG files are available on Figshare:http://dx.doi.org/10.6084/ m9.figshare.1562359.
BrainLinks-Significance
Higher density EEG and fast fMRI seem to improve the value of EEG-fMRI in epilepsy. The correlation of positive BOLD and IED extent could suggest that widespread BOLD
responses reflect the IED network. Inter-spike variability influences the likelihood to find IED concordant positive or negative BOLD responses, which is why single IED analysis may be promising.
Introduction
Patients with focal refractory epilepsy profit from identifying brain regions which generate epi-leptic spikes and seizures. A better understanding of this epiepi-leptic focus and associated spike networks will allow to identify candidates for epilepsy surgery and other treatments such as intracranial stimulation [1,2]. For presurgical evaluation of patients with pharmaco-resistant epilepsy a variety of diagnostic imaging tools are available, but despite extensive investigations, it is not always possible to accurately identify epileptic structures [3,4]. EEG-fMRI is a recent, valuable method that combines the good temporal resolution of EEG and the good spatial reso-lution of fMRI. It defines the irritative zone by studying the brain’s hemodynamic changes related to IEDs [5,6]. In focal epilepsy it has already been shown that the BOLD response local-izes brain areas responsible for IEDs [7,8] and a good correlation between the BOLD response and the epileptic lesions could be seen [9,10]. Furthermore, the position of the positive BOLD response within the resected area was related to a good postoperative outcome [11]. EEG-fMRI resulted in additional clinical information in patients formerly rejected for epilepsy surgery [12,13]. Based on this new information some patients were surgically reevaluated and success-fully operated [12,13].
Nonetheless fMRI is still not widely used in clinical practice. Up to 30% of EEG-fMRI stud-ies are negative not showing any BOLD response [8]. Additionally BOLD responses are often hard to interpret and widespread or multifocal. While negative studies can be partly explained by a lack of epileptic spikes during the measurement or a bad signal-to-noise ratio, widespread BOLD responses are harder to interpret. Increased noise generated by technical artifacts, erro-neous hemodynamic response functions (HRF) or improper statistical methods are partly made responsible [14]. An often discussed issue in this context is the thresholding of fMRI data as it influences the sensitivity of the method. Given that IEDs tend to rapidly propagate, wide-spread BOLD responses are in addition often regarded as propagated activity. Studies using fMRI combined with continuous EEG source imaging and those investigating early BOLD responses support this hypothesis [15–17].
In recent years fast fMRI sequences have been developed. The thereby achieved high tempo-ral resolution increases signal to noise ratio and sensitivity of fMRI as well as the possibilities for investigating the time course of the BOLD response. In particular, a fast fMRI sequence called Magnetic Resonance Encephalography (MREG) [18,19] uses undersampled, single-shot k-space trajectories and a 32-channel receiver coil to acquire a 3D whole brain fMRI data with a temporal resolution of 100 ms and a spatial resolution of 4–5 mm. A former study could already demonstrate the higher sensitivity of MREG compared to the classical EPI method in patients with focal epilepsy [20]. IED related BOLD responses had higher t-values and better concordance with the EEG topography. Nevertheless some patients showed widespread BOLD responses, which were unclear in nature. The present study aims to improve understanding of the BOLD responses observed with MREG in patients with focal epilepsy. It first investigates BrainTools”(URL:http://www.dfg.de/foerderung/
programme/listen/projektdetails/index.jsp?id= 194657344). JJ was supported by grant JA 1725/2-1 of the German Research Foundation (URL:http:// www.dfg.de/). The funders had no role in study design, data collection and analysis, decision to publish, or preparation of the manuscript.
whether widespread and multifocal positive or negative BOLD responses might be partly the result of large inter-spike variability when averaging IEDs for the analysis and then correlates the EEG IED extent with the associated positive and negative BOLD extent. Lastly, it explores the influence of EEG resolution on the interpretation of the positive and negative BOLD responses. All analyses aim to test the hypothesis that widespread BOLD in MREG do not reflect artifacts or unspecific metabolic changes but highlight structures within the epileptic spike generating network.
Methods
Patients with focal epilepsy who stayed at the Epilepsy Centre Freiburg in the context of further diagnostic or treatment and met the following criteria were included in this study:
1. Minimum age of 6 years
2. >3 IEDs in 20 minutes on EEG outside the scanner
3. No contraindications for MRI scanning
Clinical data were collected from the patient records. All patients gave written informed consent. On behalf of the minors written informed consent was given from the guardians. The study was approved by the Research Ethics Committee of the University Medical Center Freiburg.
Data acquisition
EEG was continuously recorded inside the MRI scanner with an MR-compatible EEG-system (Brainproducts Co., Munich, Germany). 64 Ag/AgCl electrodes were placed on the patients head using an electrode cap (Easycap, Herrsching, Germany) with FCz as reference electrode. Electrode impedance was kept below 10 kO. Electrode cables and the patients head were immo-bilized with foam pads. Recording and storage of the EEG signal was carried out with the pro-gram `Brain Vision Recorder´ (Brainproducts Co., Munich, Germany). Data was transmitted via an optic fiber cable from an amplifier (5 kHz sampling rate, 0.016–250Hz band-pass filter) to a computer located outside the scanner room.
MREG recordings were continuously acquired during resting state using a 3 T (Tesla) scan-ner (Trio Tim, Siemens Healthcare, Erlangen, Germany). First an anatomical 3D, T1-weighted dataset (MPRAGE: TR = 2200ms, TE = 2.15ms, FOV = 256mm, 256×256 matrix, 160 sagittal slices, 1mm slice thickness) was performed for co-registration with functional images. MREG acquisitions were conducted for at least 20 minutes and up to 40 minutes, depending on patient compliance (TR = 100ms, TE = 20ms, FOV = 192mm, 64 × 64 × 64 matrix, flip angle = 15°, 12800 to 25600 volumes (time points), 32-channel head receiver coil). Electrocardiogram (ECG) and respiration were recorded simultaneously during the scan.
EEG processing
Processing of MREG Data
First the MREG images were reconstructed from the raw data of the multiple receiver coils [19]. The fMRI images were motion corrected (coregistration with the first volume using MCFLIRT) and smoothed (Gaussian kernel, FWHM = 6mm) using FSL software (FMRIB`s Software library) [24]. Statistical analysis using the general linear model was performed using the software fMRIstat [25]. Cardio-respiratory regressors, motion parameters and the scanner drift were included as confounds in the model. To account for the high temporal resolution of MREG a 5th-order autoregressive (AR) was used to model the noise term in the general linear model (GLM) [20]. To account for possibly different HRF delays, four different HRFs were used with peak times at 3, 5, 7 and 9 seconds after the event [26]. For each voxel the highest absolute t-value among those four was taken to generate a single combined map. Responses were rated as significant if at least 7 contiguous voxels were present with |t|>3.5 (p = 0.05,
cor-rected for multiple comparisons at the cluster level [25] and an additional Bonferroni correc-tion due to the 4 analyses).
Further analysis
For further EEG analysis the ASA software (ANT Software BV, Enschede, Netherlands) was used. Spike peak correction was performed to automatically move the manual markings to the time of highest negativity. All marked IEDs within one IED set were averaged and EEG voltage maps were generated using a common average montage.
Validation of MREG by other established imaging methods. For validation of MREG an experienced neuro-radiologist (IM) visually compared the detected positive or negative BOLD responses to structural lesions in magnetic resonance (MRI) and statistically significant meta-bolic areas in positron emission tomography (PET) and single photon emission computed tomography (SPECT).
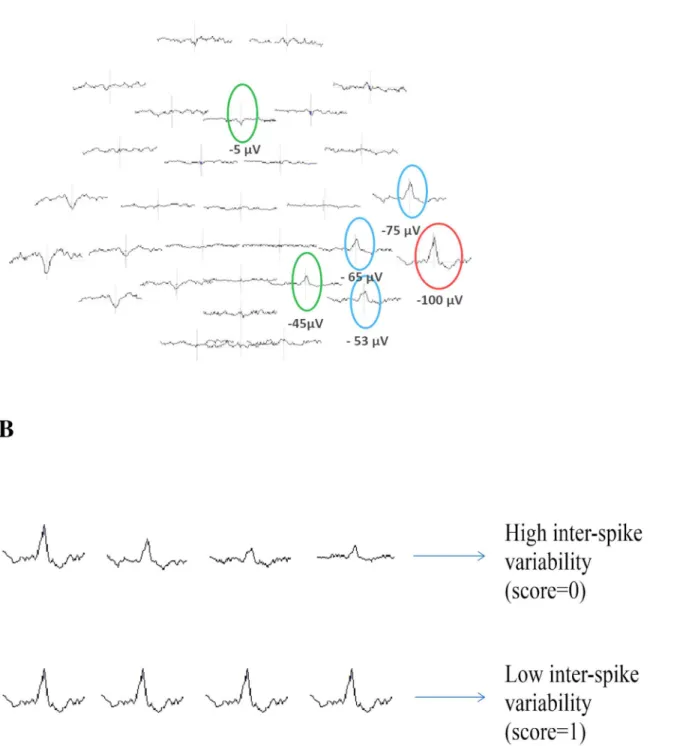
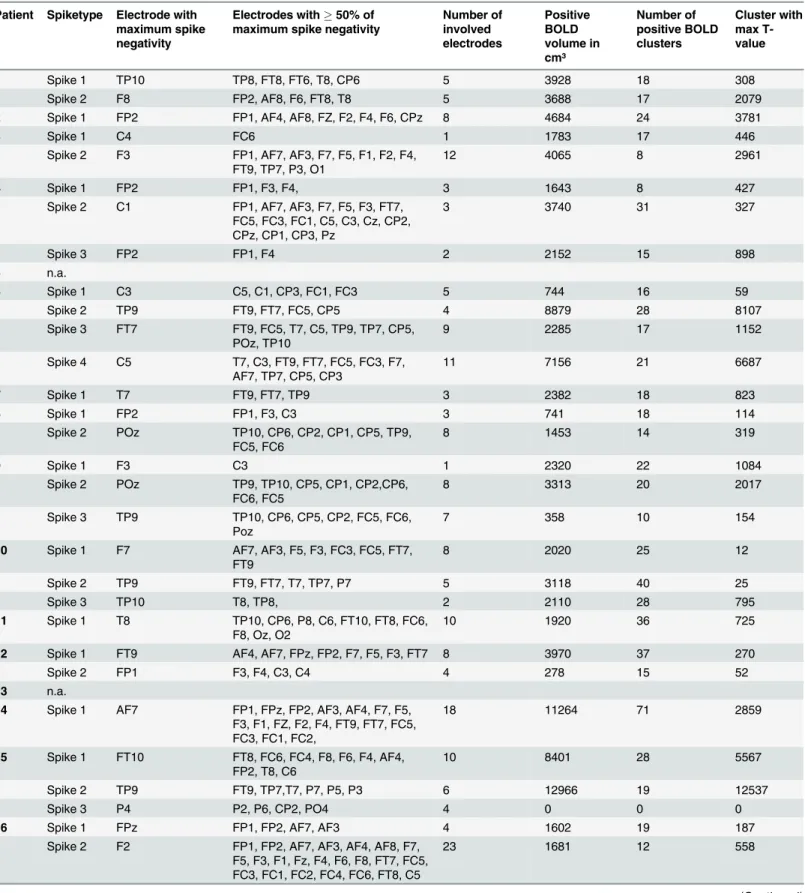
Correlation between IED and BOLD extent. IED extent was measured in the 64-channel EEG voltage map by identifying the electrode with the highest negativity (inμV) and all other electrodes which showed at least 50% of this negativity (Fig 1). The included electrodes were counted and the resulting number taken as IED extent. The total extent of BOLD volume mea-sured as the entire region of activated voxels in cm³ as well as the total number of BOLD clus-ters was determined using MREG data and then both separately correlated with the IED extent using a Spearman Correlation (Table 1). This was performed for positive and negative BOLD responses separately.
Influence of inter-spike variability on BOLD response. Rather than averaged IEDs, every single spike of one IED set was considered here. The IED variability across spikes was quantified by correlating the individual spatial topographies (using the 64-channel EEG) of each IED with the previously generated average spatial topography across all IEDs of a given set. Coefficient of correlation was computed with MATLAB. The mean correlation across all IEDs was then used as a measure of variability. The higher the mean correlation the more simi-lar are the single spikes of one IED set. A value of 1 would therefore indicate that all individual maps are identical and correlate perfectly with the average map, while a lower score indicates a higher variability across maps (Fig 1). It was then investigated whether there was a difference in this variability score between IED sets with concordant positive or negative BOLD
responses, and IED sets without concordant positive or negative BOLD responses. Both groups were compared with a t-test (level of significanceα<0.05).
Fig 1. Exemplary illustration of the used methods.(A) Determination of IED extent. The red circle indicates the IED with the highest negativity, the blue circle indicates IEDs with at least 50% of this negativity and the green circle indicates IEDs that did not meet the inclusion criteria. (B) Representation of possible inter-spike variability within one IED set.
Table 1. IED and BOLD extent.
Patient Spiketype Electrode with maximum spike negativity
Electrodes with50% of maximum spike negativity
Number of involved electrodes Positive BOLD volume in cm³ Number of positive BOLD clusters Cluster with max T-value
1 Spike 1 TP10 TP8, FT8, FT6, T8, CP6 5 3928 18 308
Spike 2 F8 FP2, AF8, F6, FT8, T8 5 3688 17 2079
2 Spike 1 FP2 FP1, AF4, AF8, FZ, F2, F4, F6, CPz 8 4684 24 3781
3 Spike 1 C4 FC6 1 1783 17 446
Spike 2 F3 FP1, AF7, AF3, F7, F5, F1, F2, F4, FT9, TP7, P3, O1
12 4065 8 2961
4 Spike 1 FP2 FP1, F3, F4, 3 1643 8 427
Spike 2 C1 FP1, AF7, AF3, F7, F5, F3, FT7, FC5, FC3, FC1, C5, C3, Cz, CP2, CPz, CP1, CP3, Pz
3 3740 31 327
Spike 3 FP2 FP1, F4 2 2152 15 898
5 n.a.
6 Spike 1 C3 C5, C1, CP3, FC1, FC3 5 744 16 59
Spike 2 TP9 FT9, FT7, FC5, CP5 4 8879 28 8107
Spike 3 FT7 FT9, FC5, T7, C5, TP9, TP7, CP5, POz, TP10
9 2285 17 1152
Spike 4 C5 T7, C3, FT9, FT7, FC5, FC3, F7, AF7, TP7, CP5, CP3
11 7156 21 6687
7 Spike 1 T7 FT9, FT7, TP9 3 2382 18 823
8 Spike 1 FP2 FP1, F3, C3 3 741 18 114
Spike 2 POz TP10, CP6, CP2, CP1, CP5, TP9, FC5, FC6
8 1453 14 319
9 Spike 1 F3 C3 1 2320 22 1084
Spike 2 POz TP9, TP10, CP5, CP1, CP2,CP6, FC6, FC5
8 3313 20 2017
Spike 3 TP9 TP10, CP6, CP5, CP2, FC5, FC6, Poz
7 358 10 154
10 Spike 1 F7 AF7, AF3, F5, F3, FC3, FC5, FT7, FT9
8 2020 25 12
Spike 2 TP9 FT9, FT7, T7, TP7, P7 5 3118 40 25
Spike 3 TP10 T8, TP8, 2 2110 28 795
11 Spike 1 T8 TP10, CP6, P8, C6, FT10, FT8, FC6, F8, Oz, O2
10 1920 36 725
12 Spike 1 FT9 AF4, AF7, FPz, FP2, F7, F5, F3, FT7 8 3970 37 270
Spike 2 FP1 F3, F4, C3, C4 4 278 15 52
13 n.a.
14 Spike 1 AF7 FP1, FPz, FP2, AF3, AF4, F7, F5, F3, F1, FZ, F2, F4, FT9, FT7, FC5, FC3, FC1, FC2,
18 11264 71 2859
15 Spike 1 FT10 FT8, FC6, FC4, F8, F6, F4, AF4, FP2, T8, C6
10 8401 28 5567
Spike 2 TP9 FT9, TP7,T7, P7, P5, P3 6 12966 19 12537
Spike 3 P4 P2, P6, CP2, PO4 4 0 0 0
16 Spike 1 FPz FP1, FP2, AF7, AF3 4 1602 19 187
Spike 2 F2 FP1, FP2, AF7, AF3, AF4, AF8, F7, F5, F3, F1, Fz, F4, F6, F8, FT7, FC5, FC3, FC1, FC2, FC4, FC6, FT8, C5
23 1681 12 558
as a conventional 32-channel electrode subset (Fig 2). Included electrodes in the 32-channel EEG were Fp1, Fp2, Fz, F3, F4, F7, F8, FC1, FC2, FC5, FC6, Cz, C3, C4, T7, T8, CP1, CP2, CP5, CP6, TP 9, TP 10, Pz, P3, P4, P7, P8, POz, Oz, O1, O2. Additionally included in the 64-channel EEG were the electrodes FPz, AF3, AF4, AF7, AF8, F1, F2, F5, F6, FC3, FC4, FT7, FT8, FT9, FT10, C1, C2, C5, C6, CPz, CP3, CP4, TP7, TP8, P1, P2, P5, P6, PO3, PO4, PO7, PO8. For each IED set, both voltage maps were visually compared to evaluate which one better repre-sents the irritative zone as well as which one better reflects the area of the positive or negative BOLD response using the following criteria:
- Between both montages the noise level was compared. Data was considered as noisy if more than 10% of EEG channels showed artifacts or unidentifiable wave forms at the time of the IED, or if EEG and dipole maps were unable to identify one clear dipole
- The electrode with the highest negativity was classified as IED origin. Positive or negative BOLD responses were rated as concordant when this highest negativity and the highest BOLD were located in the same brain lobe
- The extent and location of EEG IED spread, namely those channels in which a negative peak was visible at the time of the IEDs, were visually compared with the positive or nega-tive BOLD extent and location
Results
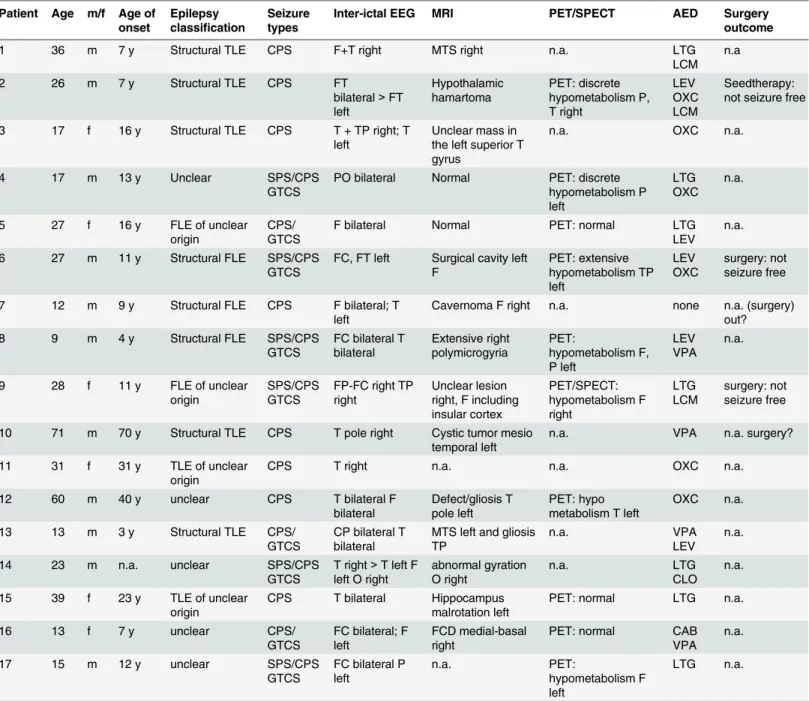
17 patients could be included in the study. Patient age was between 9 and 71 years (mean age: 27.3years). All clinical information on patients is summarized inTable 2. 15 patients showed IEDs and 32 IED sets were identified. Patient 5 and patient 13 did not show any IEDs during MREG. In all 32 IED sets, positive as well as negative BOLD responses could be identified.
Validation of MREG by other established imaging methods
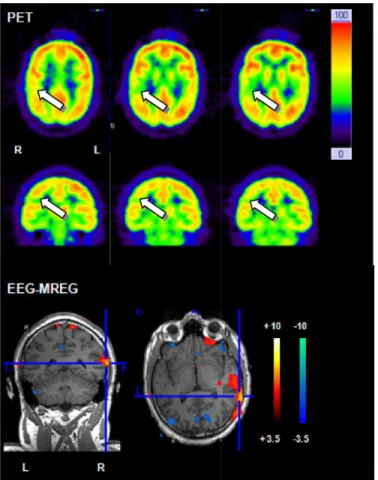
In 12 (24 IED sets) patients a clear lesion in the MRI could be found. FDG-PET studies were conducted in 9 patients but visual assessment of FDG PET identified regions of focal hypome-tabolism in only 7 patients. Ictal SPECT was conducted in one patient and a region of focal hyperperfusion could be identified. Topographic correlation between positive BOLD response and MRI lesion was found in 10 /12 patients. Positive BOLD responses were concordant with PET results in 5/7 patients and with ictal SPECT results in 1 patient. One example with concor-dant positive BOLD responses and PET results is displayed inFig 3.
Table 1. (Continued)
Patient Spiketype Electrode with maximum spike negativity
Electrodes with50% of maximum spike negativity
Number of involved electrodes
Positive BOLD volume in cm³
Number of positive BOLD clusters
Cluster with max T-value
17 Spike 1 F5 FP1, FP2, AF7, AF3, AF4, F3, F1, F2, FC5, FC3, FC1, C3, Cz, CP3
14 2883 16 1554
Spike 2 FT9 FP1, FPz, FP2, AF7, AF3, F7, F3, FT7
8 3825 24 1378
AF, anteriofrontal; C, central; CP, centroparietal; F, frontal; FC, frontocentral; FP, frontoparietal; FT, frontotemporal; n.a., not available; O, occipital; P, parietal; PO, parietooccipital; T, temporal; TP, temporoparietal; z, central
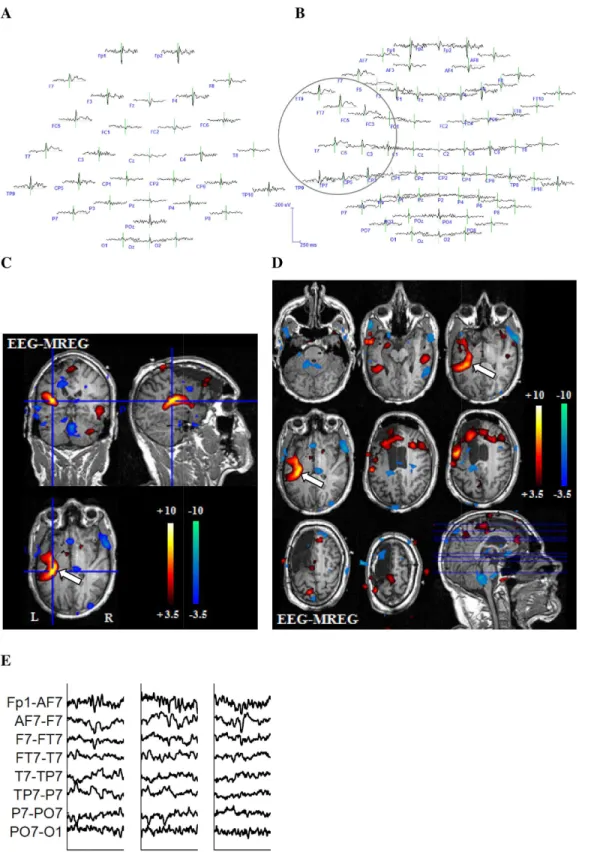
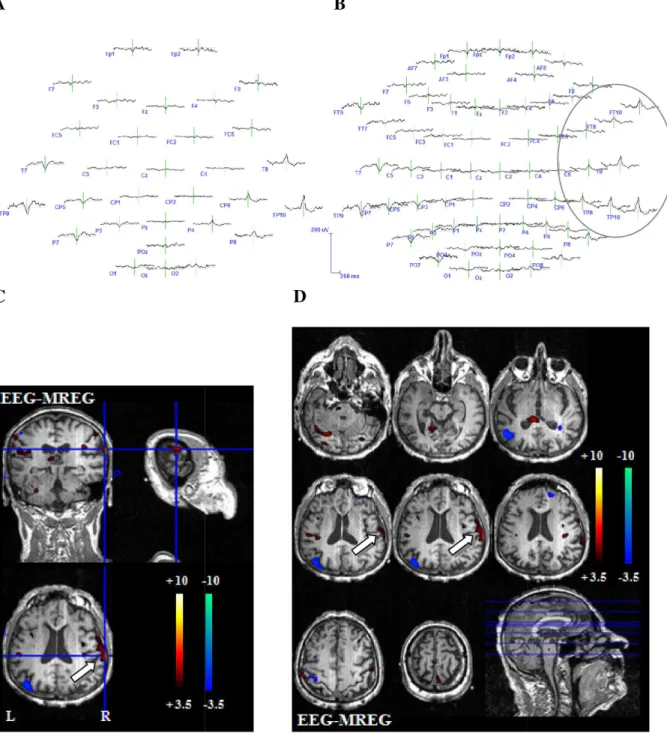
Fig 2. Example 1 for better representation of the BOLD-topography with 64 electrodes.27-year-old patient (patient 6, study 3) with left structural frontal lobe epilepsy. The patient underwent a previous operation with frontal resection, which showed a FCD type 2a. No seizure freedom could be achieved through operation. This is a typical example for the superiority of the 64-channel-EEG. The 32-channel EEG reveals a left temporoparietal IED area (A). The 64-channel EEG shows that left frontotemporal regions are as well included in the IED area (B.) The extensive positive BOLD response on the left hand side exactly reflects the IED distribution from temporoparietal to frontotemporal as shown in the 64-channel EEG. The white arrow indicates the relevant positive BOLD response (CandD). (E) shows different IEDs of one IED set.
Correlation between IED extent on scalp EEG and BOLD extent
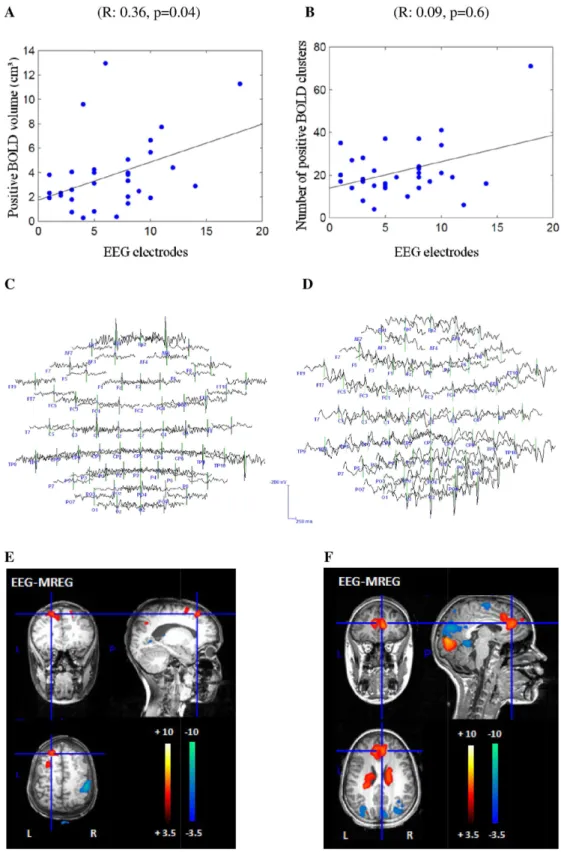
The more widespread the IED area the more voxels were covered by positive BOLD (R: 0.36, p = 0.04) (Fig 4). No correlation was found between the IED extent the number of positive BOLD clusters (R: 0.09, p = 0.6) and the volume (R: 0.28, p = 0.1) or the number of negative BOLD clusters (R: 0.05, p = 0.8). Results are listed in detail inTable 1. We also computed the Table 2. Clinical information.
Patient Age m/f Age of onset
Epilepsy classification
Seizure types
Inter-ictal EEG MRI PET/SPECT AED Surgery
outcome
1 36 m 7 y Structural TLE CPS F+T right MTS right n.a. LTG
LCM n.a
2 26 m 7 y Structural TLE CPS FT
bilateral>FT left Hypothalamic hamartoma PET: discrete hypometabolism P, T right LEV OXC LCM Seedtherapy: not seizure free
3 17 f 16 y Structural TLE CPS T + TP right; T left
Unclear mass in the left superior T gyrus
n.a. OXC n.a.
4 17 m 13 y Unclear SPS/CPS
GTCS
PO bilateral Normal PET: discrete hypometabolism P left
LTG OXC
n.a.
5 27 f 16 y FLE of unclear
origin
CPS/ GTCS
F bilateral Normal PET: normal LTG
LEV n.a.
6 27 m 11 y Structural FLE SPS/CPS
GTCS
FC, FT left Surgical cavity left F PET: extensive hypometabolism TP left LEV OXC surgery: not seizure free
7 12 m 9 y Structural FLE CPS F bilateral; T left
Cavernoma F right n.a. none n.a. (surgery) out?
8 9 m 4 y Structural FLE SPS/CPS
GTCS
FC bilateral T bilateral Extensive right polymicrogyria PET: hypometabolism F, P left LEV VPA n.a.
9 28 f 11 y FLE of unclear
origin
SPS/CPS GTCS
FP-FC right TP right
Unclear lesion right, F including insular cortex PET/SPECT: hypometabolism F right LTG LCM surgery: not seizure free
10 71 m 70 y Structural TLE CPS T pole right Cystic tumor mesio temporal left
n.a. VPA n.a. surgery?
11 31 f 31 y TLE of unclear origin
CPS T right n.a. n.a. OXC n.a.
12 60 m 40 y unclear CPS T bilateral F
bilateral
Defect/gliosis T pole left
PET: hypo metabolism T left
OXC n.a.
13 13 m 3 y Structural TLE CPS/
GTCS
CP bilateral T bilateral
MTS left and gliosis TP
n.a. VPA
LEV n.a.
14 23 m n.a. unclear SPS/CPS
GTCS
T right>T left F left O right
abnormal gyration O right
n.a. LTG
CLO n.a.
15 39 f 23 y TLE of unclear origin
CPS T bilateral Hippocampus malrotation left
PET: normal LTG n.a.
16 13 f 7 y unclear CPS/
GTCS
FC bilateral; F left
FCD medial-basal right
PET: normal CAB
VPA n.a.
17 15 m 12 y unclear SPS/CPS
GTCS
FC bilateral P left
n.a. PET:
hypometabolism F left
LTG n.a.
AED, anti epileptic drug; C, central; CAB, carbamazepine; CLO, clobazam; CPS, complex partial seizure; f, female; F, frontal; FC, frontocentral; FLE, frontal lobe epilepsy; FP, frontopolar; FT, frontotemporal;GTCS, generalized tonic clonic seizure; LCM, lacosamide; LEV, levetiracetam; LTG, lamotrigine; m, male; MTS, mesial temporal sclerosis; n.a., not available; O, occipital; OXC, oxcarbazepine; P, parietal; SPS, simple partial seizure; T, temporal; TLE, temporal lobe epilepsy; TP, temporoparietal; VPA, valproate acid; y, year
correlation between the IED extent and the volume of the cluster with peak T-value [27,28]. No significant correlation was found with the cluster volume with peak negative T-value (R: 0.29, p = 0.1), although a trend could be detected with the cluster volume with peak positive T-value (R: 0.34, p = 0.06).
Influence of IED variability on BOLD concordance
Overall the coefficients of correlation of variability varied between 0.12 and 1. For the 25 IED sets with concordant positive or negative BOLD responses, variability between the single spikes within one IED set showed a mean value of 0.71 (SD: +/-0.27). Variability of the 7 IED sets without a concordant positive or negative BOLD response showed a mean value of 0.48 (SD: +/-0.16). Inter-spike variability was significantly higher for IED sets without than with concor-dant BOLD responses (p = 0.04). An example for different spikes of one IED set is shown in
Fig 2.
Comparison 32/64-channel EEG
For the 64-channel EEG, correlation between positive BOLD response and IED topography could be found in 19 IED sets and a correlation with a negative BOLD response in 7 IED sets. For the 32-channel EEG, correlation between positive BOLD response and IED topography Fig 3. Example for correlation between PET and positive BOLD response.26 year old patient (patient 2) with structural epilepsy. PET shows a discrete temporal and parietal hypometabolism. The strongest positive BOLD response in MREG is located temporal on the right hand side and therefore shows a good correlation with PET.
Fig 4. Representation of the positive correlation between IED and BOLD extent.The x-axis shows the in the IED extent included number of electrodes. The y-axis once shows the volume of positive BOLD
could be found in 18 IED sets and a correlation with a negative BOLD response in 7 IED sets. In 16 IED sets visual localization was better in the 64- than the 32-channel EEG. In all remain-ing IED sets no difference between the two EEG montages could be found. Reason for the supe-riority of the 64-channel EEG was the location or spread of IEDs in temporal brain areas which are not well covered by the 32-channel EEG, or whenever IEDs had their highest negativity over electrodes not represented in the 32-channel EEG. In a few cases a larger number of elec-trodes lead to more noise in terms of unclear, widespread and multifocal dipoles within the dipole maps and an impeded identification of the IED area. Out of the 16 IED sets profiting from high resolution EEG, in four improved concordance with the strongest positive and in 2 with the negative BOLD change (examples Figs2and5) were observed. Only in one IED set the 32-channel EEG better reflected the negative BOLD response. Reason for the superiority of the 64-channel EEG was at all times the location or spread of the BOLD response in temporal brain areas. All results are depicted in detail inTable 3. BOLD-topographies of all patients can be found in the supporting information (S1–S4Figs).
Discussion
In all patients and IED sets positive as well as negative BOLD responses were found with MREG. This study therefore could confirm the high sensitivity of MREG for the occurrence of BOLD responses, as has already been shown previously [20]. However, as MREG is a newly developed method, the observed BOLD needs further verification, which we could provide in this study by demonstrating a correlation between extent of scalp IEDs and positive BOLD responses. Moreover higher density EEG suggested a clearer correlation between EEG IED voltage maps and areas showing increased BOLD. Last but not least evidence suggests that large spike variability of IEDs generated over the same brain area might be an important reason for discordant BOLD effects.
Correlation between BOLD response and other diagnostic measures
In 83% of the patients (10/12 patients) a correlation between the lesion found in MRI and the positive BOLD response existed. Other studies showed similar results, with 61.5–85% [9,10]. We could achieve such a high correlation even though our patient collective was very heteroge-neous in comparison to the other studies. We included all patients with focal epilepsy regard-less of their underlying pathology, among them many patients with epilepsy of unknown etiology or lesions with unclear epileptogenicity. For the latter we would not necessarily expect a correlation between positive BOLD and lesion. Correlation between PET and positive BOLD was found in 71% of the patients (5/7 patients). This is consistent with other studies with sensi-tivities of 73%-100% [12,29,30]. The two patients in our study without concordance of any IED type and PET were as well the only ones with normal MRI. Overall, in 10 patients the positive BOLD response could be confirmed by at least one other diagnostic in addition to EEG. The comparison between EEG-MREG and other methods therefore supports the hypothesis that positive BOLD responses in fact represent the irritative zone and epileptogenic areas just as the other methods do.
(F). However, the BOLD response located at the front is concordant to the most negative IED area over F2 and the MRI results.
Correlation between IED and BOLD extent
Our study statistically revealed a direct connection between the extent of the IED as calculated from the scalp EEG and positive BOLD extent. Focal IEDs correlated with focal positive BOLD responses while widespread IEDs correlated with widespread positive BOLD responses. Two Fig 5. Example 2 for better representation of the BOLD-topography with 64 electrodes.71-year-old patient (patient 10, study 3) with structural temporal lobe epilepsy. Another example for the predominance of the 64-channel-EEG. The 32-channel EEG reveals a temporoparietal IED area (A). The 64-channel EEG shows that the IED area as well spreads into frontotemporal regions (B). The positive BOLD response on the right hand side represents the IED distribution from temporoparietal to frontal regions as shown in the 64-channel EEG. The white arrow indicates the relevant positive BOLD response (Cand
D).
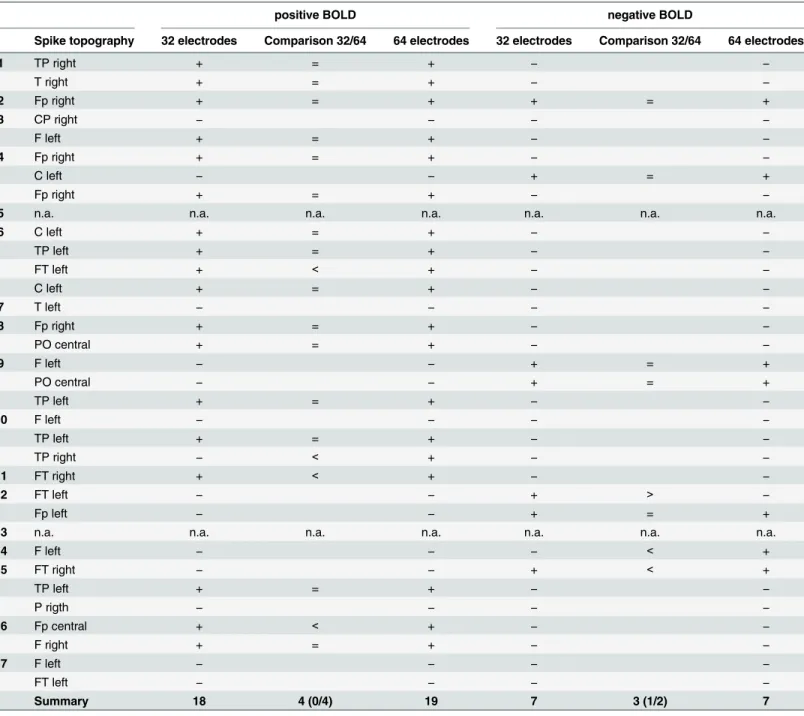
other recently published studies came to the same conclusion, one by only visually estimating this connection without calculating it [31] and the other one by comparing the measured BOLD volume related to focal spikes with widespread bilateral synchronous discharges in fron-tal lobe epilepsy [32]. This finding could suggest that widespread positive BOLD responses are not simply artifact or unspecific reactions, but probably correctly reflect the broad network of Table 3. Detailed representation of BOLD effects and comparison between 32/64 channel EEG.
positive BOLD negative BOLD
Spike topography 32 electrodes Comparison 32/64 64 electrodes 32 electrodes Comparison 32/64 64 electrodes
1 TP right + = + − −
T right + = + − −
2 Fp right + = + + = +
3 CP right − − − −
F left + = + − −
4 Fp right + = + − −
C left − − + = +
Fp right + = + − −
5 n.a. n.a. n.a. n.a. n.a. n.a. n.a.
6 C left + = + − −
TP left + = + − −
FT left + < + − −
C left + = + − −
7 T left − − − −
8 Fp right + = + − −
PO central + = + − −
9 F left − − + = +
PO central − − + = +
TP left + = + − −
10 F left − − − −
TP left + = + − −
TP right − < + − −
11 FT right + < +
− −
12 FT left − − + > −
Fp left − − + = +
13 n.a. n.a. n.a. n.a. n.a. n.a. n.a.
14 F left − − − < +
15 FT right − − + < +
TP left + = + − −
P rigth − − − −
16 Fp central + < +
− −
F right + = + − −
17 F left − − − −
FT left − − − −
Summary 18 4 (0/4) 19 7 3 (1/2) 7
C, central; CP, centroparietal; F, frontal; FC, frontocentral; FP, frontoparietal; FT, frontotemporal; n.a., not available; P, parietal; PO, parietooccipital; T, temporal; TP, temporoparietal; +, concordance between BOLD and spike topography; -, no concordance between BOLD and spike topography;<,
predominance of the 64-channel-EEG;>, predominance of the 32-channel EEG; = or freefield, there was no difference between the 32- and the
64-channel map.
propagating IEDs. Studies with continuous EEG source localization have been able to support this assumption [15,16]. By gaining information regarding the time course of the IEDs, differ-ent BOLD responses could be related to differdiffer-ent parts of the IED network and maybe even areas of seizure onset or propagation.
This information is increasingly relevant for fast fMRI sequences like MREG, for two rea-sons. First, increased sensitivity of the sequence might lead to more extensive BOLD responses that require interpretation, second, the high temporal resolution might provide the possibility to analyze time courses of widespread BOLD changes. The first consideration is supported by Gonzalez and colleagues [33] who indicated that BOLD responses to a presumably focal task might actually be present in the entire brain, and may be detected given a sufficiently sensitive acquisition whereby it becomes increasingly unclear which brain areas are important. It also poses the question whether thresholds defined and validated for classical fMRI apply for MREG as well or if they reveal too many unspecific BOLD responses. It nevertheless appears that the often widespread positive BOLD regions observed with MREG seem to represent epi-leptic networks. Whether they are clinically relevant for diagnostic purposes will have to be fur-ther evaluated in studies involving the postsurgical outcome or results of intracranial EEGs, as already performed for classical fMRI [12,34]. MREG as well provides the possibility to investi-gate the temporal development of the BOLD response. With its high temporal resolution, it becomes possible to track the precise onset of the BOLD response for each individual IED. A detailed analysis and interpretation of this time course of the BOLD response could allow a dif-ferentiation between IED generation and propagation. It will however be necessary to develop new analysis methods to really profit from the newly gained temporal resolution. Until then analyzing the BOLD with the highest t-value can be used to find a focal source, as was done for clinical correlations in the present study.
Spike variability
even more detailed picture of the different brain regions involved in the irritative zone with an emphasis on reproducible activation patterns.
Comparison 32/64-channel EEG
In 50% of the IED sets the 64-channel EEG outperformed the 32-channel EEG. This is in agree-ment with previous studies [41,42] that have proven the advantage of high density EEG in spike source localization. In 37% of the cases in which the 64-channel EEG improved interpre-tation of the IED localization it also outperformed the 32-channel EEG in reflecting the area of positive or negative BOLD response. One main reason for the superiority of the 64-channel EEG were IEDs originating in temporal regions, which are not well covered by the 32-channel EEG. Other studies could show that in patients with temporal lobe epilepsy a large number of spikes will be missed whenever EEGs with a low number of electrodes are used [43]. Further-more it could lead to a shift of the spikefield to Further-more dorsal regions if the inferior chain of elec-trodes is missing [44]. Therefore a high density EEG should be chosen especially for patients with suspected temporal lobe epilepsy, or at least the additional temporal electrodes should be added to the classical 10–20 electrode arrangement. Another reason for the superiority of the 64-channel EEG in better depicting the irritative zone was whenever IEDs had their highest negativity over electrodes not represented in the 32-channel EEG. However this never led to a better reflection of the positive or negative BOLD response as the IED area normally involved more than one electrode and therefore only changed marginally. This result also reflects the fact that most of the time positive or negative BOLD responses in our study were not very focal. When comparing EEG and BOLD response a high spatial resolution in areas already cov-ered by electrodes therefore seems less profitable. Nevertheless in EEG-fMRI a high spatial res-olution becomes important when using detailed source localization methods whose results can then be compared with the location of the strongest BOLD [34,45]. However, a larger number of electrodes can also lead to more noise [41]. This could be observed in our study in a few cases as well. The irritative zone then seemed to be more widespread and its localization was impeded. But overall a clear superiority of the 64-channel EEG was evident.
A correlation between BOLD responses and EEG revealed a sensitivity of 81.2% (26/32 IED sets) with 19 IED sets showing a positive and 7 a negative BOLD response in the area of IED onset. The sensitivity is similar to former EEG-fMRI and MREG studies [7,8,13,20]. Even if some correlation between spike localization and negative BOLD was found, the predominant correlation was found with positive BOLD responses. A large majority of negative BOLD responses were found in distant areas, some of them showing large overlap with the default mode regions [46]. This has been previously described for EEG-fMRI in epilepsy and is increasingly found when using MREG [20]. Therefore it is likely that not all negative BOLD is directly representing the irritative zone, some of it however might be relevant as some studies on the time course of the hemodynamic response demonstrated that some negative responses after the spikes are preceded by positive responses prior to the spike in the same brain region [17]. Additionally, BOLD changes in white matter and CSF are generally attributed to physio-logical noise, which greatly affects fMRI data. Fast acquisitions such as MREG may however allow the development of new methods for physiological noise correction, which may alleviate this problem in the future.
Methodological limitations
and the relationship of IED extents seen in EEG and fMRI are therefore made in relation to fast fMRI, but could very well apply to conventional fMRI as well.
It still remains open which HRF to use for EEG-fMRI analysis. There is evidence that HRFs not always follow the same time series and that differences exist between patients, age or brain areas [47,48]. HRFs following focal epileptic spikes may differ from the standard HRF, a canonical HRF which follows short auditory stimuli [49]. This variability of HRFs in epilepsy patients could also be shown by other studies [50,51]. For statistical analysis we therefore used multiple HRFs as it has been shown that this can increase the sensitivity of EEG-fMRI in epi-lepsy [26]. Thereby even BOLD responses can be detected that strongly differ from the stan-dard canonical HRF [49]. A recently published study using MREG defined a subject-specific HRF model which improved model accuracy and led to increased t-values and a larger size of activation foci [52].
MREG with its high temporal resolution and increased sensitivity may also be more vulner-able to false positive activations originating from noise. The 1st-order autoregressive model normally used in EPI resulted in false activations including all brain areas [20]. A 5th-order autoregressive model was therefore selected. The determination of the most suitable model however is still a part of research [53].
Conclusion
EEG-MREG proved to be a valuable and sensitive tool for diagnostics in epilepsy and might be able to identify network structures of IEDs. While EEG alone can only show widespread IED activity, EEG-MREG opens the opportunity to have better localization of epileptic activity even in deep brain structures. Brain regions with the strongest positive BOLD effect show a good correlation with the IED focus, lesion and results from other neuroimaging methods. High inter-spike variability seems to impede good correlations between positive or negative BOLD and IED topography. To avoid this phenomenon in the future averaged IED analysis might be replaced by single IED analysis possible due to the increased sensitivity of MREG. In the next step MREG results should be evaluated in the context of intracranial EEG recordings and post-surgical outcome for further validation.
Supporting Information
S1 Fig. BOLD-topographies of patient number 1 to patient number 6 Spike 1. (TIF)
S2 Fig. BOLD-topographies of patient number 6 spike 2 to patient number 10. (TIF)
S3 Fig. BOLD-topographies of patient number 11 to patient number 17 spike 1. (TIF)
S4 Fig. BOLD-topography of patient number 17 spike 2. (TIF)
Author Contributions
References
1. Rosenow F, Lüders H. Presurgical evaluation of epilepsy. Brain 2001; 124:1683–1700. PMID: 11522572
2. Lüders HO, Najm I, Nair D, Widdess-Walsh P, Bingman W. The epileptogenic zone: general principles. Epileptic Disord. 2006; 8 (Suppl. 2):1–9.
3. Kral T, Clusmann H, Urbach J, Schramm, Elger CE, Kurthen M, Grunwald T. Preoperative evaluation for epilepsy surgery (Bonn Algorithm). Zentralbl Neurochir. 2002; 63:106–110. PMID:12457335
4. Schulze-Bonhage A, Zentner J. The preoperative evaluation and surgical treatment of epilepsy. Dtsch Arztebl Int. 2014; 111:313–319. doi:10.3238/arztebl.2014.0313PMID:24861650
5. Kobayashi E, Bagshaw AP, Bénar CG, Aghakhani Y, Andermann F, Dubeau F, et al. Temporal and extratemporal BOLD responses to temporal lobe interictal spikes. Epilepsia 2006; 47:343–354. PMID: 16499759
6. Krakow K, Woermann FG, Symms MR, Allen PJ, Lemieux L, Barker GJ, et al. EEG-triggered functional MRI of interictal epileptiform activity in patients with partial seizures. Brain 1999; 122: 1679–1688. PMID:10468507
7. Al-Asmi A, Bénar CG, Gross DW, Khani YA, Andermann F, Pike B, et al. fMRI activation in continuous and spike-triggered EEG-fMRI studies of epileptic spikes. Epilepsia 2003; 44:1328–1339. PMID: 14510827
8. Salek-Haddadi A, Diehl B, Hamandi K, Merschhemke M, Liston A, Friston K, et al. Hemodynamic corre-lates of epileptiform discharges: an EEG-fMRI study of 63 patients with focal epilepsy. Brain Res. 2006; 1088:148–166. PMID:16678803
9. Kobayashi E, Bagshaw AP, Jansen A, Andermann F, Andermann E, Gotman J, et al. Intrinsic epilepto-genicity in polymicrogyric cortex suggested by EEG-fMRI BOLD responses. Neurology 2005; 64:1263–
1266. PMID:15824359
10. Tyvaert L, Hawco C, Kobayashi E, LeVan P, Dubeau F, Gotman J. Different structures involved during ictal and interictal epileptic activity in malformations of cortical development: an EEG-fMRI study. Brain 2008; 131:2042–2060. doi:10.1093/brain/awn145PMID:18669486
11. Thornton R, Laufs H, Rodionov R, Cannadathu S, Carmichael DW, Vulliemoz S, et al. EEG correlated functional MRI and postoperative outcome in focal epilepsy. J Neurol Neurosurg Psychiatry 2010; 81:922–927. doi:10.1136/jnnp.2009.196253PMID:20547617
12. Moeller F, Tyvaert L, Nguyen DK, LeVan P, Bouthillier A, Kobayashi E, et al. EEG-fMRI: adding to stan-dard evaluations of patients with nonlesional frontal lobe epilepsy. Neurology 2009; 73:2023–2030. doi: 10.1212/WNL.0b013e3181c55d17PMID:19996077
13. Zijlmans M, Huiskamp G. EEG-fMRI in the preoperative work-up for epilepsy surgery. Brain 2007; 130:2343–2353. PMID:17586868
14. Gotman J. Epileptic networks studied with EEG-fMRI. Epilepsia 2008; 49 (Suppl. 3):42–51. doi:10. 1111/j.1528-1167.2008.01509.xPMID:18304255
15. Vulliemoz S, Rodionov R, Carmichael DW, Thornton R, Guye M, Lhatoo SD, et al. Continuous EEG source imaging enhances analysis of EEG-fMRI in focal epilepsy. NeuroImage 2010a; 49:3219–3229. doi:10.1016/j.neuroimage.2009.11.055PMID:19948231
16. Vulliemoz S, Lemieux L, Daunizeau J, Michel CM, Duncan JS. The combination of EEG source imaging and EEG-correlated functional MRI to map epileptic networks. Epilepsia 2010b; 51;491–505.
17. Jacobs J, Levan P, Moeller F, Boor R, Stephani U, Gotman J, et al. Hemodynamic changes preceding the interictal EEG spike in patients with focal epilepsy investigated using simultaneous EEG-fMRI. Neu-roImage 2009; 45:1220–1231. doi:10.1016/j.neuroimage.2009.01.014PMID:19349236
18. Zahneisen B, Hugger T, Lee KJ, LeVan P, Reisert M, Lee HL, et al. Single shot concentric shells trajec-tories for ultra fast fMRI. Magn Reson Med. 2012; 68:484–494. doi:10.1002/mrm.23256PMID: 22131236
19. Assländer J, Zahneisen B, Hugger T, Reisert M, Lee HL, LeVan P, et al. Single shot whole brain imag-ing usimag-ing spherical stack of spirals trajectories. NeuroImage 2013; 73:59–70. doi:10.1016/j.
neuroimage.2013.01.065PMID:23384526
20. Jacobs J, Stich J, Zahneisen B, Assländer J, Ramantani G, Schulze-Bonhage A, et al. Fast fMRI pro-vides high statistical power in the analysis of epileptic networks. NeuroImage 2014; 88:282–294. doi: 10.1016/j.neuroimage.2013.10.018PMID:24140936
21. Allen PJ, Josephs O, Turner R. A method for removing imaging artifact from continuous EEG recorded during functional MRI. NeuroImage 2000; 12:230–239. PMID:10913328
23. Srivastava G, Crottaz-Herbette S, Lau KM, Glover GH, Menon V, et al. ICA-based procedures for removing ballistocardiogram artifacts from EEG data acquired in the MRI scanner. NeuroImage 2005; 24:50–60. PMID:15588596
24. Smith SM, Jenkinson M, Woolrich MW, Beckmann CF, Behrens TE, Johansen-Berg H, et al. Advances in functional and structural MR image analysis and implementation as FSL. NeuroImage 2004; 23:208–
219.
25. Worsley KJ, Liao CH, Aston J, Petre V, Duncan GH, Morales F, et al. A general statistical analysis for fMRI data. NeuroImage 2002; 15:1–15. PMID:11771969
26. Bagshaw AP, Aghakhani Y, Bénar CG, Kobayashi E, Hawco C, Dubeau F, et al. EEG-fMRI of focal epi-leptic spikes: analysis with multiple haemodynamic functions and comparison with gadolinium-enhanced MR angiograms. Hum Brain Mapp. 2004; 22:179–192. PMID:15195285
27. An D, Fahoum F, Hall J, Olivier A, Gotman J, Dubeau F. Electroencephalography/functional magnetic resonance imaging responses help predict surgical outcome in focal epilepsy. Epilepsia 2013; 54:2184–2194. doi:10.1111/epi.12434PMID:24304438
28. Luo C, An D, Yao D, Gotman J. Patient-specific connectivity pattern of epileptic network in frontal lobe epilepsy. Neuroimage Clin. 2014; 4:668–675. doi:10.1016/j.nicl.2014.04.006PMID:24936418
29. Donaire A, Capdevila A, Carreño M, Setoain X, RumiàJ, Aparicio J, et al. Identifying the cortical sub-strates of interictal epileptiform activity in patients with extratemporal epilepsy: An EEG-fMRI sequential analysis and FDG-PET study. Epilepsia 2013; 54:678–690. doi:10.1111/epi.12091PMID:23362864
30. Sierra-Marcos A, Maestro I, Falcón C, Donaire A, Setoain J, Aparicio J, et al. Ictal EEG-fMRI in localiza-tion of epileptogenic area in patients with refractory neocortical focal epilepsy. Epilepsia 2013; 54:1688–1698. doi:10.1111/epi.12329PMID:23895643
31. Flanagan D, Badawy RA, Jackson GD. EEG-fMRI in focal epilepsy: local activation and regional net-works. Clin Neurophysiol. 2014; 125:21–31. doi:10.1016/j.clinph.2013.06.182PMID:23871167
32. An D, Dubeau F, Gotman J. BOLD responses related to focal spikes and widespread bilateral synchro-nous discharges generated in the frontal lobe. Epilepsia 2015; 56:366–374. doi:10.1111/epi.12909 PMID:25599979
33. Gonzalez-Castillo J, Saad ZS, Handwerker DA, Inati SJ, Brenowitz N, Bandettini PA. Whole-brain, time-locked activation with simple tasks revealed using massive averaging and model-free analysis. Proc Natl Acad Sci USA. 2012; 109:5487–5492. doi:10.1073/pnas.1121049109PMID:22431587
34. Bénar CG, Grova C, Kobayashi E, Bagshaw AP, Aghakhani Y, Dubeau F, et al. EEG-fMRI of epileptic spikes: concordance with EEG source localization and intracranial EEG. NeuroImage 2006; 30:1161–
1170. PMID:16413798
35. Jacobs J, Hawco C, Kobayashi E, Boor R, LeVan P, Stephani U, et al. Variability of the hemodynamic response as a function of age and frequency of epileptic discharge in children with epilepsy. Neuro-Image 2008; 40:601–614. doi:10.1016/j.neuroimage.2007.11.056PMID:18221891
36. Zijlmans M, Huiskamp GM, Leijten FS, Van Der Meij WM, Wieneke G, Van Huffelen AC. Modality-spe-cific spike identification in simultaneous magnetoencephalography/electroencephalography: a method-ological approach. J Clin Neurophysiol. 2002; 19:183–191. PMID:12226563
37. Kobayashi K, James CJ, Nakahori T, Akiyama T, Gotman J. Isolation of epileptiform discharges from unaveraged EEG by independent component analysis. Clin Neurophysiol 1999; 110:1755–1763. PMID:10574290
38. Pedreira C, Vaudano AE, Thornton RC, Chaudhary U J, Vulliemoz S, Laufs H, et al. Classification of EEG abnormalities in partial epilepsy with simultaneous EEG-fMRI recordings. NeuroImage 2014; 99:461–476. doi:10.1016/j.neuroimage.2014.05.009PMID:24830841
39. Yao D. A method to standardize a reference of scalp EEG recordings to a point at infinity. Physiol. Meas. 2001; 22:693–711. PMID:11761077
40. LeVan P, Jacobs J, Stich J, Zahneisen B, Hugger T, Assländer J, et al. EEG-fMRI using the ultra-fast MREG sequence allows the single-trial localization of epileptic spikes. Proc. 18th Annual Meeting of the OHBM, Beijing 2012.
41. Lantz G, Grave de Peralta R, Spinelli L, Seeck M, Michel CM. Epileptic source localization with high density EEG: how many electrodes are needed? Clin Neurophysiol. 2003; 114:63–69. PMID: 12495765
42. Michel CM, Lantz G, Spinelli L, De Peralta RG, Landis T, Seeck M. 128-channel EEG source imaging in epilepsy: clinical yield and localization precision. J Clin Neurophysiol. 2004; 21:71–83 PMID: 15284597
44. Sperli F, Spinelli L, Seeck M, Kurian M, Michel CM, Lantz G, et al. EEG source imaging in pediatric epi-lepsy surgery: a new perspective in presurgical workup. Epilepsia 2006; 47:981–990. PMID:16822244
45. Lemieux L, Krakow K, Fish DR. Comparison of spike-triggered functional MRI BOLD activation and EEG dipole model localization. NeuroImage 2001; 14:1097–1104. PMID:11697941
46. Raichle ME, MacLeod AM, Snyder AZ, Powers WJ, Gusnard DA, Shulman GL. A default mode of brain function. Proc Natl Acad Sci U S A 2001; 98:676–682. PMID:11209064
47. Aguirre G K, Zarahn E, D’Esposito M. The variability of human, BOLD hemodynamic responses. Neuro-Image 1998; 8:360–369. PMID:9811554
48. Handwerker DA, Ollinger JM, D’Esposito M. Variation of BOLD hemodynamic responses across sub-jects and brain regions and their effects on statistical analyses. NeuroImage 2004; 21:1639–1651. PMID:15050587
49. Glover G. Deconvolution of Impulse Response in Event-Related BOLD fMRI 1. NeuroImage 1999; 9:416–429. PMID:10191170
50. Grouiller F, Vercueil L, Krainik A, Segebarth C, Kahane P, David O. Characterization of the hemody-namic modes associated with interictal epileptic activity using a deformable model-based analysis of combined EEG and functional MRI recordings. Hum Brain Mapp 2010; 31:1157–1173. doi:10.1002/ hbm.20925PMID:20063350
51. Kang JK, Bénar CG, Al-Asmi A, Khani YA, Pike GB, Dubeau F, et al. Using patient-specific hemody-namic response functions in combined EEG-fMRI studies in epilepsy. NeuroImage 2003; 20:1162–
1170. PMID:14568485
52. Proulx S, Safi-Harb M, LeVan P, An D, Watanabe S, Gotman J. Increased sensitivity of fast BOLD fMRI with a subject-specific hemodynamic response function and application to epilepsy. NeuroImage 2014; 93:59–73. doi:10.1016/j.neuroimage.2014.02.018PMID:24582920