HESSD
12, 1247–1277, 2015Landscape geometry in a patterned
peatland
S. Acharya et al.
Title Page
Abstract Introduction
Conclusions References
Tables Figures
◭ ◮
◭ ◮
Back Close
Full Screen / Esc
Printer-friendly Version Interactive Discussion
Discussion
P
a
per
|
Discussion
P
a
per
|
Discussion
P
a
per
|
Discussion
P
a
per
|
Hydrol. Earth Syst. Sci. Discuss., 12, 1247–1277, 2015 www.hydrol-earth-syst-sci-discuss.net/12/1247/2015/ doi:10.5194/hessd-12-1247-2015
© Author(s) 2015. CC Attribution 3.0 License.
This discussion paper is/has been under review for the journal Hydrology and Earth System Sciences (HESS). Please refer to the corresponding final paper in HESS if available.
Coupled local facilitation and global
hydrologic inhibition drive landscape
geometry in a patterned peatland
S. Acharya1, D. A. Kaplan2, S. Casey1, M. J. Cohen1, and J. W. Jawitz3
1
School of Forest Resources and Conservation, University of Florida, Gainesville, FL, USA
2
Environmental Engineering Sciences, Engineering School of Sustainable Infrastructure & Environment, University of Florida, Gainesville, FL, USA
3
Soil and Water Science Department, University of Florida, Gainesville, FL, USA
Received: 9 December 2014 – Accepted: 17 January 2015 – Published: 28 January 2015 Correspondence to: S. Acharya ([email protected])
HESSD
12, 1247–1277, 2015Landscape geometry in a patterned
peatland
S. Acharya et al.
Title Page
Abstract Introduction
Conclusions References
Tables Figures
◭ ◮
◭ ◮
Back Close
Full Screen / Esc
Printer-friendly Version Interactive Discussion
Discussion
P
a
per
|
Discussion
P
a
per
|
Discussion
P
a
per
|
Discussion
P
a
per
|
Abstract
Self-organized landscape patterning can arise in response to multiple processes. Dis-criminating among alternative patterning mechanisms, particularly where experimen-tal manipulations are untenable, requires process-based models. Previous modeling studies have attributed patterning in the Everglades (Florida, USA) to sediment
redis-5
tribution and anisotropic soil hydraulic properties. In this work, we tested an alternate theory, the self-organizing canal (SOC) hypothesis, by developing a cellular automata model that simulates pattern evolution via local positive feedbacks (i.e., facilitation) coupled with a global negative feedback based on hydrology. The model is forced by global hydroperiod that drives stochastic transitions between two patch types: ridge
10
(higher elevation) and slough (lower elevation). We evaluated model performance us-ing multiple criteria based on six statistical and geostatistical properties observed in reference portions of the Everglades landscape: patch density, patch anisotropy, semi-variogram ranges, power-law scaling of ridge areas, perimeter area fractal dimension, and characteristic pattern wavelength. Model results showed strong statistical
agree-15
ment with reference landscapes, but only when anisotropically acting local facilitation was coupled with hydrologic global feedback, for which several plausible mechanisms exist. Critically, the model correctly generated fractal landscapes that had no character-istic pattern wavelength, supporting the invocation of global rather than scale-specific negative feedbacks.
20
1 Introduction
The structure and function of natural ecosystems are shaped by complex interactions between biotic and abiotic processes acting at different spatial scales. In resource-limited environments, these interactions can give rise to self-organized, patterned land-scapes (Rietkerk and van de Koppel, 2008; Dyskin, 2007). Archetypal examples exist
25
HESSD
12, 1247–1277, 2015Landscape geometry in a patterned
peatland
S. Acharya et al.
Title Page
Abstract Introduction
Conclusions References
Tables Figures
◭ ◮
◭ ◮
Back Close
Full Screen / Esc
Printer-friendly Version Interactive Discussion
Discussion
P
a
per
|
Discussion
P
a
per
|
Discussion
P
a
per
|
Discussion
P
a
per
|
et al., 2007; Klausmeier, 1999; Mabbutt and Fanning, 1987) and peatlands (Prance and Schaller, 1982; Eppinga et al., 2009; Larsen and Harvey, 2011). These patterns range from regular mosaics with characteristic length scales to scale-free patterns ex-hibiting heavy tailed patch size distributions (von Hardenberg et al., 2010). While both types of patterns typically signify the resource limited nature of their respective
en-5
vironments, the primary biotic and/or abiotic processes that dictate the evolution of regular and scale-free landscapes are thought to be considerably different. Regardless of their driving mechanisms, patterned landscapes create ecological heterogeneity and thus help maintain biological diversity (Kolasa and Rollo, 1991) and productivity, and increase system resiliency (van de Koppel and Rietkerk, 2004). Given their reliance
10
on a critical resource (e.g., water, nutrients or both), the presence of self-organized patterning also suggests that even subtle disturbances or environmental changes can lead to catastrophic shifts in ecosystem states (Kefi et al., 2007, 2011; Reitkerk et al., 2004). Therefore, understanding the mechanisms that govern the development and maintenance of landscape pattern is crucially important to conserving their ecological
15
attributes, particularly as the exogenous drivers are disrupted by climate change and large-scale anthropogenic landscape modification.
The ridge-slough landscape in the Everglades (Florida, USA) is a patterned land-scape in which two distinct vegetation communities, ridges and sloughs, comprise a self-organized landscape mosaic (Fig. 1a). Ridge patches occupy higher soil
ele-20
vations (∆z∼25 cm in the best-conserved landscapes; Watts et al., 2010) and are dominated by the emergent sedgeCladium jamaicense, while sloughs contain a mix of submerged, floating leaved and emergent plants. One of the most striking features of the landscape is its clear anisotropic spatial structure, with ridge patches elongated in the direction of historic surface water flow (SCT, 2003; Larsen et al., 2007).
Hy-25
HESSD
12, 1247–1277, 2015Landscape geometry in a patterned
peatland
S. Acharya et al.
Title Page
Abstract Introduction
Conclusions References
Tables Figures
◭ ◮
◭ ◮
Back Close
Full Screen / Esc
Printer-friendly Version Interactive Discussion
Discussion
P
a
per
|
Discussion
P
a
per
|
Discussion
P
a
per
|
Discussion
P
a
per
|
mainly to compartmentalization and attendant hydrologic modification, along with agri-cultural nutrient enrichment (Wu et al., 2006; Light and Dineen, 1997; Gaiser et al., 2005).
Adverse ecological impacts associated with reduced slough extent and connectiv-ity (SCT, 2003) have led to pattern maintenance and restoration being focal points for
5
restoration planning and assessment. A prerequisite for successful ecological restora-tion efforts is a clear understanding of pattern genesis mechanisms and the time frame for that process to occur. Despite multiple plausible mechanisms, these feedbacks re-main poorly understood (Cohen et al., 2011) principally because of difficulties asso-ciated with observation and experimental manipulation at large enough spatial and
10
temporal scales, a constraint that focuses attention on models of pattern genesis and degradation.
Several hypotheses have been proposed to explain the ridge-slough patterning and have produced models that are capable of generating elongated patches. In all cases, pattern evolution in modeled landscapes responds to water flow (and flow direction) but
15
it remains unclear which flow attributes and/or processes govern the process. More-over, it has been shown elsewhere that different combinations of processes may gen-erate similar patterns (Eppinga et al., 2009), making inference of a single dominant mechanism challenging. Models of ridge-slough pattern genesis have invoked diff er-ential sediment transport (Larsen et al., 2011; Lago et al., 2010), nutrient
redistribu-20
tion (Ross et al., 2006), and biased subsurface flow induced by anisotropic hydraulic conductivity (Cheng et al., 2011) as driving mechanisms. Using a process based nu-merical model, Ross et al. (2006) showed that differential evapotranspiration rates in higher elevation soils may lead to the concentration of dissolved nutrients (particularly phosphorus), suggesting that this nutrient redistribution, alone or in combination with
25
eren-HESSD
12, 1247–1277, 2015Landscape geometry in a patterned
peatland
S. Acharya et al.
Title Page
Abstract Introduction
Conclusions References
Tables Figures
◭ ◮
◭ ◮
Back Close
Full Screen / Esc
Printer-friendly Version Interactive Discussion
Discussion
P
a
per
|
Discussion
P
a
per
|
Discussion
P
a
per
|
Discussion
P
a
per
|
tial peat accretion, sediment transport and erosion. Cheng et al. (2011) incorporated anisotropic hydraulic conductivity in a scale-dependent feedback (advection–diffusion) model to demonstrate the evolution of flow-parallel, elongated vegetation bands. Cru-cially, however, all of these models generate pattern by coupling local positive feed-backs with a distal negative feedback at some intermediate distance imposed either
5
explicitly (Cheng et al., 2011) or implicitly (e.g., erosion and sediment transport by flow, Larsen and Harvey, 2010, 2011; Lago et al., 2010).
As we discuss below, although these models yield patches that are elongated in the direction of flow, the modeled landscapes lack several other critical pattern met-rics unique to the conserved portion of the ridge-slough system. With the exception of
10
Larsen and Harvey (2010, 2011), all other models generate patterns that are strikingly regular and with a characteristic separation distance (e.g. Cheng et al., 2011), a prop-erty that appears to be absent in the Everglades ridge-slough mosaic. Furthermore, our recent analyses (Casey et al., 2015) of the ridge-slough landscape have shown that the patches in this landscape are strongly scale-independent, suggesting that the
15
negative feedback that stabilizes patch expansion in these landscapes is global, rather than a distal, scale-dependent mechanism.
An alternate explanation for ridge-slough patterning that includes a global negative feedback is the self-organizing canal (SOC) hypothesis (Cohen et al., 2011; Heff er-nan et al., 2013). In this conceptualization, spatially anisotropic patterning emerges
20
from global constraints on patch (both ridges and sloughs) expansion created by feed-backs between landscape geometry, water flow, and hydroperiod, which controls peat accretion (and therefore affects landscape geometry). In short, the SOC hypothesis proposes that elongated patches develop as the landscape incrementally adjusts its spatial geometry (ridge density, size and shape) to optimize the discharge competence
25
longi-HESSD
12, 1247–1277, 2015Landscape geometry in a patterned
peatland
S. Acharya et al.
Title Page
Abstract Introduction
Conclusions References
Tables Figures
◭ ◮
◭ ◮
Back Close
Full Screen / Esc
Printer-friendly Version Interactive Discussion
Discussion
P
a
per
|
Discussion
P
a
per
|
Discussion
P
a
per
|
Discussion
P
a
per
|
tudinally connected sloughs). Both scenarios yield a global increase in hydroperiod for a given boundary flow (Kaplan et al., 2012). Increased hydroperiod, in turn, makes conditions more favorable for ridge-to-slough transitions, which decreases ridge den-sity, lowering hydroperiod, and ultimately tuning landscape pattern to hydrology.
The core assumption in the SOC hypothesis is that patch elongation occurs because
5
changes in patch density affect discharge competence anisotropically. Specifically, ex-pansion of ridge patches parallel to flow has a neutral effect on discharge competence (and thus hydroperiod), while patch expansion orthogonal to flow has a strong neg-ative effect on discharge competence. Kaplan et al. (2012) demonstrated this feed-back with a hydrodynamic model of surface water flow across randomly generated
pat-10
terned landscapes of varying anisotropy, finding that hydroperiod decreased exponen-tially with increasing patch anisotropy. Using a patch-scale analytical model, Heffernan et al. (2013) demonstrated strong feedbacks between the soil elevation at any given location and an adjacent location perpendicular to flow, but no such feedback parallel to flow, lending support to the central mechanism of the SOC hypothesis. However,
15
that analytical model was limited to two patches, where flow in one cell was directly controlled by flow in the only other cell. To further test the SOC hypothesis requires evaluating the potential for this mechanism to generate anisotropic patterning at the landscape scale.
In this study we implemented the local and global feedbacks described in the SOC
20
hypothesis (Cohen et al., 2011; Heffernan et al., 2013) in a stochastic cellular automata framework to model temporal evolution of the ridge-slough pattern. Transition proba-bilities between ridge and slough states were driven by hydroperiod (a global negative feedback) and local facilitation. Both isotropic and anisotropic neighborhood kernels were implemented, and simulations were performed under different combinations of
lo-25
HESSD
12, 1247–1277, 2015Landscape geometry in a patterned
peatland
S. Acharya et al.
Title Page
Abstract Introduction
Conclusions References
Tables Figures
◭ ◮
◭ ◮
Back Close
Full Screen / Esc
Printer-friendly Version Interactive Discussion
Discussion
P
a
per
|
Discussion
P
a
per
|
Discussion
P
a
per
|
Discussion
P
a
per
|
2 Methods
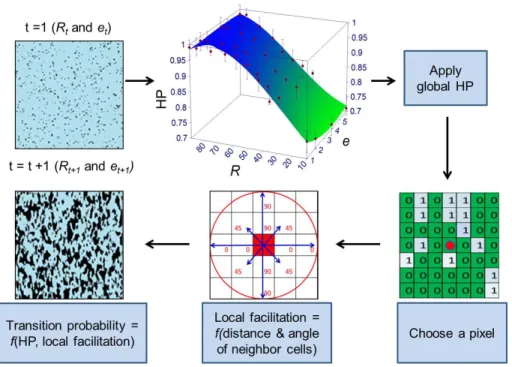
2.1 Hydrologic model
We first expanded the hydrodynamic modeling procedure outlined by Kaplan et al. (2012) to calculate hydroperiods for landscapes over a wide range of ridge-densities (%R) and anisotropy values (e). Steady-state flows were simulated for 960
5
synthetically derived ridge-slough landscapes with %R and e ranging from 10–90 % and 1.0–6.0 respectively using a spatially distributed numerical flow model (SWIFT2D) (Schaffranek, 2004). For each landscape, rating curves were created by applying a se-ries of constant head boundary conditions (BCs) at the up- and downstream model domain boundaries, assuming uniform flow and no-flow BCs at the domain lateral
10
boundaries. A 20 year (1992–2012) daily time-series of modeled flows (see Kaplan et al., 2012) was then used along with landscape-specific rating curves to calculate daily surface water elevations and resulting hydroperiod in each landscape. Finally, a polynomial function response-surface fitted to modeled data yielded a meta-model of hydroperiod (HP, the fraction of time a location is inundated) as a function of %R and
15
e(Fig. 1b).
2.2 Cellular automata model
Our cellular automata (CA) model consists of two states: ridges and sloughs. While the natural system contains variations in these states (e.g., wet prairie communities that can persist in short hydroperiod sloughs; Zweig and Kitchens, 2008), they are likely
20
transitional states between sloughs and ridges and were not included. Tree islands were likewise neglected in the CA model. While tree islands are critically important to the Everglades landscape, they represent only approximately 3 % of the total landscape area, and their emergence and maintenance is thought to be controlled by different mechanisms than those explored here (Ross et al., 2006; Wetzel et al., 2009).
HESSD
12, 1247–1277, 2015Landscape geometry in a patterned
peatland
S. Acharya et al.
Title Page
Abstract Introduction
Conclusions References
Tables Figures
◭ ◮
◭ ◮
Back Close
Full Screen / Esc
Printer-friendly Version Interactive Discussion
Discussion
P
a
per
|
Discussion
P
a
per
|
Discussion
P
a
per
|
Discussion
P
a
per
|
System states in the ridge-slough landscape are differentiated by two primary char-acteristics: vegetation and soil elevation (Watts et al., 2010). Our model assumes that when a cell transitions from one state to the other, vegetation and soil elevation at-tributes are updated immediately. The probabilities that govern transitions between states are dictated both by a global feedback based on hydroperiod and a local
fa-5
cilitation effect of neighboring cells. A schematic of the model framework shows the recursive algorithm that generates landscape pattern (Fig. 2).
2.2.1 Local facilitation
Local facilitation of patch expansion was modeled based on the similarity of neighbor-ing cell states to the cell state under transition. That is, the probability of a cell changneighbor-ing
10
state is locally controlled by the neighborhood of adjacent cells. Ecologically, these ef-fects may arise due to plant propagation (vegetative and reproductive), changes in primary production at patch edges that change peat accretion rates, and potential abi-otic factors, such as nutrient and sediment transport mediated by flow (Ross et al., 2006; Larsen et al., 2011). Local facilitation, λ, ranges from 0 to 1, and decreases
15
exponentially with distance (d), such that:
λ=
P
(exp(−kjdj)xj)
P
exp(−kjdj) (1)
wherej=1, 2, . . . ,n(number of neighbor cells); x is the state of each neighbor cell (x=1 if the same state as the center cell, 0 otherwise); and k is an exponential de-cay parameter. Large values of k in Eq. (1) indicate that the local facilitation effect
20
decreases sharply within a short distance, indicating that the immediate neighbor cells contribute most of the local facilitation. Small k values, in contrast, connote a larger area of effect with all neighbors contributing more uniformly to the local facilitation. A circular neighborhood was employed with the radius determined such that the cumu-lative distribution function of Eq. (1) for all surrounding neighbor cells within that radius
25
HESSD
12, 1247–1277, 2015Landscape geometry in a patterned
peatland
S. Acharya et al.
Title Page
Abstract Introduction
Conclusions References
Tables Figures
◭ ◮
◭ ◮
Back Close
Full Screen / Esc
Printer-friendly Version Interactive Discussion
Discussion
P
a
per
|
Discussion
P
a
per
|
Discussion
P
a
per
|
Discussion
P
a
per
|
Note that Eq. (1) assumes an isotropic neighborhood effect, i.e., neighboring cells influence adjacent cells regardless of direction. Directional bias on local facilitation, which may occur in response to the direction of flow, was also imposed by varying the local facilitation decay rate,k, as a function of the angle between the center cell and its neighboring cells:
5
k=(90
−αj) 90 kx+
αj
90ky (2)
whereαj is the absolute azimuth angle between the longitudinal direction and a line connecting the cell and its neighbor (expressed as 0≤α≤90 for each quadrant of the neighborhood kernel),kx is the exponential decay parameter in the east–west (E–W) direction andky is the exponential decay parameter in north–south (N–S) direction. In
10
Eq. (2), the ratiokx:ky describes the directional bias of the local facilitation effect.
2.2.2 Transition probabilities
The HP meta-model is the hydrologic foundation of the CA model (Fig. 2), with HP variation creating the global negative feedback that drives changes in ridge-slough configuration. Landscape pattern conducive to efficient drainage (lower %R, highere)
15
lowers hydroperiod, increasing the probability of a slough pixel transitioning to ridge, while landscape patterns that inhibit drainage (higher %R, lowere) decrease that tran-sition probability. Crucially, this hydroperiod effect is manifest at the domain scale (i.e., globally). We assume landscape HP as the global driver instead of a local parame-ter because of the extremely low relief (ca. 0.003 %) of the Everglades which creates
20
highly uniform water levels over the entire wetland system.
HESSD
12, 1247–1277, 2015Landscape geometry in a patterned
peatland
S. Acharya et al.
Title Page
Abstract Introduction
Conclusions References
Tables Figures
◭ ◮
◭ ◮
Back Close
Full Screen / Esc
Printer-friendly Version Interactive Discussion
Discussion
P
a
per
|
Discussion
P
a
per
|
Discussion
P
a
per
|
Discussion
P
a
per
|
by landscape HP), expressed as:
PR→S=1−λR+(HP −HPt) HPt
(3)
PS→R=1−λS+(HPt−HP) HPt
(4)
where,λRandλSare the local facilitation for ridge and slough, respectively, and HPt=
0.87 is the target hydroperiod, based on the range of expected HP for well conserved
5
landscapes in the Everglades (Givnish et al., 2008; McVoy et al., 2011; Cohen et al., 2011).
The transition probability formulations (Eqs. 3 and 4) are identical to those used by Foti et al. (2012), with one key difference: these authors imposed the global nega-tive feedback mechanism by directly setting a target vegetation density, whereas here
10
a target hydroperiod is implemented. This formulation is based on observations of the temporal dynamics of change in the ridge-slough landscape, which suggest that ridge density can change quickly towards a landscape that is dominated by either ridge or slough based on hydroperiod (Nungessar, 2011). Furthermore, this construction allows for variable ridge density driven by HP, which, in turn, is controlled by the density and
15
anisotropy of patches (Kaplan et al., 2012). Setting a target HP therefore explicitly con-siders bidirectional interactions between hydrology and landscape geometry, allowing for future modeling based on perturbations to hydrological forcing.
2.2.3 Model domain and parameterization
Simulations begin with a randomly generated, 3.5 km×3.5 km landscape composed of
20
land-HESSD
12, 1247–1277, 2015Landscape geometry in a patterned
peatland
S. Acharya et al.
Title Page
Abstract Introduction
Conclusions References
Tables Figures
◭ ◮
◭ ◮
Back Close
Full Screen / Esc
Printer-friendly Version Interactive Discussion
Discussion
P
a
per
|
Discussion
P
a
per
|
Discussion
P
a
per
|
Discussion
P
a
per
|
scape in the following time step. Based on the new landscape configuration (i.e., diff er-ent %Rande), a new HP is calculated (Fig. 1), yielding a new global feedback function based on Eqs. (3) and (4). Landscape configuration thus changes iteratively (Fig. 2), eventually reaching a dynamic equilibrium when %R,e, and HP have stabilized.
The local feedback mechanism is dictated by the magnitudes of kx and ky as well
5
as their ratio. Increasing magnitudes of kx and ky indicates greater “spatial immedi-acy” of neighbors (Scanlon et al., 2007) in the respective directions, while the ratio kx:ky describes the magnitude of anisotropy in local facilitation. We explored effects of magnitude and ratio of these two parameters by simulating landscapes using seven different values ofky from 0.10 to 0.40 (corresponding to a circular neighborhood with
10
radius from ca. 20–70 m) and seven levels of anisotropy in local facilitation (kx:ky ra-tios from 1.0 to 4.0). With increasingkx:ky ratio, the shape of the local facilitation effect becomes more elliptical with elongation in the N–S direction as local feedback in the E–W decays sharply with increasing distance. Simulations were replicated a minimum of six times for each combination of ky and kx:ky values to ensure that equilibrium
15
landscape characteristics were controlled by model parameters rather than random initial conditions. We note from preliminary simulations, that for a givenky, a maximum value ofkx:ky existed, beyond which any increase inkx severely restricted patch ex-pansion in the E–W direction. This resulted in extremely narrow ridges (1–2 cells wide) that drove evalues towards ∞, leading to model instability because of the feedback
20
ofeon hydroperiod. For example, forky=0.2, steady state could not be attained for kx:ky>3.5 while for ky =0.35, steady state could be achieved only forkx:ky ≤2.0, Therefore, for each ky magnitude the final simulations were performed only for the kx:ky ratios that consistently resulted in a stable equilibrium.
2.3 Landscape pattern metrics
25
HESSD
12, 1247–1277, 2015Landscape geometry in a patterned
peatland
S. Acharya et al.
Title Page
Abstract Introduction
Conclusions References
Tables Figures
◭ ◮
◭ ◮
Back Close
Full Screen / Esc
Printer-friendly Version Interactive Discussion
Discussion
P
a
per
|
Discussion
P
a
per
|
Discussion
P
a
per
|
Discussion
P
a
per
|
2011; Watts et al., 2010). Thirteen reference landscapes from a study of Everglades landscapes by Nungesser (2011) were augmented by 8 additional reference land-scapes presented by Casey et al. (2015). All pattern metrics were based on analyses of rasters created with a 10 m cell resolution from vector maps (Rutchey, 1995).
Comparisons between simulated and reference landscapes were based on seven
5
statistical and geostatistical characteristics: overall %R, e, correlation length scales (semivariograms) parallel and orthogonal to historical flow, distribution of patch sizes, perimeter area fractal dimension (PAFRAC), and landscape characteristic wavelength (periodicity).
Patch density was calculated as ridge area divided by total domain area. Patch
10
anisotropy was estimated as the ratio of the major (parallel to flow) and minor (or-thogonal to flow) ranges of indicator semivariograms (Deutsch and Journel, 1998); the correlation length scales inferred from these spatial ranges were also of interest to ensure that the model predicted realistic patch geometry. Distributions of patch sizes, which follow power-law scaling in the reference landscapes were evaluated for
good-15
ness of fit in comparison to the Pareto (power law) distribution using Monte-Carlo tests (Clauset et al., 2009). The fractal dimension (PAFRAC), which measures patch shape complexity, was calculated from the fitted slope between patch area and perimeter. Finally, patch periodicity was evaluated using radial spectrum (r-spectrum) analysis, which extracts the spectral components of the landscape pattern as a function of
possi-20
ble wavenumbers (i.e., spatial frequency divided by domain size). The r-spectra, which are used to identify the characteristic wavelength and directional components of regular patterns, were obtained using two-dimensional Fourier transforms following methods outlined by Couteron and Lejeune (2001).
We note that many landscape attributes (e.g., semivariograms) are affected by
spa-25
map-HESSD
12, 1247–1277, 2015Landscape geometry in a patterned
peatland
S. Acharya et al.
Title Page
Abstract Introduction
Conclusions References
Tables Figures
◭ ◮
◭ ◮
Back Close
Full Screen / Esc
Printer-friendly Version Interactive Discussion
Discussion
P
a
per
|
Discussion
P
a
per
|
Discussion
P
a
per
|
Discussion
P
a
per
|
ping unit (MMU) varies from 20–50 m (Nungesser, 2011; Rutchey et al., 1995), smaller features (<10 m) are apparent in these mapping products. Setting raster and model resolution at 10 m captured the majority of perceivable features without requiring un-tenable computation time.
Our primary motivation in comparing model results to reference landscapes for these
5
metrics is to elucidate the nature of local interactions required to create pattern that is statistically consistent with the best-conserved portions of the extant Everglades (i.e., elongated, flow-parallel ridge patches). We therefore applied a multi-criteria objective function to quantify agreement between simulated and reference landscapes for the pattern metrics listed above. Simulated landscapes received a score of one for each of
10
the seven metrics that fell within the range of values observed in reference landscapes, and the sum was used as an integrated measure of pattern agreement (IMPA; maxi-mum IMPA =7.0). A mean IMPA score was calculated for each parameter set (i.e., the average IMPA score of 6 simulation replications), allowing us to identify combinations of parameters that yielded patterning concordant with the reference landscapes. While
15
the IMPA approach is useful for identifying model parameters that generate patterning consistent with the well-conserved ridge-slough mosaic, it is also important to note that some pattern metrics have been found to be ubiquitous across the present-day Ever-glades. For instance, power-law scaling and lack of a characteristic separation distance (aperiodicity) are observed in all parts of the ridge and slough system – regardless of
20
their state of degradation (Casey et al., 2015). This suggests that a reliable ridge-slough landscape model should produce landscapes with these criteria for all possible param-eter combinations (i.e., both isotropic and anisotropic model formulations), whether the simulated landscapes resemble the conserved or degraded ridge-slough mosaic.
3 Results
25
HESSD
12, 1247–1277, 2015Landscape geometry in a patterned
peatland
S. Acharya et al.
Title Page
Abstract Introduction
Conclusions References
Tables Figures
◭ ◮
◭ ◮
Back Close
Full Screen / Esc
Printer-friendly Version Interactive Discussion
Discussion
P
a
per
|
Discussion
P
a
per
|
Discussion
P
a
per
|
Discussion
P
a
per
|
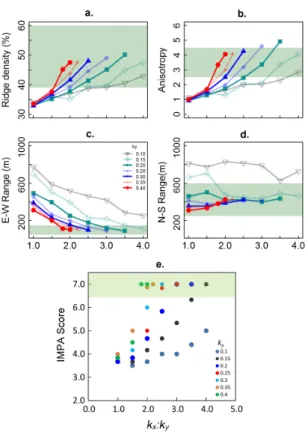
is of secondary importance. Consequently, the ridge-density of simulated ridge-slough landscapes showed greater sensitivity to changing hydroperiod regimes than the patch anisotropy. Patches in simulated landscapes with symmetric local facilitation (kx=ky) were always isotropic (e∼1; Fig. 3), with low ridge density (ca. 33 %) compared to
reference landscapes. Implementing directional bias (kx:ky>1.0) in local facilitation
5
resulted in anisotropic landscapes with higher %R. However not all kx:ky configu-rations yielded patterning geostatistically similar to the reference landscapes. For ex-ample, for all landscapes where ky=0.1 (effective neighborhood radius =ca. 70 m), regardless of the kx:ky ratio, patches were highly diffuse, extending across the en-tire domain, with spatial correlation lengths both parallel and orthogonal to flow that
10
were much larger than in the reference landscapes (Fig. 3). Asky increased, patches became more distinct and aggregated, with patch geometry that better resembled the reference landscapes both qualitatively and quantitatively.
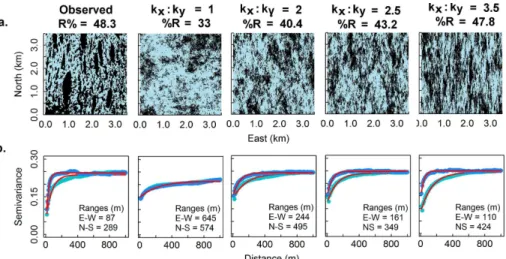
Simulated landscapes for ky =0.2 (effective neighborhood radius = ca. 40 m) and kx:ky of 1.0, 2.0, 2.5, and 3.5 show a strong qualitative resemblance to an example
15
reference landscape (Fig. 4a), particularly at higher values ofkx:ky (≥2.5). High
val-ues ofkx:ky also resulted in reference landscape similarity for semivariogram ranges (Fig. 4b) and pattern anisotropy, withevalues within the range observed in reference landscapes (2.5–5.0) (Nungesser, 2011; Kaplan et al., 2012).
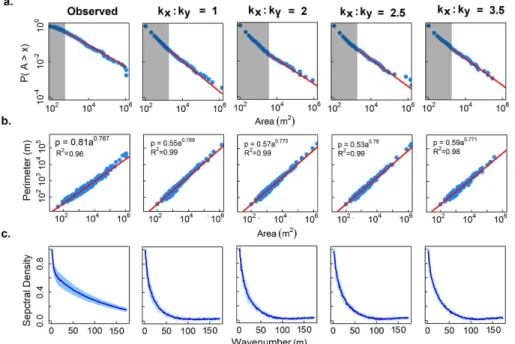
The distribution of ridge areas in the simulated landscapes showed significant
sup-20
port for power law scaling following Clauset et al. (2009) (i.e., we cannot reject the hypothesis that the distribution differs significantly from power law at the 0.1 level). Power law scaling was consistent across model realizations, regardless of %R and e (i.e., for all parameter combinations, Fig. 5a), which agrees with the observed patch size distribution in both conserved and degraded ridge and slough landscapes (Casey
25
HESSD
12, 1247–1277, 2015Landscape geometry in a patterned
peatland
S. Acharya et al.
Title Page
Abstract Introduction
Conclusions References
Tables Figures
◭ ◮
◭ ◮
Back Close
Full Screen / Esc
Printer-friendly Version Interactive Discussion
Discussion
P
a
per
|
Discussion
P
a
per
|
Discussion
P
a
per
|
Discussion
P
a
per
|
kx:ky ratios – a result also echoed by the similarity of fittedβvalues in conserved and degraded landscapes observed by Casey et al. (2015).
The perimeter-area scaling of patches showed that the modeled landscapes were highly fractal (Fig. 5b), as evidenced by the linear relationship between log (perimeter) and log (area) (slope>0.5; Foti et al., 2012). However, the scaling relationship for the
5
reference landscapes deviate from the linear function indicating their a non-fractal na-ture Although a linear–scaling relationship seemed to hold acceptably within a certain patch-size range (Fig. 5b), Casey et al. (2015) found that the perimeter-area scaling in real ridge-slough landscapes was better explained by a quadratic function over the entire size range (i.e., without any cutoffs). This indicates that the larger patches in real
10
landscapes are increasingly more complex as opposed to the simple power functions followed by the modeled landscapes that suggest an equal degree of shape complexity for all patch-sizes. Finally, similar to the r-spectra in reference landscapes, our simu-lated landscapes exhibit the clear absence of a characteristic wavelength (i.e., r-spectra maxima at non-zero distance) (Fig. 5c). This suggests that both the real and simulated
15
landscapes are aperiodic (i.e., not regularly patterned) (Casey et al., 2015), a feature consistent with global rather than scale-dependent patch constraints.
Summarizing the statistical and geostatistical properties of simulated landscapes (Fig. 6, symbols), in comparison with values observed in reference landscapes (shaded region) illustrates the relatively narrow parameter space over which model outputs
20
match the conserved (i.e., elongated, N–S oriented) patterning. Both %R and e in-crease nonlinearly with increasingky andkx:ky (Fig. 6a and b), and the slope relating e and kx:ky is highest when ky is large. The E–W semivariogram range (Fig. 6c) declines exponentially with kx:ky for all ky, while the N–S range (Fig. 6d) remains relatively flat. In combination, our results suggest that only a subset of simulated
25
HESSD
12, 1247–1277, 2015Landscape geometry in a patterned
peatland
S. Acharya et al.
Title Page
Abstract Introduction
Conclusions References
Tables Figures
◭ ◮
◭ ◮
Back Close
Full Screen / Esc
Printer-friendly Version Interactive Discussion
Discussion
P
a
per
|
Discussion
P
a
per
|
Discussion
P
a
per
|
Discussion
P
a
per
|
aligned with reference landscapes (IMPA=6.0), even when kx:ky is relatively small (i.e., 1.5 < kx:ky≤2.5). In contrast, with lower ky, (e.g., ky=0.15, equivalent to a neighborhood radius of ca. 45 m), only 24 % of simulations met the multi-criteria objective, and required the highest value ofkx:ky to do so.
4 Discussion
5
4.1 Testing the self-organizing canal hypothesis
A clear understanding of the processes underlying development of ecological patterns is integral to all ecosystem management and restoration. In the Everglades, venue for one of the largest and most ambitious ecosystem restoration efforts in history, the spe-cific focus on landscape pattern as a restoration objective underscores the urgency of
10
the process-pattern link. Identifying the suite of necessary and sufficient processes to create and maintain pattern will aid in prioritizing hydrologic restoration goals. Although multiple hypotheses exist for explaining the ridge-slough pattern, most of them attribute the development of these landscapes to one dominant process. The self-organizing-canal hypothesis (Cohen et al., 2011; Heffernan et al., 2013), on the other hand,
as-15
cribes pattern formation and maintenance to reciprocal feedbacks between landscape pattern and hydrology. Moreover, evidence of a strong feedback between pattern and hydroperiod (Kaplan et al., 2012) lends support for the SOC. Primacy of this mecha-nism vis-à-vis nutrient enrichment or sediment redistribution – and we note here that these mechanisms are not mutually exclusive – would imply markedly different water
20
management objectives, specifically emphasizing flow volume sufficient to ensure ap-propriate hydroperiod vs. water level management or creation of episodic high velocity The dominant spatial feature in the ridge-slough landscape is patch orientation with flow. As a minimum criterion, models that fail to produce flow-oriented elongation are clearly insufficient explanations for pattern development. Our results suggest that
25
ridge-HESSD
12, 1247–1277, 2015Landscape geometry in a patterned
peatland
S. Acharya et al.
Title Page
Abstract Introduction
Conclusions References
Tables Figures
◭ ◮
◭ ◮
Back Close
Full Screen / Esc
Printer-friendly Version Interactive Discussion
Discussion
P
a
per
|
Discussion
P
a
per
|
Discussion
P
a
per
|
Discussion
P
a
per
|
slough landscape, but only when local facilitation is directionally biased in the direction of flow. This suggests the SOC alone is an insufficient mechanism. Previous work com-paring static landscapes (Kaplan et al., 2012) showed that anisotropy exerted strong control on hydroperiod, but our model results suggest that in a dynamic landscape changes in patch density (%R) occur more quickly than changes in patch shape (e).
5
As such, %R provides the dominant control on HP (Fig. 1b), while anisotropy plays a secondary role. When local feedbacks are isotropic, the global negative feedback of pattern on hydroperiod selects for landscapes with low %R– at ca. 30 %, far below the value in the best conserved pattern and cannot generate patch anisotropy.
Recently, Heffernan et al. (2013) used an analytical model to explore the SOC,
10
demonstrating that ridge and slough elevation divergence occurs spontaneously at some discharge levels, and that the impact of a given cell on adjacent cells orthog-onal to flow is far larger than parallel to flow. In short, pattern arises solely due to feedbacks between hydroperiod and discharge competence (i.e., capacity to convey water), which is controlled by the configuration orthogonal to flow. To reconcile these
15
findings with our model results, we note that water flow in the Heffernan et al. (2013) model is limited to two flow-paths, where occlusion of flow in one cell (e.g., due to peat accretion there) must, of necessity, force water through the other. In contrast, our model comprises a relatively large domain with hundreds to thousands of possible flow-paths, weakening the influence of flow occlusion in any given cell on global hydroperiod. As
20
a result, the role of anisotropy on discharge competence is diminished, and ridge den-sity impacts on hydroperiod dominate.
We also note that the HP in this study is estimated assuming steady state flow con-ditions (as calculated over the 20 year period of record in Kaplan et al., 2012) and does not represent the possible effects of temporal fluctuations in flow that occur in the
Ev-25
HESSD
12, 1247–1277, 2015Landscape geometry in a patterned
peatland
S. Acharya et al.
Title Page
Abstract Introduction
Conclusions References
Tables Figures
◭ ◮
◭ ◮
Back Close
Full Screen / Esc
Printer-friendly Version Interactive Discussion
Discussion
P
a
per
|
Discussion
P
a
per
|
Discussion
P
a
per
|
Discussion
P
a
per
|
simulations driven by cyclically varying hydrology coupled with isotropic local facilitation did not drive ridge elongation in the resulting landscapes (i.e.,e=1) and yielded low values (<30 %) of %R due to the recurring high HP events. These initial simulations suggested that variation in HP affected %R much more thane, and was not sufficient to drive anisotropic patch evolution.
5
4.2 Multi-metric model performance
As noted above, the model developed here does create compelling ridge-slough pat-terning given anisotropic local facilitation effects. The plausibility of multiple model mechanisms, including those presented here, for creating flow-oriented elongation sug-gests that additional landscape characteristics are necessary for evaluating model
per-10
formance. The additional proposed pattern metrics (ridge density, anisotropy, autocor-relation range, patch size distribution, fractal dimension, and periodicity) provide a more nuanced and comprehensive basis on which to compare model outputs to real land-scapes. This approach is similar to Larsen and Harvey (2010) wherein multi-metric comparisons between modeled and real landscapes were made, but includes new
po-15
tentially relevant pattern metrics. While it was beyond the scope of the current work to compare the multiple existing models of the ridge-slough landscape, we note that our model outputs agree reasonably well with observations in the best conserved ridge-slough landscapes for all of the proposed metrics.
Among the most important differences between our model and others for the
ridge-20
slough pattern is invocation of an inhibitory feedback that operates globally rather than at a characteristic spatial scale. Constraints to patch expansion are induced at the en-tire domain scale, and not over local and/or intermediate scales, as is the case in Ross et al. (2006), Lago et al. (2010), Cheng et al. (2011) and Larsen and Harvey (2011). The principal reason for invoking a global rather than intermediate feedback is the
in-25
HESSD
12, 1247–1277, 2015Landscape geometry in a patterned
peatland
S. Acharya et al.
Title Page
Abstract Introduction
Conclusions References
Tables Figures
◭ ◮
◭ ◮
Back Close
Full Screen / Esc
Printer-friendly Version Interactive Discussion
Discussion
P
a
per
|
Discussion
P
a
per
|
Discussion
P
a
per
|
Discussion
P
a
per
|
simulate vegetation patterning (e.g., Scanlon et al., 2007; Foti et al., 2012), and in-duce three pattern features that merit particular attention: power-law scaling of patch areas, high fractal dimension (i.e., highly crenulated patch edges), and the absence of a characteristic pattern wavelength (which would be expected in regular patterning). Our simulations closely matched observed power-law scaling of patch areas (including
5
the scaling parameter,β) and, perhaps most importantly, the absence of a character-istic pattern wavelength implying no regular landscape periodicity. These landscape properties are exhibited in both well-conserved and degraded ridge-slough landscapes in the Everglades (Casey et al., 2015). That our model consistently reproduces them suggests that global inhibition is integral to ridge-slough pattern evolution. However,
10
that it does so across all model runs, even those that clearly fail to reproduce credible patterning, means that these metrics are necessary – but not sufficient – for discrimi-nating the anisotropic pattern genesis processes.
Pattern geometry, including flow-oriented elongation that is the sentinel feature of this landscape, is strongly controlled by the local facilitation function in our model. The
re-15
maining three metrics (%R,e, and semivariogram ranges) were used to conclude that only a subset of parameterizations for inducing local feedbacks yielded landscapes with geostatistical properties in agreement with reference landscapes. For example, %R and eof modeled landscapes fall well outside the reference values at low ky or smallkx:ky ratios (Fig. 6a and b). Likewise, modeled landscape semivariogram ranges
20
tend to be well above what is observed in the real systems (Fig. 6c and d) for these parameterizations. While the particular mechanisms that induce anisotropic facilitation are, as yet, unclear (see below), we can at least conclude that some parameterizations of local and global controls can satisfy all diagnostic metrics (Fig. 6e). The spatial range of the extant pattern is controlled in the model bykxandky, which control the distance
25
HESSD
12, 1247–1277, 2015Landscape geometry in a patterned
peatland
S. Acharya et al.
Title Page
Abstract Introduction
Conclusions References
Tables Figures
◭ ◮
◭ ◮
Back Close
Full Screen / Esc
Printer-friendly Version Interactive Discussion
Discussion
P
a
per
|
Discussion
P
a
per
|
Discussion
P
a
per
|
Discussion
P
a
per
|
in the N–S direction; this is further constrained in the E–W direction due to anisotropic facilitation (i.e.,kx> ky). Overall, of the 37 simulations, 22 % comported with all 6 met-rics observed in the conserved landscapes, all of which requiredkx> ky andky >0.15. Power law scaling of patch sizes has been associated with vegetation self-organization in many landscapes (e.g., Scanlon et al., 2007; Kefi et al., 2009, 2011),
5
but has only recently been evaluated for the Everglades (Foti et al., 2013) and specif-ically for ridge-slough patterned landscape (Casey et al., 2015). Most studies of the ridge-slough landscape have emphasized the perceived regular nature of the pattern, including invocation of a pattern wavelength of ca. 150 m (SCT, 2001; Larsen et al., 2007; Watts et al., 2010). Notably, power-law scaling of patch area is incompatible
10
with regular patterning because the basis of such patterning is the presence of dis-tal negative feedbacks that truncate patch expansion at some particular spatial range (van de Koppel and Crain, 2007). It is therefore critically important that our simulated landscapes, wherein inhibitory feedbacks are global and not scale-dependent, exhibit this power-law scaling behavior (Fig. 5a). It is also notable that the landscapes follow
15
such scaling regardless of ridge density or local facilitation parameters, which is also observed in all reference landscapes with various patch densities (Casey et al., 2015). These results are consistent with the concept of robust criticality in ecological systems, where local spatial interactions lead to power-law clustering of patches well below the percolation threshold (Kefi et al., 2011; Vandermeer et al., 2008). While the generality
20
of power law scaling in both simulated and real landscapes limits this metrics utility as a model diagnostic, it lends strong support for the primacy of scale-free processes underlying ridge-slough pattern formation.
Interestingly, patch complexity in the real ridge-slough landscapes revealed non-fractal nature (non-linear perimeter-area scaling, Casey et al., 2015). Since the
sim-25
HESSD
12, 1247–1277, 2015Landscape geometry in a patterned
peatland
S. Acharya et al.
Title Page
Abstract Introduction
Conclusions References
Tables Figures
◭ ◮
◭ ◮
Back Close
Full Screen / Esc
Printer-friendly Version Interactive Discussion
Discussion
P
a
per
|
Discussion
P
a
per
|
Discussion
P
a
per
|
Discussion
P
a
per
|
Everglades, were fractals. However, their landscapes were analyzed at significantly coarser scale (40 m pixel) as opposed to 10 m pixel in this study, which is likely to miss the finer scale crenulations in patch-edges that increase the complexity.
The ridge-slough landscape is often described as exhibiting a repeating geostatisti-cal pattern with a wavelength of 50–400 m in the direction orthogonal to flow (Larsen
5
and Harvey, 2010; Lago et al., 2010; Cheng et al., 2010; Cohen et al., 2011). Spa-tial periodicity in patterned ecosystems has been attributed to the interplay between positive and negative feedbacks acting at different spatial scales. Short-range facili-tation causes vegefacili-tation aggregation in dense clusters, but patch expansion is inhib-ited by some intermediate-range negative force acting at a specific distance. In this
10
way, vegetation self-organizes into a periodic configuration (Rietkerk and van de Kop-pel, 2008; von Hardenberg et al., 2010). Accordingly, the models presented by Ross et al. (2006) and Cheng et al. (2010) generate highly uniform, elongated patches that possess a clear periodicity. Surprisingly, however, the observed ridge and slough land-scape appears to lack periodic spatial structure (Fig. 5c; Casey et al., 2015) suggesting
15
there is no characteristic wavelength to the landscape. Even more surprising is that this aperiodic behavior is retained across a wide gradient of hydrologic modification. It is therefore notable that the model presented here lacks periodic spatial structure. The lack of landscape periodicity argues strongly against invocation of intermediate-range negative feedbacks. The observed pattern is more consistent with a global negative
20
feedback that inhibits patch expansion across the entire landscape.
4.3 Mechanisms of anisotropy
Mechanisms of local facilitation in patterned landscapes are generally attributable to more than one biotic/abiotic factor, which can be difficult to measure or determine at landscape scales (Cohen et al., 2011). Our model yields novel insights about the role of
25
HESSD
12, 1247–1277, 2015Landscape geometry in a patterned
peatland
S. Acharya et al.
Title Page
Abstract Introduction
Conclusions References
Tables Figures
◭ ◮
◭ ◮
Back Close
Full Screen / Esc
Printer-friendly Version Interactive Discussion
Discussion
P
a
per
|
Discussion
P
a
per
|
Discussion
P
a
per
|
Discussion
P
a
per
|
the combination of global inhibition and anisotropic local facilitation, the mechanisms that induce anisotropic facilitation remain unclear. Several potential mechanisms exist. Flow may enable directional seed dispersal (i.e., hydrochory; Nilsson et al., 2010) par-ticularly for sawgrass. Crucially, however, despite prolific seed production, most saw-grass reproduction is vegetative (Miao et al., 1998). Local anisotropic facilitation may
5
also arise from sediment entrainment and deposition (Larsen et al., 2007), though we note that the invoked flow velocity effects to date have focused on inhibitory feedbacks (i.e., constraints on patch expansion) not local facilitation effects. However, if deposition occurs preferentially downstream (e.g., at the tails of ridges) rather than at ridge edges, the cumulative effect would be anisotropic facilitation. Another mechanism posits lower
10
phosphorus uptake efficiency in ridges than in sloughs, leading to longer uptake lengths (sensu Newbold et al., 1981), and thus further downstream transport of availableP in ridges. While this mechanism remains untested, it comports with observations of sub-stantialP enrichment in ridge soils compared with adjacent sloughs (Ross et al., 2006; Bruland et al., 2010; Cheng et al., 2010) and could yield a directional stimulatory effect
15
on sawgrass primary production.
While determining the mechanism that controls local facilitation effects is clearly crit-ical for successfully protecting and restoring landscape pattern, our work suggests that processes driving ridge-slough pattern development and maintenance may be rep-resented by a generalized local facilitation function and a global inhibitory feedback,
20
potentially signifying a unifying explanation of ridge-slough pattern development. The model results presented herein provide the first test of ridge-slough simulations against a suite of expanded landscape-scale statistical and geostatistical properties, several of which strongly support inference of a dominant role for global feedbacks between pat-tern and hydroperiod in structuring this sentinel landscape.
25
HESSD
12, 1247–1277, 2015Landscape geometry in a patterned
peatland
S. Acharya et al.
Title Page
Abstract Introduction
Conclusions References
Tables Figures
◭ ◮
◭ ◮
Back Close
Full Screen / Esc
Printer-friendly Version Interactive Discussion
Discussion
P
a
per
|
Discussion
P
a
per
|
Discussion
P
a
per
|
Discussion
P
a
per
|
References
Bernhardt, C. and Willard, D.: Response of the Everglades ridge and slough landscape to climate variability and 20th century water management, Ecol. Appl., 19, 1723–1738, doi:10.1890/08-0779.1, 2009.
Casey, S. C., Cohen, M. J., Acharya, S., Kaplan, D. A., and Jawitz, J. W.: On the Spatial
Organi-5
zation of the Everglades Ridge Slough Patterned Landscape, Landscape Ecology, in review, 2015.
Cheng, Y., Stieglitz, M., Turk, G., and Engel, V.: Effects of anisotropy on pattern formation in wetland ecosystems, Geophys. Res. Lett., 38, L04402, doi:10.1029/2010GL046091, 2011. Clauset, A., Shalizi, C. R., and Newman, M. E.: Power-law distributions in empirical data, SIAM
10
Rev., 51, 661–703, 2009.
Cohen, M. J., Watts, D. L., Heffernan, J. B., and Osborne, T. Z.: Reciprocal biotic control on hydrology, nutrient gradients and landform in the Greater Everglades, Crit. Rev. Env. Sci. Tec., 41, 395–429, doi:10.1080/10643389.2010.531224, 2011.
Couteron, P. and Lejeune, O.: Periodic spotted patterns in semi-arid vegetation explained by
15
a propagation inhibition model, J. Ecol., 89, 616–628, 2001.
Deutsch, C. V. and Journel, A. G.: GSLIB: Geostatistical Software Library and User’s Guide, Oxford University Press, New York, 1998.
D’Odorico, P., Engel, V. Carr, J. A., Oberbauer, S. F., Ross, M. S., and Sah, J. P.: Tree-grass coexistence in the Everglades freshwater system, Ecosystems, 14, 298–310,
20
doi:10.1007/s10021-011-9412-3, 2011.
Dyskin, A. V.: Self-similar pattern formation and continuous mechanics of self-similar systems, Hydrol. Earth Syst. Sci., 11, 665–676, doi:10.5194/hess-11-665-2007, 2007.
Eppinga, M. B., Rietkerk, M., Wassen, M. J., and De Reuiter, P. C.: Linking habitat mod-ification to catastrophic shifts and vegetation patterns in bogs, Plant Ecol., 200, 53–68,
25
doi:10.1007/s11258-007-9309-6, 2009.
Foti, R. and Ramírez, J. A.: A mechanistic description of the formation and evolution of vegeta-tion patterns, Hydrol. Earth Syst. Sci., 17, 63–84, doi:10.5194/hess-17-63-2013, 2013. Foti, R., del Jesus, M., Rinaldo, A., and Rodriguez-Iturbe, I.: Hydroperiod regime controls the
organization of plant species in wetlands, P. Natl. Acad. Sci. USA, 109, 19596–19600, 2012.
30
land-HESSD
12, 1247–1277, 2015Landscape geometry in a patterned
peatland
S. Acharya et al.
Title Page
Abstract Introduction
Conclusions References
Tables Figures
◭ ◮
◭ ◮
Back Close
Full Screen / Esc
Printer-friendly Version Interactive Discussion
Discussion
P
a
per
|
Discussion
P
a
per
|
Discussion
P
a
per
|
Discussion
P
a
per
|
scape drivers, Global Ecol. Biogeogr., 17, 384–402, doi:10.1111/j.1466-8238.2007.00371.x, 2008.
Heffernan, J. B., Watts, D. L., and Cohen, M. J.: Discharge competence and pattern formation in peatlands: a meta-ecosystem model of the Everglades ridge-slough landscape. PLoS ONE, 8, e64174, doi:10.1371/journal.pone.0064174, 2013.
5
Kaplan, D. A., Paudel, R., Cohen, M. J., and Jawitz, J. W.: Orientation matters: patch anisotropy controls discharge competence and hydroperiod in a patterned peatland, Geophys. Res. Lett., 39, L17401, doi:10.1029/2012GL052754, 2012.
Klausmeier, C. A.: Regular and irregular pattern formation in semiarid vegetation, Science, 284, 1826–1828, doi:10.1126/science.284.5421.1826, 1999.
10
Kolasa, J. and Rollo, C. D.: Introduction: The Heterogeneity of Heterogeneity: A Glossary in Ecological Heterogeneity, edited by: Kolasa, J. and Pickett, S. T. A., Springer-Verlag, New York, NY, 1–23, 1991.
Lago, M. E., Miralles-Wilhelm, F., Mahmoudi, M., and Engel, V.: Numerical modeling of the effects of water flow, sediment transport and vegetation growth on the spatiotemporal
pat-15
terning of the ridge and slough landscape of the Everglades wetland, Adv. Water Resour., 33, 1268–1278, doi:10.1016/j.advwatres.2010.07.009, 2010.
Larsen, L. G., Harvey, J. W.: How vegetation and sediment transport feedbacks drive landscape change in the Everglades and wetlands worldwide, Am. Nat., 176, E66–E79,2010.
Larsen, L. G. and Harvey, J. W.: Modeling of hydroecological feedbacks predicts distinct classes
20
of wetland channel pattern and process that influence ecological function and restoration potential, Geomorphology, 126, 279–296, 2011.
Larsen, L. G. and Harvey, J. W, and Crimaldi, J. P.: A delicate balance: ecohydrological feed-backs governing landscape morphology in a lotic peatland, Ecol. Monogr., 77, 591–614, doi:10.1890/06-1267.1, 2007.
25
Mabbutt, J. A. and Fanning, P. C.: Vegetation banding in arid Western Australia, J. Arid Environ., 12, 41–59, 1987.
McVoy, C. W., Said, W. P., Obeysekera, J., Van Arman, J., and Dreschel, T.: Landscapes and Hydrology of the Predrainage Everglades, University Press of Florida, Gainesville, FL, 2012. Miao, S. L., Kong, L., Lorenzen, B., and Johnson, R. R.: Versatile modes of
propaga-30
HESSD
12, 1247–1277, 2015Landscape geometry in a patterned
peatland
S. Acharya et al.
Title Page
Abstract Introduction
Conclusions References
Tables Figures
◭ ◮
◭ ◮
Back Close
Full Screen / Esc
Printer-friendly Version Interactive Discussion
Discussion
P
a
per
|
Discussion
P
a
per
|
Discussion
P
a
per
|
Discussion
P
a
per
|
Nungesser, M. K.: Reading the landscape: temporal and spatial changes in a patterned peat-land, Wetl. Ecol. Manag., 19, 475–493, 2011.
Palmer, M. A. and Poff, N. L.: The influence of environmental heterogeneity on patterns and processes in streams, J. N. Am. Benthol. Soc., 16, 169–173, 1997.
Rietkerk, M. and Van de Koppel, J.: Regular pattern formation in real ecosystems, Trends. Ecol.
5
Evol., 23, 169–175, doi:10.1016/j.tree.2007.10.013, 2008.
Ross, M. S., Mitchell-Bruker, S., Sah, J. P. Stothoff, S., Ruiz, P. L., Reed, D. L., Jay-achandran, K., and Coultas, C. L.: Interaction of hydrology and nutrient limitation in the ridge and slough landscape of the southern Everglades, Hydrobiologia, 569, 37–59, doi:10.1007/s10750-006-0121-4, 2004.
10
Saco, P. M., Willgoose, G. R., and Hancock, G. R.: Eco-geomorphology of banded vege-tation patterns in arid and semi-arid regions, Hydrol. Earth Syst. Sci., 11, 1717–1730, doi:10.5194/hess-11-1717-2007, 2007.
Scanlon, T. M., Caylor, K. K., Levin, S. A, and Rodriguez-Iturbe, I.: Positive feedbacks promote power-law clustering of Kalahari vegetation, Nature, 449, 209–212, 2007.
15
Schaffranek, R. W.: Simulation of surface-water integrated flow and transport in two dimensions: SWIFT2D user’s manual, US Geological Survey, Reston, Virginia, USA, Book 6, 2004. Science Coordination Team: The Role of Flow in the Everglades Ridge and Sslough
Land-scape, South Florida Ecosystem Restoration Working Group, Miami, FL, 2003.
von Hardenberg, J., Kletter, A. Y., Yizhaq, H. Nathan, J., and Meron, E.: Periodic vs.
20
scale-free patterns in dryland vegetation, P. Roy. Soc. B–Biol. Sci., 277, 1771–1776, doi:10.1098/rspb.2009.2208, 2010.
Watts, D. L., Cohen, M. J., Heffernan, J. B., and Osborn, T. Z.: Hydrologic modification and the loss of self-organized patterning in the ridge slough mosaic of the Everglades, Ecosystems, 13, 813–827, doi:10.1007/s10021-010-9356-z, 2010.
25
HESSD
12, 1247–1277, 2015Landscape geometry in a patterned
peatland
S. Acharya et al.
Title Page
Abstract Introduction
Conclusions References
Tables Figures
◭ ◮
◭ ◮
Back Close
Full Screen / Esc
Printer-friendly Version Interactive Discussion
Discussion
P
a
per
|
Discussion
P
a
per
|
Discussion
P
a
per
|
Discussion
P
a
per
|
Figure 1. (a) Example reference ridge (black) and slough (blue) landscape; (b) third-order polynomial surface of hydroperiod (HP) vs. anisotropy (e) and ridge patch density (%R) (R2=
HESSD
12, 1247–1277, 2015Landscape geometry in a patterned
peatland
S. Acharya et al.
Title Page
Abstract Introduction
Conclusions References
Tables Figures
◭ ◮
◭ ◮
Back Close
Full Screen / Esc
Printer-friendly Version Interactive Discussion
Discussion
P
a
per
|
Discussion
P
a
per
|
Discussion
P
a
per
|
Discussion
P
a
per
|
Figure 4. (a)Example reference and simulated landscapes (black =ridge; blue=slough) for
ky=0.2 andkx:ky =1, 2, 2.5, and 3.5,(b)indicator semivariograms (blue=East–West; green
HESSD
12, 1247–1277, 2015Landscape geometry in a patterned
peatland
S. Acharya et al.
Title Page
Abstract Introduction
Conclusions References
Tables Figures
◭ ◮
◭ ◮
Back Close
Full Screen / Esc
Printer-friendly Version Interactive Discussion
Discussion
P
a
per
|
Discussion
P
a
per
|
Discussion
P
a
per
|
Discussion
P
a
per
|