Clinical factors of post-chemoradiotherapy as valuable
indicators for pathological complete response in locally
advanced rectal cancer
Jianhong Peng,I,#Junzhong Lin,I,#Miaozhen Qiu,IIXiaojun Wu,I Zhenhai Lu,IGong Chen,ILiren Li,I Peirong Ding,IYuanhong Gao,IIIZhifan Zeng,III Huizhong Zhang,IVDesen Wan,IZhizhong PanI,*
Sun Yat-sen University Cancer Center, State Key Laboratory of Oncology in South China, Collaborative Innovation Center of Cancer Medicine,IDepartment of Colorectal Surgery,IIDepartment of Medical Oncology,IIIDepartment of Radiation Onology,IVDepartment of Pathology, Guangzhou, P.R. China.
OBJECTIVES:Pathological complete response has shown a better prognosis for patients with locally advanced rectal cancer after preoperative chemoradiotherapy. However, correlations between post-chemoradiotherapy clinical factors and pathologic complete response are not well confirmed. The aim of the current study was to identify post-chemoradiotherapy clinical factors that could serve as indicators of pathologic complete response in locally advanced rectal cancer.
METHODS:This study retrospectively analyzed 544 consecutive patients with locally advanced rectal cancer treated at Sun Yat-sen University Cancer Center from December 2003 to June 2014. All patients received preoperative chemoradiotherapy followed by surgery. Univariate and multivariate regression analyses were performed to identify post-chemoradiotherapy clinical factors that are significant indicators of pathologic complete response.
RESULTS:In this study, 126 of 544 patients (23.2%) achieved pathological complete response. In multivariate analyses, increased pathological complete response rate was significantly associated with the following factors: post-chemoradiotherapy clinical T stage 0-2 (odds ratio=2.098, 95% confidence interval=1.023-4.304,p=0.043), post-chemoradiotherapy clinical N stage 0 (odds ratio=2.011, 95% confidence interval=1.264-3.201,p=0.003), interval from completion of preoperative chemoradiotherapy to surgery of47 weeks (odds ratio=1.795, 95%
confidence interval=1.151-2.801,p=0.010) and post-chemoradiotherapy carcinoembryonic antigenp2 ng/ml
(odds ratio=1.579, 95% confidence interval=1.026-2.432,p=0.038).
CONCLUSIONS:Post-chemoradiotherapy clinical T stage 0-2, post-chemoradiotherapy clinical N stage 0, interval
from completion of chemoradiotherapy to surgery of 47 weeks and post-chemoradiotherapy
carcino-embryonic antigenp2 ng/ml were independent clinical indicators for pathological complete response. These
findings demonstrate that post-chemoradiotherapy clinical factors could be valuable for post-operative assessment of pathological complete response.
KEYWORDS: Rectal Cancer; Pathological Complete Response; Preoperative Chemoradiotherapy; Prediction.
Peng J, Lin J, Qiu M, Wu X, Lu Z, Chen G, et al. Clinical factors of post-chemoradiotherapy as valuable indicators for pathological complete response in locally advanced rectal cancer. Clinics. 2016;71(8):449-454
Received for publication onJanuary 21, 2016;First review completed onMarch 9, 2016;Accepted for publication onApril 26, 2016
*Corresponding author. E-mail: [email protected] #contributed equally to the study.
’ INTRODUCTION
Currently, preoperative chemoradiotherapy (CRT) fol-lowed by total mesorectal excision (TME) is the standard treatment for patients with locally advanced rectal cancer (LARC) to improve local disease control and sphincter
preservation rate (1,2). Following preoperative chemother-apy, variable responses have been observed among indivi-duals, with a range of 12% to 40% of cases achieving pathological complete response (pCR) (3-5). Patients achiev-ing pCR after CRT have a lower incidence of recurrence and more favorable long-term survival than those without pCR (6,7). Additionally, due to the associated relatively long-term survival, tumor complete response allows the adoption of a
‘‘wait-and-see’’policy for patients undergoing neoadjuvant CRT instead of necessitating immediate surgery (8,9). There-fore, it is of considerable clinical importance to identify significant factors that can successfully predict pCR after preoperative CRT. Although many techniques have been applied towards this goal, correlations between post-CRT
DOI:10.6061/clinics/2016(08)07
Copyright&2016CLINICS–This is an Open Access article distributed under the terms of the Creative Commons License (http://creativecommons.org/licenses/by/ 4.0/) which permits unrestricted use, distribution, and reproduction in any medium or format, provided the original work is properly cited.
clinical factors and pCR are seldom reported and remain poorly defined (10). To identify significant post-CRT clinical factors associated with pCR, we conducted the current study using a large cohort of patients undergoing CRT and surgery at a single center.
’ PATIENTS AND METHODS
Patient selection
This study included a total of 577 consecutive patients with rectal cancer who underwent preoperative CRT followed by surgery from December 2003 through June 2014 at Sun Yat-sen University Cancer Center, China. The following inclusion criteria were applied: (1) histologically confirmed rectal adenocarcinoma; (2) cT3-4 or N+disease before CRT; (3) no other anti-tumor therapy was received before CRT; and (4) no distant metastatic disease. Thirty-one patients were excluded from this study due to distant metastatic disease before CRT and an additional two patients who were confirmed to have adenosquamous carcinoma were also eliminated. This left a total of 544 individuals who were included for analysis. The detailed clinical data of the eligible patients were reviewed using our electronic medical record system. Prior to CRT and surgery, informed consent was obtained from each patient. The study was undertaken in accordance with the ethical standards of the World Medical Association Declaration of Helsinki and study approval was obtained from independent ethics committees at Sun Yat-Sen University Cancer Center.
Treatment
All of the subjects underwent preoperative CRT. Radiation therapy (RT) was administered via three-dimensional con-formal radiation therapy (3D-CRT) or intensity-modulated radiation therapy (IMRT). The patients were scheduled to receive a total irradiation dose of 46.0-50.4 Gy to the pelvic area, delivered in 1.8-2.0 Gy fractions daily on five consecutive days per week for 5-6 weeks. If a patient could not tolerate the full dose or suffered from severe toxic effects, the RT was stopped. Patients who were reluctant to undergo surgery were delivered a radical dose of RT.
One of the following chemotherapeutic regimens was delivered concurrently with the RT: (1) XELOX regimen consisting of 130 mg/m2 oxaliplatin administered
intrave-nously on day 1 and 1,000 mg/m2capecitabine administered orally twice daily on days 1-14 for a 3-week cycle; (2) FOLFOX regimen consisting of 85 mg/m2 oxaliplatin
and 400 mg/m2leucovorin administered intravenously over 2 hours on day 1, 400 mg/m25-FU administered intravenously on day 1 and 1200 mg/m25-FU administered intravenously
for 2 days for a 2-week cycle; or (3) 825 mg/m2capecitabine administered orally twice daily during RT without weekend breaks.
All subjects were scheduled for radical resection 6–8 weeks
after the completion of preoperative CRT. If bowel obstruc-tion or perforaobstruc-tion occurred after CRT, emergent surgery was performed immediately. Surgery was delayed in the event of grade 3 or 4 toxicity. The surgical procedure used depended on tumor location and invasive extent; TME was performed whenever possible.
Evaluation
Post-CRT clinical evaluation was performed at the 6thweek after completion of CRT and included a combina-tion of physical examinacombina-tion, post-CRT carcinoembryonic
antigen (CEA) test, colonoscopy, transrectal ultrasonography (EUS), chest computed tomography (CT) and abdominal and pelvic nuclear magnetic resonance (MRI). Disease stage was classified according to the 2010 American Joint Committee on Cancer/International Union Against Cancer (AJCC/ UICC) staging system. According to EUS images, post-CRT clinical (yc) T stage 0 was defined as no tumor signs in the bowel wall; ycT stage 1 was defined as a tumor signal confined to the submucosa; and ycT stage 2 was defined as a malignancy that had invaded the muscularis propria. Using MR images, ycN stage 0 was defined as the absence of metastatic lymph nodes; ycN stage 1 and ycN stage 2 were respectively defined as the presence of 1-3 and43 metastatic lymph nodes, which appeared irregular in shape, showed enhancement and possessed a diameter45 mm; ycT stage 3 was defined as a malignancy that broke through the muscularis propria; and ycT stage 4 was defined as a tumor that had invaded adjacent organs. All radiological reports were confirmed by two independent radiologists. Post-operative final tumor pathological staging was also eval-uated by two independent pathologists. pCR was defined as the absence of viable tumor cells, with only fibrotic masses or acellular mucin pools present in proximity to the primary tumor and lymph nodes (11). Patients confirmed as having achieved pCR were classified as the pCR cohort, while the remaining patients formed the non-pCR cohort.
Statistical analysis
Data were analyzed using SPSS version 17.0 (Chicago, IL, USA). Continuous variables were shown as the median (range) or the mean (standard deviation) and categorical variables were presented as percentages. All continuous and polytomous variables were dichotomized by a cut-point prior to univariate and multivariate analyses. Univariate comparisons of factors were performed using the chi square test or Fisher’s exact test for categorical variables and an unpaired t-test for continuous variables. Factors with statistical significance in univariate analyses were included in multi-variate analyses. Multimulti-variate analyses were performed using logistic regression to identify significant post-CRT clinical indicators and therapeutic factors for pCR. All tests were two-tailed andpo0.05 was considered statistically significant.
’ RESULT
Clinical demographics
A total of 544 patents, 361 men (66.4%) and 183 women (33.6%) were enrolled. The median patient age was 55 years (range 12-81 years). Before CRT, 170 patients (31.1%) presented clinical stage II disease and 374 (68.7%) presented clinical stage III disease. The clinical demographics and treatment results are presented in Table 1. The median radiation dose was 50 Gy (range 30–70 Gy). Regarding the
concurrent chemotherapy, 473 (87.0%) patients received the XELOX regimen, while 49 (9.0%) patients received the FOLFOX regimen, and 22 (4.0%) were given oral capecitabine alone. After CRT, the median distance of the inferior tumor margin from the anal verge (DAV) was 5 cm (range 0–15 cm)
and the median interval from completion of CRT to surgery was 51 days (range 7–78 days). All patients underwent
received palliative colostomy. After the comprehensive treat-ment, 126 patients (23.2%) obtained pCR. The general clinical parameters, including age, gender, pre- and post-CRT DAV, pre- and post-CRT body mass index (BMI), pre-CRT clinical tumor-node-metastasis (TNM) stage, surgical procedure, radiation pattern and chemotherapy regimens, were compar-able between the pCR cohort and the non-pCR cohort. Radiation dose (p=0.041), yc T stage (p=0.002), yc N stage (p=0.002), ycTNM stage (p=0.001), tumor differentiation (p=0.001), median interval from completion of CRT to surgery
(p=0.007) and post-CRT CEA level (p=0.011) were significantly different between the two groups.
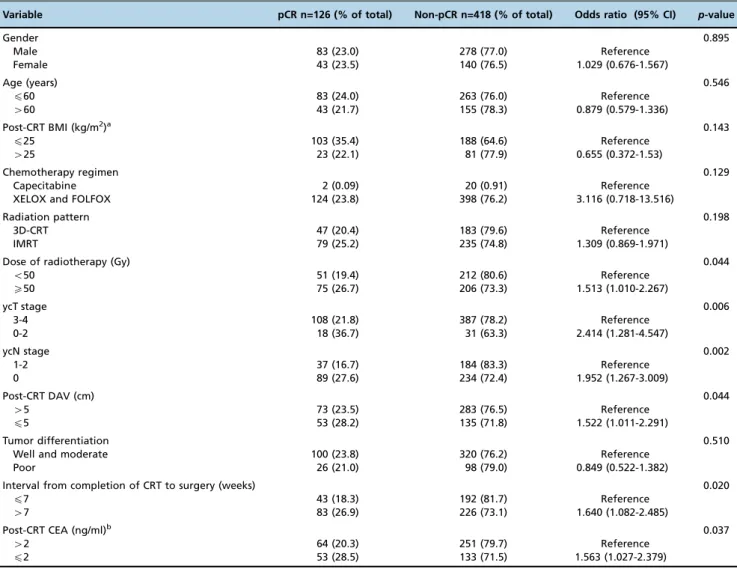
Post-CRT clinical indicators for pCR
The cut-off values for post-CRT CEA, DAV and interval from the completion of CRT to surgery were set according to the median values. In the univariate analyses, the potential post-CRT clinical indicators included ycT stage, ycN stage, post-CRT DAV, interval from completion of CRT to surgery, Table 1-Demographics of patients who underwent preoperative chemoradiotherapy followed by surgery and their tumor characteristics (n=544).
Variable Total (n=544,%) pCR (n=126,%) Non-pCR (n=418,%) p-value
Gender 0.895
Male 361 (66.4) 83 (65.9) 278 (66.5)
Female 183 (33.6) 43 (34.1) 140 (33.5)
Age (years)a 55 (12-81) 55 (30-75) 55 (12-81) 0.546
Pre-CRT BMI (kg/m2)b 22.3±3.1 22.4±2.8 22.3±3.2 0.861
Pre-CRT DAV (cm)a 5 (0-15) 5 (1-12) 5 (0-15) 0.442
Tumor differentiation 0.001
Well 50 (9.2) 30 (23.8) 20 (4.8)
Moderate 370 (68.0) 70 (55.6) 300 (71.8)
Poor 124 (22.8) 26 (20.6) 98 (23.4)
cTNM stage 0.147
II 170 (31.2) 46 (36.5) 124 (29.7)
III 374 (68.8) 80 (63.5) 294 (70.3)
Chemotherapy regimen 0.228
XELOX 473 (87.0) 120 (95.2) 353 (84.4)
FOLFOX 49 (9.0) 4 (3.2) 45 (10.8)
Capecitabine 22 (4.0) 2 (1.6) 20 (4.8)
Radiation dose (Gy) 50 (30-70) 50 (30-50) 46 (30-70) 0.041
Radiation pattern 0.198
3D-CRT 230 (42.3) 47 (37.3) 183 (43.8)
IMRT 314 (57.7) 79 (62.7) 235 (56.2)
Post-CRT BMI (kg/m2)b 22.1±3.4 22.1±2.9 22.1±3.4 0.937
ycT stage 0.002
0 6 (1.1) 6 (4.8) 0
1 7 (1.3) 2 (1.6) 5 (1.2)
2 36 (6.6) 10 (7.9) 26 (6.2)
3 334 (61.4) 81 (64.3) 253 (60.5)
4 161 (29.6) 27 (21.4) 134 (32.0)
ycN stage 0.002
0 323 (59.4) 89 (70.6) 234 (56.0)
1 209 (38.4) 35 (27.8) 174 (41.6)
2 12 (2.2) 2 (1.6) 10 (2.4)
ycTNM stage 0.001
0 6 (1.1) 6 (4.8) 0
I 35 (6.4) 8 (6.3) 27 (6.5)
II 276 (50.7) 74 (58.7) 202 (48.3)
III 214 (39.3) 37 (29.4) 177 (42.3)
IV 13 (2.4) 1 (0.8) 12 (2.9)
Post-CRT DAV (cm)a 5 (0-15) 5 (1-12) 5 (0-15) 0.157
Post-CRT CEA (ng/ml)a 2.4 (0.38-387.9) 2.1 (0.4-11.7) 2.5 (0.38-387.9) 0.011 Interval from completion of CRT to surgery (weeks)a 7 (1-12) 8 (5-12) 7 (1-12) 0.007
Surgical procedure 0.506
Anterior resection 318 (58.5) 81 (64.3) 237 (56.7)
Abdominal perineal resection 196 (36.0) 44 (34.9) 152 (36.4)
Hartmann procedure 14 (2.6) 1 (0.8) 13 (3.1)
Palliative colostomy 16 (2.9) 0 16 (3.8)
BMI: body mass index, DAV: distance of inferior tumor margin from the anal verge, CEA: carcinoembryonic antigen, pCR: pathologic complete response, cTNM stage: clinical tumor-node-metastasis classification, ycT stage: clinical tumor stage after chemoradiotherapy, ycN stage: clinical node stage after chemoradiotherapy, ycTNM stage: clinical tumor-node-metastasis classification after chemoradiotherapy, 3D-CRT: three-dimensional conformal radiation therapy, IMRT: intensity-modulated radiation therapy, CRT: chemoradiotherapy
aThese values are presented as the median followed by the range in parentheses.
radiation dose and post-CRT CEA level (Table 2). The multivariate logistic regression analyses indicated that ycT stage 0-2 [odds ratio (OR)=2.098, 95% confidence interval (CI) =1.023-4.304,p=0.043], ycN stage 0 (OR=2.011, 95%
CI=1.264-3.201,p=0.003), interval from completion of CRT to surgery of 47 weeks (OR=1.795, 95%CI=1.151-2.801,p=0.010) and post-CRT CEAp2 ng/ml (OR=1.579, 95%CI=1.026-2.432,p=0.038) were independent factors for increased pCR (Table 3). Table 2-Univariate analyses of indicators for pathological complete response to preoperative chemoradiotherapy in locally advanced rectal cancer.
Variable pCR n=126 (% of total) Non-pCR n=418 (% of total) Odds ratio (95% CI) p-value
Gender 0.895
Male 83 (23.0) 278 (77.0) Reference
Female 43 (23.5) 140 (76.5) 1.029 (0.676-1.567)
Age (years) 0.546
p60 83 (24.0) 263 (76.0) Reference
460 43 (21.7) 155 (78.3) 0.879 (0.579-1.336)
Post-CRT BMI (kg/m2)a 0.143
p25 103 (35.4) 188 (64.6) Reference
425 23 (22.1) 81 (77.9) 0.655 (0.372-1.53)
Chemotherapy regimen 0.129
Capecitabine 2 (0.09) 20 (0.91) Reference
XELOX and FOLFOX 124 (23.8) 398 (76.2) 3.116 (0.718-13.516)
Radiation pattern 0.198
3D-CRT 47 (20.4) 183 (79.6) Reference
IMRT 79 (25.2) 235 (74.8) 1.309 (0.869-1.971)
Dose of radiotherapy (Gy) 0.044
o50 51 (19.4) 212 (80.6) Reference
X50 75 (26.7) 206 (73.3) 1.513 (1.010-2.267)
ycT stage 0.006
3-4 108 (21.8) 387 (78.2) Reference
0-2 18 (36.7) 31 (63.3) 2.414 (1.281-4.547)
ycN stage 0.002
1-2 37 (16.7) 184 (83.3) Reference
0 89 (27.6) 234 (72.4) 1.952 (1.267-3.009)
Post-CRT DAV (cm) 0.044
45 73 (23.5) 283 (76.5) Reference
p5 53 (28.2) 135 (71.8) 1.522 (1.011-2.291)
Tumor differentiation 0.510
Well and moderate 100 (23.8) 320 (76.2) Reference
Poor 26 (21.0) 98 (79.0) 0.849 (0.522-1.382)
Interval from completion of CRT to surgery (weeks) 0.020
p7 43 (18.3) 192 (81.7) Reference
47 83 (26.9) 226 (73.1) 1.640 (1.082-2.485)
Post-CRT CEA (ng/ml)b 0.037
42 64 (20.3) 251 (79.7) Reference
p2 53 (28.5) 133 (71.5) 1.563 (1.027-2.379)
CI: confidence interval, BMI: body mass index, DAV: distance of inferior tumor margin from the anal verge, CEA: carcinoembryonic antigen, pCR: pathologic complete response, ycT stage: clinical tumor stage after chemoradiotherapy, ycN stage: clinical node stage after chemoradiotherapy, 3D-CRT: three-dimensional conformal radiation therapy, IMRT: intensity-modulated radiation therapy, CRT: chemoradiotherapy
aThere were only 395 patients with complete data for post-CRT BMI. bThere were only 501 patients with complete data for post-CRT CEA.
Table 3-Multivariate analyses of indicators for pathological complete response to preoperative chemoradiotherapy in locally advanced rectal cancer.
Variable p-value Odds ratio 95% CI of odds ratio
ycT stage 0-2 0.043 2.098 1.023-4.304
ycN stage 0 0.003 2.011 1.264-3.201
Interval from completion of CRT to surgery47 weeks 0.010 1.795 1.151-2.801
Post-CRT CEAp2 ng/ml 0.038 1.579 1.026-2.432
Post-CRT DAVp5 cm 0.068 1.508 0.970-2.345
Radiation doseX50 Gy 0.086 1.515 0.942-2.436
’ DISCUSSION
Unlike the majority of previous studies, which have focused on pre-CRT factors that can predict pCR (12,13), the present study evaluated the value of certain post-CRT parameters and treatment variables for predicting pCR. Using univariate and multivariate analyses, we showed that ycT stage 0-2, yc N stage 0, interval from completion of CRT to surgery of47 weeks and post-CRT CEAp2 ng/ml could
be applied to assess pCR post-operatively.
In our study, a favorable pCR rate of 23.2% was achieved, which was comparable to previous reports in which CRT was delivered with fluoropyrimidine-based chemotherapy com-bined with oxaliplatin (4,14,15). To improve pCR rates, several randomized trials have been conducted to integrate oxaliplatin into the currently widely used fluoropyrimidine-based preoperative chemotherapy regimen. The majority of these trials have achieved a favorable pCR rate, ranging from 28% to 40% (5,16). However, another phase III study showed that the addition of oxaliplatin into CRT did not increase pCR: the pCR rate in this study was 13.9% in the capecitabine group compared to 19.2% in the capecitabine plus oxaliplatin group (p=0.09) (17). To the best of our knowledge, drug dose, patient tolerance during treatment and administration schedule all influence the achievement of pCR. A better understanding of chemotherapy schedule as well as the features of specific cohorts of patients might contribute to increase pCR after CRT.
CEA is not only a prognostic factor but also a predictor for response to preoperative CRT in LARC (18). Pretreatment CEA level has been demonstrated as a useful marker for pCR following preoperative CRT (13,19). However, few studies have evaluated the value of post-CRT CEA level in assessing pCR following preoperative CRT. Yang et al. evaluated the association of CEA level and pCR rate in 138 patients treated with preoperative CRT and found that a post-CRT CEA level
o2.61 ng/ml could indicate pCR postoperatively (OR=0.605,
95%CI=0.412-0.890,p=0.011)(20). Kleiman et al. showed that post-CRT CEA levels were significantly lower in patients with pCR (1.7vs. 2.4mg/L,po0.01), indicating the
normal-ization of CEA levels post-CRT was a useful predictor of pCR in LARC (21). In our current study, a post-CRT CEA level p2 ng/ml was significantly associated with a higher
pCR rate (28.5% vs. 20.3%, p=0.037). Although the exact mechanism is unclear, we suppose that the lower post-CRT CEA level implies a lower tumor burden and, subsequently, less residual tumor in the rectum after CRT.
Several retrospective studies have emphasized the role of a longer interval between CRT and surgery in achieving a histological tumor response (22,23). Our study showed that an interval of 47 weeks between completion of CRT and surgical resection significantly increased pCR rate (26.9%vs. 18.3%,p=0.02). A previous study also reported that an interval 47 weeks could improve pCR after assessing 132 patients with LARC (35% vs. 17%, p=0.03) (24). Recently, a large retrospective study evaluating 17,255 patients from the National Cancer Data Base in America indicated that an interval greater than 8 weeks was associated with higher odds of pCR (OR=1.12, 95% CI=1.01-1.25, p=0.040) (25). However, the optimal timing for surgery after neoadjuvant CRT in LARC remains controversial. Stein et al. suggested that there was no incremental benefit from delaying surgery after CRT for tumor regression (26). To settle this issue, a prospective randomized
trial named GRECCAR-6 was designed and the final result aims to identify the optimal interval for delivering pCR (27).
It is well known that TNM system category is closely associated with the prognosis of colorectal cancer. Some previous studies have found that pretreatment clinical N stage is an independent clinical predictor for achieving pCR (12,28). To date, few studies have assessed whether post-CRT TNM stage could be used to predict tumor response to CRT (13,29). To identify useful predictors for pCR, a recent study screened yc T stage (po0.001) and
yc N stage (po0.001) as predictors of pCR after CRT (30).
After assessing post-CRT clinical parameters, we found similar results, namely, that ycT stage 0-2 (OR=2.098, 95% CI=1.023-4.304, p=0.043) and ycN stage 0 (OR=2.011, 95% CI=1.264-3.201,p=0.003) are both independent indicators for pCR. To the best of our knowledge, lower clinical T and N stages are associated with less tumor burden in primary organs and lymph nodes. Further studies should be conducted to confirm the authentic values of ycT stage and ycN stage as indicators of pCR.
We would like to acknowledge several limitations in the present study. The first limitation is the retrospective methodology from a single-institution experience. Addition-ally, some post-CRT variables, including tumor gross change, circumferential extent of tumor and clinical stage shift after CRT, could not be fully evaluated. Furthermore, the patients included in our study were treated over a course of 11 years. This is a long time and CRT regimens and methods of pathologic assessment have changed in this period. How-ever, even when considering the above limitations, our study identified several post-CRT indicators for pCR. External validation using another large database or prospective clinical studies would be of value. Based on our results, individualized therapy can be tailored for patients after CRT. For instance, patients with lower rectal cancer who are confirmed as complete responders to preoperative CRT may choose a wait-and-see policy with avoidance of abdominal perineal resection, as such patients may not achieve sufficient benefit from surgery. On the contrary, patients who fail to achieve a good response tend to have a poor prognosis and consequently need more intensive treatments or the applica-tion of novel therapies to minimize the possibility for local and distant recurrences.
This large, retrospective study identified post-CRT clinical parameters of considerable value as indicators for pCR. Post-CRT clinical (yc) T stage 0-2, ycN stage 0, an interval from the completion of CRT to surgery of47 weeks and post-CRT CEAp2 ng/ml could be useful for predicting pCR. These
indicators may help clinicians evaluate the efficiency of preoperative CRT and formulate individualized treatment strategies before surgery.
’ ACKNOWLEDGMENTS
We thank all the staff engaged in this study, especially those at the Department of Colorectal Surgery at the Sun Yat-sen University Cancer Center.
’ AUTHOR CONTRIBUTIONS
’ REFERENCES
1. Bosset J-F, Collette L, Calais G, Mineur L, Maingon P, Radosevic-Jelic L, et al. Chemotherapy with Preoperative Radiotherapy in Rectal Cancer. N Engl J Med. 2006;355(11):1114-23, http://dx.doi.org/10.1056/NEJMoa060829. 2. Sauer R, Becker H, Hohenberger W, Rodel C, Wittekind C, Fietkau R, et al.
Preoperative versus postoperative chemoradiotherapy for rectal cancer. N Engl J Med. 2004;351(17):1731-40, http://dx.doi.org/10.1056/NEJMoa 040694.
3. Zhao L, Bai C, Shao Y, Guan M, Jia N, Xiao Y, et al. A phase II study of neoadjuvant chemoradiotherapy with oxaliplatin and capecitabine for rectal cancer. Cancer Lett. 2011;310(2):134-9, http://dx.doi.org/10.1016/ j.canlet.2011.06.026.
4. Koeberle D, Burkhard R, von Moos R, Winterhalder R, Hess V, Heitzmann F, et al. Phase II study of capecitabine and oxaliplatin given prior to and concurrently with preoperative pelvic radiotherapy in patients with locally advanced rectal cancer. Br J Cancer. 2008;98(7):1204-9, http://dx. doi.org/10.1038/sj.bjc.6604297.
5. Aschele C, Friso ML, Pucciarelli S, Lonardi S, Sartor L, Fabris G, et al. A phase I–II study of weekly oxaliplatin, 5-fluorouracil continuous infusion
and preoperative radiotherapy in locally advanced rectal cancer. AnnOn-col. 2005;16(7):1140-6, http://dx.doi.org/10.1093/annonc/mdi212. 6. Maas M, Nelemans PJ, Valentini V, Das P, Rodel C, Kuo LJ, et al.
Long-term outcome in patients with a pathological complete response after chemoradiation for rectal cancer: a pooled analysis of individual patient data. Lancet Oncol. 2010;11(9):835-44, http://dx.doi.org/10.1016/S1470-2045(10)70172-8.
7. Park IJ, You YN, Agarwal A, Skibber JM, Rodriguez-Bigas MA, Eng C, et al. Neoadjuvant treatment response as an early response indicator for patients with rectal cancer. J Clin Oncol. 2012;30(15):1770-6, http://dx. doi.org/10.1200/JCO.2011.39.7901.
8. Maas M, Beets-Tan RGH, Lambregts DMJ, Lammering G, Nelemans PJ, Engelen SME, et al. Wait-and-See Policy for Clinical Complete Responders After Chemoradiation for Rectal Cancer. J Clin Oncol. 2011;29(35):4633-40, http://dx.doi.org/10.1200/JCO.2011.37.7176.
9. Habr-Gama A, Sabbaga J, Ribeiro U Jr, Silva e Sousa AH Jr, Campos FG, et al. Operative versus nonoperative treatment for stage 0 distal rectal cancer following chemoradiation therapy: long-term results. Ann Surg. 2004;240(4):711-7.
10. Ryan JE, Warrier SK, Lynch AC, Heriot AG. Assessing pathological com-plete response to neoadjuvant chemoradiotherapy in locally advanced rectal cancer: a systematic review. Colorectal Dis. 2015; 17(10):849-61, http://dx.doi.org/10.1111/codi.13081.
11. Mandard AM, Dalibard F, Mandard JC, Marnay J, Henry-Amar M, Petiot JF, et al. Pathologic assessment of tumor regression after pre-operative chemoradiotherapy of esophageal carcinoma. Clinicopathologic correlations. Cancer. 1994;73(11):2680-6, http://dx.doi.org/10.1002/1097-0142(19940601)73:11o2680::AID-CNCR282073110543.0.CO;2-C. 12. Yoon SM, Kim DY, Kim TH, Jung KH, Chang HJ, Koom WS, et al. Clinical
parameters predicting pathologic tumor response after preoperative chemoradiotherapy for rectal cancer. Int J Radiat Oncol. 2007;69(4): 1167-72, http://dx.doi.org/10.1016/j.ijrobp.2007.04.047.
13. Zeng WG, Liang JW, Wang Z, Zhang XM, Hu JJ, Hou HR, et al. Clinical parameters predicting pathologic complete response following neoadju-vant chemoradiotherapy for rectal cancer. Chin J Cancer. 2015;34:41, http://dx.doi.org/10.1186/s40880-015-0033-7.
14. Chua YJ, Barbachano Y, Cunningham D, Oates JR, Brown G, Wotherspoon A, et al. Neoadjuvant capecitabine and oxaliplatin before chemoradiotherapy and total mesorectal excision in MRI-defined poor-risk rectal cancer: a phase 2 trial. Lancet Oncol. 2010;11(3):241-8, http:// dx.doi.org/10.1016/S1470-2045(09)70381-X.
15. Carlomagno C, Farella A, Bucci L, D’Armiento FP, Pesce G, Pepe S, et al. Neo-adjuvant treatment of rectal cancer with capecitabine and oxaliplatin in combination with radiotherapy: a phase II study. Ann Oncol. 2009;20(5):906-12, http://dx.doi.org/10.1093/annonc/mdn719. 16. Chao JY, Wang HM, Chiang FF, Lin JC, Chang CF, Lin JF, et al.
Pre-operative chemoradiotherapy with oxaliplatin and tegafur-uracil in locally advanced rectal cancer: pathologic complete response rate and preliminary results of overall and disease-free survival in a single institute
in Taiwan. J Chin Med Assoc. 2014;77(3):128-32, http://dx.doi.org/ 10.1016/j.jcma.2013.11.008.
17. Gérard JP, Azria D, Gourgou-Bourgade S, Martel-Laffay I, Hennequin C, Etienne PL, et al. Comparison of Two Neoadjuvant Chemoradiotherapy Regimens for Locally Advanced Rectal Cancer: Results of the Phase III Trial ACCORD 12/0405-Prodige 2. J Clin Oncol. 2010;28(10):1638-44, http://dx.doi.org/10.1200/JCO.2009.25.8376.
18. Park JW, Lim S-B, Kim DY, Jung KH, Hong YS, Chang HJ, et al. Carci-noembryonic Antigen as a Predictor of Pathologic Response and a Prog-nostic Factor in Locally Advanced Rectal Cancer Patients Treated With Preoperative Chemoradiotherapy and Surgery. Int J Radiat Oncol. 2009; 74(3):810-7, http://dx.doi.org/10.1016/j.ijrobp.2008.08.057.
19. Lin J, Zeng Z, Wu X, Wan D, Chen G, Li L, et al. Phase II Study of Pre-Operative Radiotherapy with Capecitabine and Oxaliplatin for Rectal Cancer and Carcinoembryonic Antigen as a Predictor of Pathological Tumour Response. J Int Med Res. 2010;38(2):645-54, http://dx.doi.org/ 10.1177/147323001003800227.
20. Yang KL, Yang SH, Liang WY, Kuo YJ, Lin JK, Lin TC, et al. Carci-noembryonic antigen (CEA) level, CEA ratio, and treatment outcome of rectal cancer patients receiving pre-operative chemoradiation and surgery. Radiat Oncol. 2013;8:43, doi: http://dx.doi.org/10.1186/1748-717X-8-43.
21. Kleiman A, Al-Khamis A, Farsi A, Kezouh A, Vuong T, Gordon P, et al. Normalization of CEA Levels Post-Neoadjuvant Therapy is a Strong Pre-dictor of Pathologic Complete Response in Rectal Cancer. J Gastrointest Surg. 2015;19(6):1106-12, http://dx.doi.org/10.1007/s11605-015-2814-3. 22. Moore HG, Gittleman AE, Minsky BD, Wong D, Paty PB, Weiser M, et al.
Rate of pathologic complete response with increased interval between preoperative combined modality therapy and rectal cancer resection. Dis Colon Rectum. 2004;47(3):279-86, http://dx.doi.org/10.1007/s10350-003-0062-1.
23. de Campos-Lobato LF, Geisler DP, da Luz Moreira A, Stocchi L, Dietz D, Kalady MF. Neoadjuvant therapy for rectal cancer: the impact of longer interval between chemoradiation and surgery. J Gastrointest Surg. 2011; 15(3):444-50, http://dx.doi.org/10.1007/s11605-010-1197-8.
24. Tulchinsky H, Shmueli E, Figer A, Klausner J, Rabau M. An interval
47 weeks between neoadjuvant therapy and surgery improves patholo-gic complete response and disease–free survival in patients with locally
advanced rectal cancer. Ann Surg Oncol. 2008;15(10):2661-7, http://dx. doi.org/10.1245/s10434-008-9892-3.
25. Probst CP, Becerra AZ, Aquina CT, Tejani MA, Wexner SD, Garcia-Aguilar J, et al. Extended Intervals after Neoadjuvant Therapy in Locally Advanced Rectal Cancer: The key to improved tumor response and potential organ preservation. J Am Coll Surgeons. 2015;221(2):430-40, http://dx.doi.org/10.1016/j.jamcollsurg.2015.04.010.
26. Stein DE, Mahmoud NN, Anne PR, Rose DG, Isenberg GA, Goldstein SD, et al. Longer time interval between completion of neoadjuvant chemor-adiation and surgical resection does not improve downstaging of rectal carcinoma. Dis Colon Rectum. 2003;46(4):448-53, http://dx.doi.org/ 10.1007/s10350-004-6579-0.
27. Lefevre JH, Rousseau A, Svrcek M, Parc Y, Simon T, Tiret E, et al. A multicentric randomized controlled trial on the impact of lengthening the interval between neoadjuvant radiochemotherapy and surgery on complete pathological response in rectal cancer (GRECCAR-6 trial): rationale and design. BMC Cancer. 2013;13:417, http://dx.doi.org/ 10.1186/1471-2407-13-417.
28. Garland ML, Vather R, Bunkley N, Pearse M, Bissett IP. Clinical tumour size and nodal status predict pathologic complete response following neoadjuvant chemoradiotherapy for rectal cancer. Int J Colorectal Dis. 2014;29(3):301-7, http://dx.doi.org/10.1007/s00384-013-1821-7.
29. Kalady MF, de Campos-Lobato LF, Stocchi L, Geisler DP, Dietz D, Lavery IC, et al. Predictive factors of pathologic complete response after neoadjuvant chemoradiation for rectal cancer. Ann Surg. 2009;250(4): 582-9, http://dx.doi.org/10.1097/SLA.0b013e3181b91e63.