1Universidade do Minho, Escola de Ciências da Saúde. Braga, Portugal.
2Universidade do Porto, Faculdade de Ciências da Nutrição e Alimentação. R. Dr. Roberto Frias, 4200-465, Porto, Portugal.
Correspondência para/Correspondence to: TMSPF AMARAL. E-mail: <[email protected]>.
Undernutrition and associated factors in
a Portuguese older adult community
Subnutrição e fatores associados em uma
comunidade de idosos Portugueses
Ana Luísa Moreira dos SANTOS1
Teresa Maria de Serpa Pinto Freitas do AMARAL2
Nuno Pedro Garcia Fernandes Bento BORGES2
A B S T R A C T
Objective
To evaluate the prevalence of undernutrition in older adults aged ≥75 years living in communities and to identify the main factors independently associated with undernutrition.
Methods
A cross-sectional study was conducted using a random sample of family physicians’ medical records of 86 older adults aged ≥75 years living in the community studied. Their nutritional status was evaluated using the Mini Nutritional Assessment.
Results
A total of 10.5% of the elderly were undernourished and 41.9% were at undernutrition risk. According to the logistic regression multivariable model, the following characteristics: being widowed (OR=6.7; 95%CI=1.8-24.6); being institutionalized (OR=12.6; 95%CI=1.7-90.5); or having a negative self-perception of health (OR=15.0; 95%CI=3.3-69.1) were independently associated with a significant increase of undernutrition risk.
Conclusion
The current study shows that undernutrition is highly prevalent in Portuguese older adults aged ≥75 years living in communities. The major factors independently associated with their undernutrition are being widowed and institutionalized and having negative self-perception of health. The results obtained show that undernutrition and its associated factors are very serious problems for older adults and a challenge in their health care.
R E S U M O
Objetivo
Determinar a prevalência de desnutrição em idosos com 75 ou mais anos de idade que vivem em comunidades e identificar os possíveis fatores independentes associados à desnutrição.
Métodos
Foi realizado um estudo transversal numa amostra aleatória dos registos de médicos de família de idosos com idades ≥75 anos. O estado nutricional foi avaliado por meio da Miniavaliação Nutricional.
Resultados
Estavam desnutridos10,5% dos idosos e 41,9% apresentavam risco de desnutrição. De acordo com o modelo de regressão logística multivariável, ser viúvo (OR=6,7; IC95%=1,8-24,6), estar institucionalizado (OR=12,6; IC95%=1,7-90,5) ou ter uma autoperceção de saúde negativa (OR=15,0; IC95%=3,3-69,1) demonstraram estar associados a um aumento significativo do risco de desnutrição.
Conclusão
Segundo o presente estudo, a desnutrição tem uma prevalência elevada em idosos portugueses com idades ≥75 anos que vivem em comunidades. Os principais fatores associados com a desnutrição são a viuvez, a institucionalização e a autopercepção de saúde negativa. Esses resultados demonstram que a desnutrição e os fatores a ela associados representam um grave problema para os idosos e um desafio para os cuidados de saúde.
Palavras-chave: Idosos. Desnutrição. Avaliação nutricional.
I N T R O D U C T I O N
Undernutrition in older adults is a serious public health problem that has substantially increased among the elderly1,2. Despite all the
alarming data released in the last decade on the negative influence of undernutrition on older population health status, undernutrition occurrence is still very high in Europe3-7.
Although several undernutrition screening and assessment tools are available, the Mini Nutritional Assessment (MNA)8 has showed
acceptable criterion9,10 and predictive validity9-11.
A multinational pooled analysis using the MNA12
showed the prevalence of undernutrition of 39% hospitalized older adults, 14% in older adults living in nursing homes, and around 6% in community residents. The prevalence of undernutrition risk reported in this analysis12 is
even higher: 47% in hospitalized older adults, 54% in older adults living in nursing homes and 32% living in a community12. More recent studies
confirm these results, showing that approximately two thirds of older adults are at nutritional risk or undernourished13-15.
Many factors have been associated with undernutrition in older adults, such as older age, low income, low educational level, social isolation, institutionalization13-15, food insecurity16, negative
self-perception of health17, and depression14.
Changes associated with anorexia and the functional difficulties that interfere with feeding, such as dysphagia, decreased mobility, and changes in smell and taste, are related to an increased risk of undernutrition18. Undernutrition
is also a potentially modifiable risk factor affecting quality of life, morbidity, and mortality in older adults19 since it is related to higher health care
requirements and costs for both the patient and the health system20.
primary preventive measures since they have already proved to be economically effective and to prevent deterioration of health status in older adults20,21.
Accordingly, this study aims to contribute to elucidate the nutritional status of older adults aged 75 years and over living in communities in Northern Portugal and to identify the main factors independently associated with undernutrition.
M E T H O D S
A cross-sectional study was conducted on older adults aged 75 or over living in communities in Braga, Portugal, in 2013. Exclusion criteria were defined as the impossibility to establish contact, hospitalization, and inability to understand or to respond to the questionnaire. Braga has total population of 175.063 inhabitants, of whom 21.050 are aged 65 or older. The target population of the present study was defined as older adults aged 75 or over who were included as patients in the family physicians’ list in the community Unidade de Saúde Familiar Manuel Rocha Peixoto (n=731).
In order to calculate the sample size, the OpenEpi® statistical software was used22. Based
on previous data from studies conducted in other countries12-15, an estimated prevalence of
undernutrition of 50.0% was considered. Assuming the following values: statistical power of 80.0%, alpha = 0.5, and effect size 1, a sample size of 131 older adults was obtained. Randomness of the sample was generated by selecting the first 131 set of numbers using the Random.org®. For the recruitment process, 131
older adults were selected. Thirty five did not meet the inclusion criteria because of the impossibility to be contacted (n=23, 17.6%) or due to poor understanding of the questionnaire (n=12, 9.2%). Of those eligible to participate in the study, 10 declined participation.
Therefore, with a participation rate of 65.6%, the sample consisted of 86 older adults, of which 63 were women (73.3%).
Socio-demographic characteristics were compared between the participants and non-participants (due to inabilities related to not answering the phone, wrong number, nonexistent number, or participation refusal). Statistically significant differences in the distribution between the participants were found only regarding place of residence since there was a higher proportion of non-institutionalized older adults among the participants than that of the non-participants (p=0.027).
Self-reported physical activity data was collected evaluating the achievement of at least 30 minutes of continuous exercise. Self-perception of health was evaluated using self-reported opinions as follows: 0 if negative, 1 if positive, and 2 if do not know/no answer.
Nutritional status was evaluated using the full MNA8. Anthropometric measurements were
performed according to MNA instructions. Due the impossibility of obtaining weight measurement, the weight values were estimated23. When
obtaining accurate height measurements was not possible, the values were estimated based on the measurement of half-span24. Data was collected
through direct interviews conducted by a previously trained interviewer in the older adults’
place of residence.
This study was approved by the Facility Coordinator and by the North Regional Health Authority Research Ethics Committee, IP number 55/2012. All participants signed an Informed Consent, according to the Declaration of Helsinki25.
For data analysis, the participants were grouped into two categories (undernourished/at risk of undernutrition and not undernourished older adults). The Chi-square (χ2) test was used
quantified using the Odds Ratio (OR) and the respective 95% Confidence Intervals (95%CI). Differences or associations were considered
statistically significant when p<0.05. The statistical analysis was conducted using the Statistical Package for the Social Sciences (SPSS) 20.0.
Age (years) 75-84 ≥85 Gender Male Female School years 0 1-3 ≥4 Marital status Non-widowed Widowed Institutionalized Not Yes Income
≤minimum salary >one minimum salary Does not know/answer
Physical activity Exercise (No) Exercise (Yes) Alcoholic beverages No Yes
Self-perception of health
Negative Positive
Does not know/answer
Chronic diseases
No Yes
Does not know/answer
Number of medical appointments
0-5 >6
Does not know/answer
Number of hospitalizations
0 1
Does not know/answer
25 20 10 35 17 15 13 15 30 28 17 19 15 11 31 14 32 13 31 6 8 0 37 8 24 12 9 31 13 1 26 15 13 28 14 13 14 24 17 36 5 30 9 2 20 21 15 26 18 23 0 3 37 1 29 11 1 32 9 0 <0.459 <0.321 <0.867 <0.019 <0.007 <0.056 <0.058 <0.001 <0.001 <0.089 <0.580 <0.424
Table 1. Sample characteristics according to the nutritional status. Older adults that are
undernourished/undernutrition risk (n=45)
Older adults that are not
undernourished/undernutrition risk (n=41) p
Variables 55.6 44.4 22.2 77.8 37.8 33.3 28.9 33.3 66.7 62.2 37.8 42.2 33.3 24.4 68.9 31.1 71.1 28.9 68.9 13.3 17.8 00.0 82.2 17.8 53.3 26.7 20.0 68.9 28.9 02.2
n % n %
R E S U L T S
The older adults evaluated were aged between 78 and 100 years, and the median age of male adults was 84.1 years (Standard Deviation - SD=4.8 years). According to the MNA analysis, 10.5% of older adults were undernourished and 41.9% were at undernutrition risk. No
statistically significant differences were found between the studied groups regarding age, gender, and education level (Table 1). On the other hand, statistically significant differences concerning marital status were identified (p=0.019); contrary to the non-undernourished older adults, the majority of undernourished or at undernutrition risk older adults were widowed
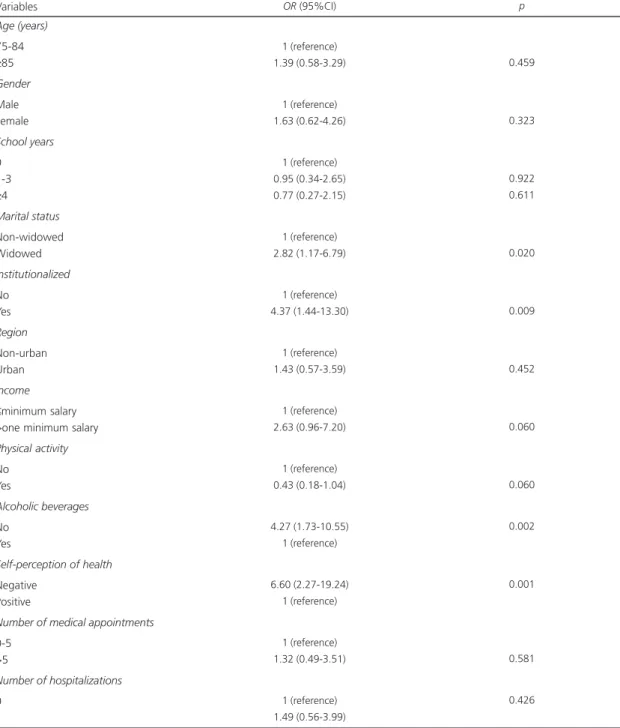
Table 2. Undernutrition risk and associated factors (bivariate analysis).
Age (years)
75-84
≥85
Gender
Male Female
School years
0 1-3
≥4
Marital status
Non-widowed Widowed
Institutionalized
No Yes
Region
Non-urban Urban
Income
≤minimum salary >one minimum salary
Physical activity
No Yes
Alcoholic beverages
No Yes
Self-perception of health
Negative Positive
Number of medical appointments
0-5 >5
Number of hospitalizations
0 1
1 (reference) 1.39 (0.58-3.29)
1 (reference) 1.63 (0.62-4.26)
1 (reference) 0.95 (0.34-2.65) 0.77 (0.27-2.15)
1 (reference) 2.82 (1.17-6.79)
1 (reference) 4.37 (1.44-13.30)
1 (reference) 1.43 (0.57-3.59)
1 (reference) 2.63 (0.96-7.20)
1 (reference) 0.43 (0.18-1.04)
4.27 (1.73-10.55) 1 (reference)
6.60 (2.27-19.24) 1 (reference)
1 (reference) 1.32 (0.49-3.51)
1 (reference) 1.49 (0.56-3.99)
0.459
0.323
0.922 0.611
0.020
0.009
0.452
0.060
0.060
0.002
0.001
0.581
0.426
OR (95%CI) p
Note: OR: Odds Ratio; 95%CI: 95% Confidence Intervals.
(66.7%). There were also statistically significant differences between the groups regarding to place of residence (p=0.007), and there was a greater proportion of undernourished older adults amongst those that were institutionalized. The majority of the undernourished participants reported not having drinking habits (71.1%), as opposed to the reports of non-undernourished older adults (p=0.001) (Table 1). With regard to the clinical variables, statistically significant differences in the self-perception of health (p<0.001) were found, which can be confirmed by the largest proportion of older adults with self-negative health perceptions observed amongst the undernourished (68.9%) group (Table 1).
According to the bivariate analysis, being widowed was associated with an increased undernutrition risk compared to those who do not experience widowhood (Table 2). In addition, being institutionalized or not having drinking habits was also found to be associated with an increased undernutrition risk. Nevertheless, the negative self-perception of health was the factor
most strongly associated with a significantly increased undernutrition risk (Table 2).
The multivariate analysis showed that most of the variables originally associated with a significantly increased risk maintained this association throughout the study (Table 3). Indeed, after multivariate model adjustments, the magnitude of the associations increased. Self-perception of negative health continued to be the factor that was most strongly associated with undernutrition risk. Being widowed or being institutionalized was associated with an increased undernutrition risk. Conversely, drinking habits decreased statistical significance in the multivariate analysis. This model was statistically significant (G2[6]= 36.493, p<0.001), allowing to explain 49.0% of the outcome variables and correctly classify 80.8% of subjects (Table 3).
D I S C U S S I O N
This community-based cross-sectional study results (10.5% undernourished and 41.9%
Table 3. Factors associated with undernutrition - logistic regression multivariable model.
Age (years)
75-84
≥85
Gender
Male Female
Marital status
Non-widowed Widowed
Institutionalized
No Yes
Alcoholic beverages
No Yes
Self-perception of health
Negative Positive
1 (reference) 0.56 (0.16-1.99)
1 (reference) 1.57 (0.38-6.56)
1 (reference) 6.73 (1.84-24.64)
1 (reference) 12.56 (1.74-90.53)
1.29 (0.36-4.69) 1 (reference)
15.03 (3.27-69.09) 1 (reference)
<0.367
<0.539
<0.004
<0.012
<0.693
<0.001
OR (95%CI) p
Note: OR: Odds Ratio; 95%CI: 95% Confidence Intervals; R2
at undernutrition risk) show signs of undernutrition and undernutrition risk in more than half of the Portuguese older adults living in communities. These findings are similar to those reported recently in Spain1, the Netherlands2,5,15, and
Germany14. However, they differ from those of
other international studies conducted in a community in which the prevalence of undernutrition is lower and ranges between 1.7% and 5.8%, and undernutrition risk varies between 13.1% and 31.9%12,26-29. The results obtained in the
present study show the impact of this problem in Portugal and the need for immediate implementation of preventive and therapeutic measures.
The majority of the older adults investigated in this sample were aged between 78 and 84 years. Compared to older adults aged ≥85 years, a higher frequency of undernutrition risk and of undernutrition was observed. Contrary to what was found in the literature, these differences were not significant, perhaps as a result of the increased mortality that is known to be associated with older ages17,30. This may also be due to the different
cut-off points adopted in those studies, including older adults over 60 years of age, thus accentuating the differences between the various age groups.
There was female predominance, which is in accordance with the Portuguese national reality31. The higher proportion of undernutrition
risk and undernutrition in women can be explained by their higher widowhood rates31.
However, the multivariate analysis, contrarily to a previously reported study conducted in Portugal on hospitalized patients, showed no association between gender and undernutrition risk32.
Moreover, education was not associated with undernutrition, which also differs from the literature, which reports low level of education independently associated with increased risk of undernutrition32,33. These results indicate that the
pattern of risk factors associated with undernutrition in this sample is different from that previously described for younger adults.
These results show a significant association between being widowed and increased undernutrition risk. Although this specific association has not yet been previously reported in the literature, these findings are in line with those of a previous study conducted in Portugal, in which it was found that being single, divorced, or widowed increases undernutrition risk32.
Perhaps these results reflect that widowhood is associated with increased likelihood of living alone and social isolation, which has been widely described as a risk factor for undernutrition34.
Being institutionalized was also associated with undernutrition risk. These results are consistent with previous reports of high prevalence of undernutrition in geriatric institutions and claim that institutionalized older adults tend to have poorer nutritional status than those non-institutionalized older adults12,17,35.
Self-perception of health is the most strongly negative factor associated to undernutrition. These results are in line with a prospective study involving 579 older Swedish adults living in a community, showing that low self-perception of health is the strongest predictor of undernutrition risk17.
Some strengths of this study should be highlighted. To the best of our knowledge, this is the first study on the nutritional status of Portuguese older adults living in communities. In addition, the random sample increases the possibility of being representative of the study population, and thus these results could be generalized to the entire population. The proportion of participation in the present study was 65.6%, and it can be considered as an acceptable value. Except for the higher participation rates amongst those who were institutionalized, there were no statistically significant differences between the participants and those who refused to participate in the study, which increases the possibility of having a sample representative of the study population.
allow for the establishment of causal relationships between the factors identified and undernutrition. The exclusion criteria applied, namely the impossibility to establish contact, hospitalization, and inability to understand or to respond to the questionnaire, limit the ability to assess the factors associated with undernutrition in the older adults who were more likely to have poor health and to be undernourished. Furthermore, caution is required in extrapolating these results since reverse causality, a common limitation of cross-sectional studies may be present. Moreover, the reduced number of older adults, mostly due to a sample size smaller than previously calculated, reduces the power of the statistical tests, which can limit the possibility of identifying a larger number of significant associations and to conduct interaction tests. Physical activity and self-perception of health were self-reported and evaluated through simple questions. This was due to the need for a brief interview, given the advanced age of the participants, the low literacy of some, and the lack of validated scales in Portugal to evaluate these parameters in elderly people. Finally, although some adjustments were made for a variety of potential confounding factors, the effect of other factors that were not investigated, interaction effects, and residual confounding cannot be ruled out.
The present study demonstrated that in the sample used more than half of the seniors are undernourished or at risk of undernutrition in Braga, Portugal. Additionally, being widowed, being institutionalized, or having a negative self perception of health is associated with a higher risk of undernutrition in older adults aged 75 or older. Given these results, and based on the knowledge that undernutrition can lead to increased morbidity, higher mortality, and declining quality of life in older adults, it is imperative to devise preventive and therapeutic strategies in a timely manner. Until then, recommendations for the adoption of strategies nationwide should be considered to minimize this problem in hospitals. After the identification of
risk groups in a community environment, it is urgent to implement preventive strategies avoiding hospital admission of older adults36.
These findings are therefore a challenge for Primary Health Care and health professionals, who should be encouraged to promote screening and diagnosis of undernutrition systematically, integrated in overall assessment of the older adults.
C O N T R I B U T O R S
ALM SANTOS, TMSPF AMARAL, and NPGFB BORGES designed the study, conducted data analysis and drafted the manuscript. ALM SANTOS collected data, and all the authors contributed for its final version.
R E F E R E N C E S
1. Marco J, Barba R, Zapatero A, Matia P, Plaza S, Losa JE, et al. Prevalence of the notification of malnutrition in the departments of internal medicine and its prognostic implications. Clin Nutr. 2011; 30(4):450-4. http://dx.doi.org/10.1016/j. clnu.2010.12.005
2. Meijers JM, Halfens RJ, van Bokhorst-de van der Schueren MA, Dassen T, Schols JM. Malnutrition in Dutch health care: Prevalence, prevention, treatment, and quality indicators. Nutrition. 2009; 25(5):512-9. http://dx.doi.org/10.1016/j.nut.2008. 11.004
3. Kagansky N, Berner Y, Koren-Morag N, Perelman L, Knobler H, Levy S. Poor nutritional habits are predictors of poor outcome in very old hospitalized patients. Am J Clin Nutr. 2005; 82(4):784-91. 4. Nykanen I, Lonnroos E, Kautiainen H, Sulkava R,
Hartikainen S. Nutritional screening in a population-based cohort of community-dwelling older people. Eur J Public Health. 2013; 23(3):405-9. http://dx. doi.org/10.1093/eurpub/cks026
5. Schilp J, Kruizenga HM, Wijnhoven HA, Leistra E, Evers AM, van Binsbergen JJ, et al. High prevalence of undernutrition in Dutch community-dwelling older individuals. Nutrition. 2012; 28(11-12):1151-6. http://dx.doi.org/10.1016/j.nut.2012.02.016 6. Torma J, Winblad U, Cederholm T, Saletti A. Does
undernutrition still prevail among nursing home residents? Clin Nutr. 2013; 32(4):562-8. http://dx. doi.org/10.1016/j.clnu.2012.10.007
nutritional risk of autonomous non-institutionalized adult elder people. Nutr Hosp. 2013; 28(5):1438-46. http://dx.doi.org/10.3305/nh.2013.28.5.6782 8. Guigoz Y, Vellas B, Garry PJ. Assessing the nutritional status of the elderly: The Mini Nutritional Assessment as part of the geriatric evaluation. Nutr Rev. 1996; 54(1 Pt. 2):S59-65.
9. van Bokhorst-de van der Schueren MAE, Guaitoli PR, Jansma EP, de Vet HCW. Nutrition screening tools: Does one size fit all? A systematic review of screening tools for the hospital setting. Clin Nutr. 2014; 33(1):39-58. http://dx.doi.org/10.1016/J. Clnu.2013.04.008
10. van Bokhorst-de van der Schueren MAE, Guaitoli PR, Jansma EP, de Vet HCW. A systematic review of malnutrition screening tools for the nursing home setting. J Am Med Dir Assoc. 2014; 15(3):171-84. http://dx.doi.org/10.1016/J.Jamda.2013.10.006 11. Dent E, Visvanathan R, Piantadosi C, Chapman I.
Nutritional screening tools as predictors of mortality, functional decline, and move to higher level care in older people: A systematic review. J Nutr Gerontol Geriatr. 2012; 31(2):97-145. http://dx.doi.org/ 10.1080/21551197.2012.678214
12. Kaiser MJ, Bauer JM, Ramsch C, Uter W, Guigoz Y, Cederholm T, et al. Frequency of malnutrition in older adults: A multinational perspective using the mini nutritional assessment. J Am Geriatr Soc. 2010; 58(9):1734-8. http://dx.doi.org/10.1111/j.1532-54 15.2010.03016.x
13. Donini LM, Scardella P, Piombo L, Neri B, Asprino R, Proietti AR, et al. Malnutrition in elderly: Social and economic determinants. J Nutr Health Aging. 2013; 17(1):9-15. http://dx.doi.org/10.1007/s1 2603-012-0374-8
14. Stange I, Poeschl K, Stehle P, Sieber CC, Volkert D. Screening for malnutrition in nursing home residents: Comparison of different risk markers and their association to functional impairment. J Nutr Health Aging. 2013; 17(4):357-63. http://dx.doi. org/10.1007/s12603-013-0021-z
15. van Bokhorst-de van der Schueren MA, Lonterman-Monasch S, de Vries OJ, Danner SA, Kramer MH, Muller M. Prevalence and determinants for malnutrition in geriatric outpatients. Clin Nutr. 2013; 32(6):1007-11. http://dx.doi.org/10.1016/j. clnu.2013.05.007
16. Souza BFDJ, Marin-Leon L. Food insecurity among the elderly: Crosssectional study with soup kitchen users. Rev Nutr. 2013; 26(6):679-91. http://dx.doi. org/10.1590/S1415-52732013000600007 17. Johansson Y, Bachrach-Lindstrom M, Carstensen J,
Ek AC. Malnutrition in a home-living older population: Prevalence, incidence and risk factors. A prospective study. J Clin Nurs. 2009; 18(9):1354-64.
http://dx.doi.org/10.1111/j.1365-2702.2008.02 552.x
18. Morley JE. Anorexia of aging: Physiologic and pathologic. Am J Clin Nutr. 1997; 66(4):760-73. 19. Soderstrom L, Rosenblad A, Adolfsson ET, Saletti
A, Bergkvist L. Nutritional status predicts preterm death in older people: A prospective cohort study. Clin Nutr. 2014; 33(2):354-9. http://dx.doi.org/ 10.1016/j.clnu.2013.06.004
20. Council of Europe. Committee of Ministers. Resolution ResAP(2003)3 on food and nutritional care in hospitals 2003 [cited 2013 Sept 28]. Available from: http://www.nutritionday.org/ uploads/media/Resolution_of_the_Council_of_ Europe.pdf
21. Amaral TF, Matos LC, Tavares MM, Subtil A, Martins R, Nazare M, et al. The economic impact of disease-related malnutrition at hospital admission. Clin Nutr. 2007; 26(6):778-84. http://dx.doi.org/10.1016/ j.clnu.2007.08.002
22. Dean AG, Sullivan KM, Soe MM. OpenEpi: Open Source Epidemiologic Statistics for Public Health, Version 2.3.1 [cited 2013 Sept 28]. Avaliable from: http://www.openepi.com/Menu/OE_Menu.htm 23. Chumlea WC, Guo S, Roche AF, Steinbaugh ML.
Prediction of body weight for the nonambulatory elderly from anthropometry. J Am Diet Assoc. 1988; 88(5):564-8.
24. Kwok T, Whitelaw MN. The use of armspan in nutritional assessment of the elderly. J Am Geriatr Soc. 1991; 39(5):492-6.
25. The World Medical Association. Declaration of Helsinki: Ethical principles for medical research involving human subjects. France: World Medical Association; 2008.
26. Ferreira LS, Amaral TF, Marucci MF, Nascimento LF, Lebrao ML, Duarte YA. Undernutrition as a major risk factor for death among older Brazilian adults in the community-dwelling setting: SABE survey. Nutrition. 2011; 27(10):1017-22. http://dx.doi.org/ 10.1016/j.nut.2010.11.008
27. Guigoz Y. The Mini Nutritional Assessment (MNA) review of the literature: What does it tell us? J Nutr Health Aging. 2006; 10(6):466-85.
28. Tsai AC, Ho CS, Chang MC. Assessing the prevalence of malnutrition with the Mini Nutritional Assessment (MNA) in a nationally representative sample of elderly Taiwanese. J Nutr Health Aging. 2008; 12(4):239-43.
30. Vedantam A, Subramanian V, Rao NV, John KR. Malnutrition in free-living elderly in rural south India: Prevalence and risk factors. Public Health Nutr. 2010; 13(9):1328-32. http://dx.doi.org/10.1017/S1 368980009991674
31. Instituto Nacional de Estatística. Censos 2011: Resultados preliminares. Lisboa: Instituto Nacional de Estatística; 2011.
32. Amaral TF, Matos LC, Teixeira MA, Tavares MM, Alvares L, Antunes A. Undernutrition and associated factors among hospitalized patients. Clin Nutr. 2010; 29(5):580-5. http://dx.doi.org/10.1016/j. clnu.2010.02.004
33. Timpini A, Facchi E, Cossi S, Ghisla MK, Romanelli G, Marengoni A. Self-reported socio-economic status, social, physical and leisure activities and risk for malnutrition in late life: A cross-sectional population-based study. J Nutr Health Aging. 2011; 15(3):233-8.
34. Pirlich M, Schutz T, Kemps M, Luhman N, Minko N, Lubke HJ, et al. Social risk factors for hospital malnutrition. Nutrition. 2005; 21(3):295-300. http:// dx.doi.org/10.1016/j.nut.2004.06.023
35. Pereira Machado RS, Santa Cruz Coelho MA. Risk of malnutrition among Brazilian institutionalized elderly: A study with the Mini Nutritional Assessment (MNA) questionnaire. J Nutr Health Aging. 2011; 15(7):532-5.
36. Beck AM, Beermann T, Kjaer S, Rasmussen HH. Ability of different screening tools to predict positive effect on nutritional intervention among the elderly in primary health care. Nutrition. 2013; 29(7-8): 993-9. http://dx.doi.org/10.1016/j.nut.2013.01.016