ABSTRACT: This paper addresses the subject of iber optic chromatic dispersion effect on the performance of analog optical link with dual-drive electro-optic Mach-Zehnder modulator, aiming at aerospace applications. Thus, a direct detection link model that emphasizes both the modulator electronic drive and the dispersion characteristic of a linear optical iber is discussed. Furthermore, a mathematical approach yielding a rather insightful analysis of the link performance for either optical double or single sideband modulation formats is fully discussed. It is worthwhile to point out that such modeling has the special feature of relying on a uniform nomenclature, which enables one to quickly retrieve a wide range of known results regarding optical iber link performance that are already available on an ample literature. The model usefulness is illustrated by predicting the performance dependence of a direct detection iber optic link with respect to the radiofrequency and link length. Results of numerical simulations for a link that comprises commercial optoelectronic components with potential for practical application on electronic warfare ield were also provided.
KEYWORDS: Dual-drive Mach-Zehnder modulator, Analog
iber optic link, Fiber optic chromatic dispersion, Optical single sideband modulation, Optical double sideband modulation.
Effect of Fiber Optic Chromatic Dispersion
on the Performance of Analog Optical
Link with External Modulation Aiming at
Aerospace Applications
Antonio Alves Ferreira Júnior1, Olympio Lucchini Coutinho2, Carla de Sousa Martins3, William dos Santos
Fegadolli2, José Antônio Justino Ribeiro1, Vilson Rosa de Almeida4, José Edimar Barbosa Oliveira2
INTRODUCTION
Due to the increasing evidence that radio-over-iber technology will be playing a major role in global interconnectivity, many eforts have been directed toward researches and development on the ield of iber optic link. A great deal of emphasis continues to be driven by important military and commercial demands, which aim at previously unachievable performance on the subjects of radiofrequency (RF) and microwave signal processing, radio-over-iber, and antenna-remoting (Yao, 2012a, 2012b). Nowadays, analog photonic links have attracted signiicant interest in many applications, such as phased array antennas, radar systems, broadband cable-television (CATV) networks, ROF access wireless communications, and so on (Capmany et al., 2013; Yao, 2012c; Zhang et al., 2012a, 2012b; Wu et al., 2011).
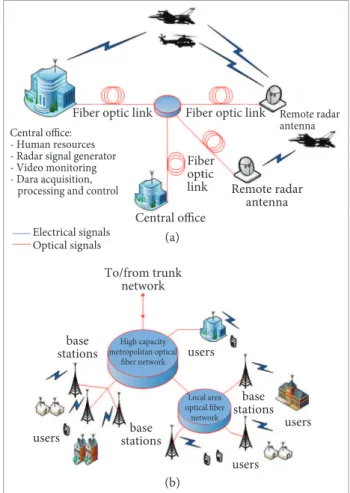
Aiming at aerospace applications, the remote radar antenna could be placed at a distance of several kilometers from the central office, and the generated radar signals could be distributed to other antennas for tracking an aircraft, or to other central offices (Oliveira et al., 1999; Coutinho et al., 2011; Lim et al., 2009). This versatility is very interesting because human resources and equipments can be allocated in a safety and controlled place, while the remote radar antenna is
1.Instituto Nacional de Telecomunicações – Santa Rita do Sapucaí/MG – Brazil 2.Instituto Tecnológico de Aeronáutica – São José dos Campos/SP – Brazil 3.Instituto
de Pesquisas da Marinha – Rio de Janeiro/RJ – Brazil 4.Instituto de Estudos Avançados – São José dos Campos/SP – Brazil
Author for correspondence: Antonio Alves Ferreira Júnior | Instituto Nacional de Telecomunicações | Avenida João de Camargo, 510 | CEP 37.540.000 Santa Rita
do Sapucaí/MG – Brazil | E-mail: [email protected]
located at field, as suggested in Fig. 1a. A central office that is connected to a large number of base stations via optical fiber may be used in a high capacity metropolitan optical fiber network to distribute data signals from various communications systems to users or to another optical fiber network area, as illustrated in Fig. 1b (Yao, 2012b; Lim et al., 2010).
At the input end of such links, an optical laser diode generates a carrier at a desired optical wavelength, and a dual-drive electro-optic Mach-Zehnder modulator (DD-MZM) imposes an analog RF signal (e.g. radar signal) on the optical carrier. his signal is applied to an optical iber link, whereas at the output end of the link a photodetector (PD) is employed to recover the analog RF signal from its optical carrier, and then processed by a RF front-end and delivered to a load (e.g. remote radar antenna). It is worthwhile to point out that the DD-MZM plays an important role in the link for it enables the wideband implementation of either optical
single sideband (OSSB) or optical double sideband (ODSB) modulation formats.
his publication is concerned with the efect of iber optic chromatic dispersion on the performance of links that operate based on external intensity modulation and direct detection techniques, called IM/DD optical links coniguration. Assuming a balanced 50/50 splitting ratio of the DD-MZM Y-junctions, a rigorous analysis of the chromatic dispersion efect on the performance of the analog link was provided by Corral et al. (2001). However, the expressions are in the form of ininite series. Such drawback is overcome in Cheng et al. (2005), where an analytical model, in which the modulation indexes of the two DD-MZM drives can be unbalanced, yields a closed-form expression for the power at the output of the detector. Nevertheless, fabrication tolerances make a balanced DD-MZM particularly diicult to achieve, hence practical modulators have a inite extinction rate. herefore, a general model that allows the study of all these cases will be very helpful for the system design.
STATEMENT OF THE PROBLEM
A typical schematic representation of the IM/DD link with a transmitter, an optical channel, and a receiver is illustrated in Fig. 2a. In Fig. 2b an external electro-optic modulator electronic driver is emphasized.
At the input of the iber optic link, a continuous wave from a distributed feedback single-mode laser diode (DFB-LD) generates an optical carrier at a desired wavelength/frequency with a complex optical ield given by Yariv and Yeh (2007), as seen in Eq. 1:
( )
( )
j[
ot o]
o
o t P te
E = 2ξ ω +φ (1)
where ωo is the mean optical frequency, ϕo is an arbitrary
initial optical phase, Po(t) is the optical power, and ξ (ohms
per square meter) is a constant that depends on both the laser beam efective cross-section and the optical wave impedance.
he present publication relies on the oten used approach in the analysis of IM/DD optical links according to which the laser average power and its phase are time invariant (Corral et al., 2001; Cheng et al., 2005).
In Fig. 2b one should notice that the optical power delivered by the laser diode reaches the input Y-junction of
the integrated z-cut LiNbO3 DD-MZM, and then it is divided
into two parcels according to a splitting ratio, determined Central office:
- Human resources - Radar signal generator - Video monitoring - Dara acquisition, processing and control
Fiber optic link Fiber optic link
Fiber optic
link Remote radar
antenna Central office
Electrical signals
Optical signals (a)
(b) To/from trunk
network
users
base stations base
stations base
stations
High capacity metropolitan optical
fiber network
Local area optical fiber
network users
users users
Remote radar antenna
by the Y-junction power transmission coeicient r1
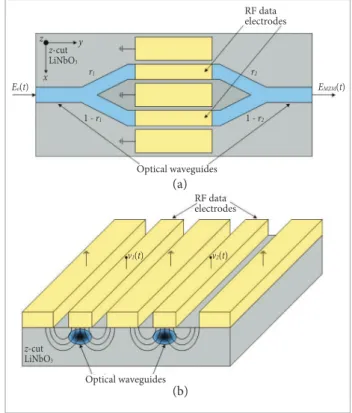
(Lin et al., 2008). he simpliied view of an integrated DD-MZM
is illustrated in Fig. 3 (Morant et al., 2011; Janner et al., 2008),
where (A) shows the top view in which the optical waveguides are properly positioned with respect to the RF modulation ield pattern, and (B) presents the cross-section view.
Once a MZM’s coniguration is speciied, as shown in Fig. 3, its performance dependence on substrate orientation and geometry of electrodes can be predicted through the variation of the optical phase factor. Using a standard perturbation analysis, such variation turns into Eq. 2 (Kitano and Oliveira, 2000):
( )
[
( )( )
]
( )
( )
( )
∫ ∫
∫ ∫
∞ +
∞ −
∞ +
∞ −
∗
+∞
∞ −
+∞
∞ −
∗
.
ε
ε
− ⋅
β
με
ω
=
β
Δ
dxdz
z
x
E
z
x
E
dxdz
z
x
E
z
x
E
r
z
x
E
TM TE TM
TE
TM TE m
k ijk jj ii TM
TE
TM TE o p o TM TE o p
, ,
, ,
,
2
, ,
, ,
, 0 2 ,
(2)
where βopTE,TM and E
TE,TM are the unperturbed optical phase
factor and electric ield for TE or TM modes, respectively;
Ek(m) is the RF modulation electric ield; r
ijk and εii are the
components of the electro-optic tensor and electric
permittivity of LiNbO3, respectively. Equation 2 shows that as
a consequence of the electro-optic efect, a RF signal can be used to control the phase of the optical ield associated with each optical power parcels as they propagate through the
distinct arms of the DD-MZM. It is worthwhile to point out that in the coniguration selected in Fig. 3 the optical guided mode has TM polarization, since it enables the use of the
strongest LiNbO3 electro-optic coeicient, namely r33.
he RF signal, henceforth named modulation signal, must generate an electric ield with both a temporal and a spatial pattern adequately distributed in order to reach some key performance requirements, such as low RF power consumption and wide RF bandwidth (Kitano and Oliveira, 2000; Oliveira and Ribeiro, 2000). A great deal of such control may be achieved through the drive electronics, by properly choosing the phase shit (θ1) and the bias (θ2) of the electrical signal applied to the modulator electrodes, as indicated in Fig. 2b. According to Fig. 2, the instantaneous values of the modulating signals applied to the lower and upper electrodes of MZM, are as in Eqs. 3a and 3b:
( )
1(
1)
1t =V cosω t+θ
v RF (3a)
( )
t V(
t)
v2 = 2cosωRF (3b)
Figure 2. Overall architecture of the IM/DD analog iber optic link, where (a) shows the transmitter, optical channel and receiver, and (b) presents the external electro-optic modulator with the electronic driver.
Transmitter
Laser
Electro-optic modulator
Hybrid
coupler DD-MZM
(90º or 180º)
Eo(t)
Eo(t)
Zg
v2(t)
vg(t)
v1(t)
vb EMZM(t)
EMZM(t)
Ef(t) i(t) Optical channel
(a)
(b) 0º
θ1 θ2
Dispersive optical fiber
Photodetector
Electrical signals Opticalsignals
Remote radar antenna
Receiver
Eo(t)
R F d a t a electrodes
RF data electrodes Optical waveguides
Optical waveguides
EMZM(t)
(a)
(b)
r2
1 - r2 r1
z z-cut
LiNbO3
z-cut
LiNbO3
y
x
1 - r1
v2(t) v1(t)
Figure 3. Simpliied integrated dual-drive electro-optic Mach-Zehnder modulator (DD-MZM) scheme with a z-cut LiNbO
3
where V1 and V2 are the amplitudes of signals in the lower
and upper arms, ωRF is the angular frequency of the RF signal,
and θ1 is the phase diference between the signals. he optical
phase variations introduced in the arms of the modulator through linear electro-optic efect are given by Eq. 4:
( )
1( )
1(
1)
1 = cosω +θ
π = φ
π
t m
t v V
t RF (4a)
( )
t V(
t)
v2 = 2cosωRF (4b)
( )
=θ2π = φ
π
b
b V
V
t (4c)
where Vπ is the MZM half-wave switching voltage that can be
calculated using Eq. 2, and θ2 is the phase variation due to the
voltage bias applied to the proper access. he coeicients m1
and m2 are the modulation indexes due to their signals in the
lower and upper arms, which are given, respectively, by Eqs. 5a and 5b:
π π =
V V
m 1
1 (5a)
π π =
V V
m 2
2 (5b)
Based on the schematic representation illustrated in Fig. 3a and taking into account the splitting ratio of the
output Y-junction r2, it can be shown that the optical
electrical ield at the output of the DD-MZM has a complex form given by Eq. 6:
( )
{
[ ( ) ](
)(
)
jm ( t)}
t m
j
t
j
o
M Z M
R F R F
o
e r r
e r r e E t E
ω θ + θ + ω ω
− − +
+ =
cos
2 1
cos 2 1
2 2 1 1
1 1
(6)
where Eo=√(2ξPo).
It should be pointed out that Eq. 6 applies to DD-MZM with both arbitrary splitting ratio and modulation signals. Such general situation oten occurs in the real world, either at the fabrication stage of the modulator or in ield applications. he optical signal at the output of the modulator
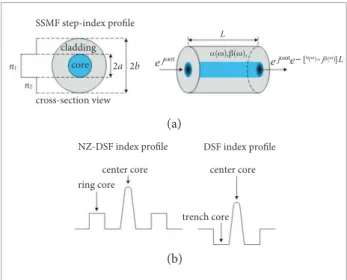
with electric ield given by Eq. 6 feeds a spool of standard single-mode optical iber (SSMF) with a step-index proile, circular dielectric waveguide and length L, as illustrated in
Fig. 4a. his simpliied representation has n1 and n2 as the
refractive indexes of the core and cladding with radius a and b, respectively (Yariv and Yeh, 2007). As an example, typical values of core and cladding diameters of a commercial iber is
8.2 and 125 µm, respectively (Corning®, 2002).
For instance, in the iber modeling, a fused silica glass SSMF operating at 1,550 nm wavelength is considered to be linear with constant loss α(ω) (dB per kilometer), whereas the phase factor β(ω) (radians per meter) exhibits dependence with respect to the frequency deviation and chromatic dispersion. he optical ield signal is afected by the attenuation and the phase factors ater propagates through an optical iber with length L, as shown in Fig. 4a. In order to achieve diferent values for the chromatic dispersion parameter, optical ibers with index proiles as illustrated in Fig. 4b are oten used to this purpose, like the nonzero-dispersion shited (NZ-DSF) and the zero-nonzero-dispersion shited (DSF) (Agrawal, 2002; Li and Nolan, 2008).
In the model of iber optic propagation characteristics, one should bear in mind the presence of three phenomena in the iber channel, which are diferent in nature, occur
SSMF step-index profile
NZ-DSF index profile DSF index profile
cross-section view core
center core
2a 2b
ring core
center core
trench core cladding
(a)
(b)
n1
n2
ejωote−[α( )ω+jβ( )ω]L
α( )ω ,β( )ω , L
ejωot
Figure 4. (a) A simpliied representation of a step-index proile standard single-mode optical iber (SSMF) with circular dielectric waveguide, and the optical signal affected by the attenuation and phase factors after being propagated through an optical iber with length L; (b) Index proiles often
simultaneously, and inluence each other, namely: noise,
iltering, and Kerr nonlinearity (Essiambre et al., 2010). his
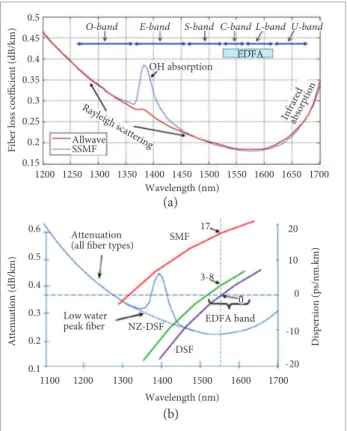
publication is mainly concerned with the iltering phenomenon that stems from the chromatic dispersion of the iber, including waveguide and material (Winzer and Essiambre, 2006). In order to understand these characteristics, for a SSMF we will use the Fig. 5 with the results that were published in
Essiambre et al. (2010) and Li and Nolan (2008).
Regarding SSMF attenuation, as see in Fig. 5a (Essiambre
et al., 2010), the 1,550 nm transmission window has the
lowest attenuation value, around 0.2 dB/km, compared with the 1,310 nm transmission one, which is around 0.35 dB/km. However, the SSMF chromatic dispersion value, red line in Fig. 5b (Li and Nolan, 2008), at 1,550 nm is around 17 ps/nm.km, while the 1,310 nm has zero-dispersion. he green and purple lines refer to NZ-DSF and DSF, respectively, where some types of index proiles for these ibers were presented in Fig. 4b.
he 1,550 nm window (C-band) is widely used for long-haul transmission system and the advance in research of erbium-doped ibers ampliiers (EDFA) made possible the use of this device in wavelength-division multiplexing (WDM) systems. However, the DSF were not suitable for WDM, because the nonlinear efect of four-wave mixing (FWM) is the strongest when the dispersion is zero. Certain amount of dispersion is desirable to reduce the FWM efect, being the NZ-DSF proposed. Some techniques to design optical ibers have been developed to achieve a desired value for the chromatic dispersion parameter (Li and Nolan, 2008). All the optical signal spectral components will propagate through the iber optic with diferent velocities, and the phase of each component will be changed by chromatic dispersion. Bearing in mind that an exact functional form is rarely known, its expansion in Taylor series around the carrier
frequency ωo as Agrawal (2002) performed is useful (Eq. 7):
( )
( )
( )(
)
( )(
)
( )(
ω ω−ω)
+β +
+ ω − ω ω β + ω − ω ω β + ω β = ω β
3
3
2 2
1 0
6
1 2
1
o o
o o o
o o
(7)
he high order terms were not considered. he four ones on the right side shows distinct dependence about the frequency deviation. he irst term is constant and related to phase velocity of optical carrier, the second varies linearly, and β1(ωo) determines the group velocity that is related to the group delay. he third has a quadratic dependence and it is related to the derivative of group velocity with respect to the frequency. he interesting here is on β2(ωo) coeicient related to the iber chromatic dispersion
parameter D(λ), the optical carrier wavelength (λo), and the
speed of light (c) in vacuum, according to Eq. 8 (Agrawal, 2002):
( )
( )
c
D o
o
π λ λ − = ω β
2
2
2 (8)
While the phase factor β(ω) presents dependence with respect to the frequency, the chromatic dispersion parameter
D(λ) has it with optical wavelength and can be modeled by
a Taylor’s series expansion around the operation wavelength (Wandel and Kristensen, 2006). However, a practical insightful
expression can be seen as in Eq. 9 (Corning®, 2002):
( )
⎟⎟⎠ ⎞ ⎜ ⎜ ⎝ ⎛
λ λ − λ =
λ 3
4 0
4
o
S
D (9)
O - b a n d E - b a n d S - ban d C - ban d
EDFA OH absorptíon
0 .5
0 .6 2 0
1 0
-1 0 0
-2 0 0 .5
0 .4
0 .3
0 .2
0 .1 0 .4 5
0 .4
0 .3 5
0 .3
0 .2 5
0 .2
0 .1 5 1 2 0 0
1 2 0 0
1 1 0 0 1 3 0 0 1 4 0 0 1 5 0 0 1 6 0 0 1 7 0 0 1 2 5 0 1 3 0 0 1 3 5 0 1 4 0 0 1 4 5 0 1 5 0 0 1 5 5 0 1 6 0 0 1 6 5 0 1 7 0 0
SSMF Allwave
Wavelength (nm) Attenuation
( a l l fi b e r t y p e s)
Low water peak fiber
SMF 17
3-8 0
NZ-DSF DSF
EDFA band
(b) Wavelength (nm)
(a)
F
iber loss coeffi
cient (dB
/k
m)
A
ttenuation (dB
/k
m)
Dispersion (ps/
nm.
k
m)
Inf rared
absorptí on
Rayleí gh scattering
L - ban d U - ban d
Figure 5. Spectral dependence of iber optic characteristics, where (a) is the behavior of attenuation factor (Essiambre et al.,
where S0 is the zero-dispersion slope and a typical value is less
than 0.092 ps/nm2.km (Corning®, 2002), λ is the operation
wavelength (nm), and λo is the zero-dispersion wavelength
(nm). he β3(ωo) parameter in Eq. 7 can be obtained from
the high order derivatives of phase factor, or it is deined
as the derivative of β2(ωo) with respect to the frequency.
It contributes to the calculation of the dispersion slope S(λ), which has dependence with optical wavelength, as Eq. 10 (Winzer and Essiambre, 2006):
( )
[
( )
]
32
2 2 3
2 4
β ⎟ ⎠ ⎞ ⎜ ⎝ ⎛
λ π + β ⎟ ⎠ ⎞ ⎜ ⎝ ⎛
λ π = λ λ =
λ D c c
d d
S (10)
At the output end of the SSMF, a square law PD transforms the photon stream into a RF electric current. When introducing the concept of PD responsivity, it can be shown that the electrical photocurrent is proportional to the incident average optical power, hence it is also to the magnitude of the optical Poynting vector. Assuming a uniform power distribution over the iber cross section, the time dependent RF current is as in Eq. 11:
( )
t E( ) ( )
tE t n( )
ti f f +
ξ ℜ =
∗
2 (11)
where
ℜ
is the PD responsivity, ξ (ohms per square meter) isa constant that depends on both the iber efective cross-section and the optical wave impedance, and Ef (t) is the optical electrical
ield at the iber link output according to Fig. 2a. he n(t)
accounts for PD additive noises sources, such as thermal and shot noises (Lim et al., 2009; Yariv and Yeh, 2007). However, the noise subject will not be addressed in this publication.
As will be shown later, Eq. 11 reveals that by applying the iber output to the PD, beating signals between the optical spectral components will generate harmonics of the original RF modulating signal. he characteristics of these depend on both the iber optic chromatic dispersion and the modulation format, which will be used to estimate the performance of the link.
OPTICAL FIBER LINK MODEL
As previously stated, the present study is concerned with links based on DD-MZM having a 50/50 splitting ratio. Hence, using Eq. 6, the output electrical ield in the complex form turns out to be expressed as Eq. 12:
( )
(
)
( )(
)
⎥⎦
⎤
+
⎢
⎣
⎡
+
=
∑
∑
∞
+
− ∞
=
ω
+ ∞
− ∞
=
θ
θ+
ω ω
n
t jn n n n
j
t
jn n n t
j o
MZM
RF RF o
e m J j
e e
m J j e
E t E
2
1 1 2
2 (12)
where Jn(.) represents the irst kind Bessel’s function with
order n. By rewriting Eq. 12 in Eqs. 13 and 14:
( )
∑
+∞−∞ =
ω ω
=
n
t jn n t j o
MZM e o a e RF
E t E
2 (13)
( )
( )( )
[
J m 1e 1 2 J m 2]
jan= n n jnθ+θ + n (14)
It is readily seen that the optical ield at the DD-MZM output indeed consists of an ininite series of optical spectral
components, i.e. an optical carrier component at ωo and an
ininite number of sidebands, with frequencies ω = ωo ± nωRF
and amplitude an. A small-signal analysis was performed in
Ferreira Júnior et al. (2012), which enables one to identify the requirement that should be satisied by the DD-MZM drive electronics in order to provide certain modulation formats. For example, single sideband (OSSB), double sideband (ODSB), and carrier suppressed (OCS) optical modulation formats can be obtained when the pair of parameters (θ1,θ2) obeys the following constraint: (π/2, ±π/2), (π, ±π/2), and (π, π), respectively.
In order to further develop the analysis of the link, one should analyze again Eq. 13. Taking into account the linear nature of the iber optic and bearing in mind the spectral composition of the optical ield at the output of the DD-MZM, we tackled the efect of the chromatic dispersion with the help of Eq. 7. hus, we have obtained the following expression for the phase factor of an optical spectral component with frequency equal to ω = ωo ±nωRF (Eq. 15):
(
)
( ) ( )
( )(
)
( )(
ω ω)
+β ±
ω ω β + ω ω β ± ω β = ω ± ω β
3 3
2 2
1 0
6 1
2 1
RF o
RF o RF
o o RF
o
n
n n
n
(15)
( )
( ) ( )∑
+∞ −∞ = ω β ω ω ω α − = n L n j t jn n t j o L f o RF RF o dB e e a e E t E 2 2 2 1 20 210 (16)
Once more, we remember the linear characteristics of the iber optics under consideration. herefore, it might be possible to beneit from standard techniques developed for frequency domain analysis of system. First, we took the Fourier’s transform of Eq. 16 from a linear system, and ater some mathematical manipulations, we obtained Eq. 17 for the electrical ield in the frequency domain:
( )
∑
+∞(
)
( ) ( ) −∞ = ω β ω α − ω − ω δ π = ω n L n j RF n o L f o RF dB e n a E E 2 2 2 1 2010 (17)
where δ represents the Dirac’s delta function. herefore, we must be able to use the model to predict dependence on frequency of such current. To this aim, we irst remember that the convolution theorem can be applied to rewrite the time domain expression of the PD current, as given by Eq. 11 in the frequency domain, as Eq. 18:
( )
( )
( )
πξ ω ∗ ω ℜ = ω ∗ 4 f f E EI (18)
where the mathematical symbol * denotes convolution. hen, Eqs. 19, 20 and 21 were obtained for the RF current Fourier’s transform, under the condition n=N+k:
( )
∑
+∞(
) (
)
−∞ = ω − ω δ ω π = ω N RF RF N N II 2 (19)
(
)
∑
+∞ −∞ = φ ∗ + φ α − ℜ = ω k jk k k N N j o LRF e a a e
P N I d B 2 10 4
10 (20)
( )
L N ωRFβ ωo =φ 2
2 (21)
Equation 19 was achieved without introducing any approximation and is in perfect agreement with results published by many authors (Corral et al., 2001; Cheng et al.,
2005). Until a few years ago, using such formulas to predict the
spectral components of the PD current was rather cumbersome and yielded little physical insight, except when one assumed a small signal approximation. It is worth to remember such complexity mostly stems from the fact that the coeicient
aN+kak* involves the product of Bessel’s function, as it is readily
seen in Eq. 14.
However, a few years ago such drawback was overcome through the application of Graf ’s addition theorem for Bessel’s
functions (Cheng et al., 2005; Chi and Yao, 2008). In order
to be able to take advantage of such theorem in the analysis presented in this publication, we have used Eq. 14 to calculate
aN+kak* and then substituted the obtained result into Eq.
20. Ater some mathematical manipulations we obtained
expressions for I(NωRF) and for the detected DC current
(N=0), which besides allowing the retrieving of previous
results, it also includes a few parameters such as the iber attenuation, PD responsivity and laser output power. hese were not explicitly accounted for in previous publications. Such expressions are given, respectively, by Eqs. 22 and 23:
(
)
( ) ( )
( ) ( )
( ) ( )
( )( ) ( )
( ) ⎪⎭ ⎪ ⎬ ⎫ + + + + + ⎪⎩ ⎪ ⎨ ⎧ + . ℜ = ω∑
∑
∑
∑
∞ + −∞ = θ − φ + ⎥ ⎦ ⎤ ⎢ ⎣⎡ −θ
⎟ ⎠ ⎞ ⎜ ⎝ ⎛φ+π
∞ + −∞ = θ + φ + ⎥ ⎦ ⎤ ⎢ ⎣
⎡ +θ
⎟ ⎠ ⎞ ⎜ ⎝ ⎛θ+φ+π
∞ + −∞ = φ + ⎟ ⎠ ⎞ ⎜ ⎝ ⎛φ+π
∞ + −∞ = φ + ⎟ ⎠ ⎞ ⎜ ⎝ ⎛θ+φ+π
α − k jk k k N N j k jk k k N N j k jk k k N jN k jk k k N jN o L RF e m J m J e e m J m J e e m J m J e e m J m J e P N I dB 1 2 1 2 1 1 1 2 2 2 1 2 2 2 2 1 1 2 10 4 10 (22)
( )
[
( )
( )
( ) ( ) (
1 2 1 2)
]
2 2 1 2 10 cos 2 4 10 0 θ + θ + + + ℜ =∑
+∞ −∞ = α − k m J m J m J m J P I k k k k k o L dB (23)Furthermore, Eqs. 6 and 22 enable to quickly retrieve previous results with DD-MZM having ininite extinction
ratio (r1 = r2 = 0.5), and when the modulation indexes are
equal (m1 = m2 = m). Since the intention was to compare
theorem was applied for Bessel’s functions (Abramowitz and Stegun, 1965) to Eq. 22, under the assumption that the modulation indexes are equal, resulting in Eq. 24:
(
)
( )[
]
⎪⎭ ⎪ ⎬ ⎫ ⎥ ⎦ ⎤ ⎢ ⎣ ⎡ ⎟⎟ ⎠ ⎞ ⎜⎜ ⎝ ⎛φ−θ + + ⎥ ⎦ ⎤ ⎢ ⎣ ⎡ ⎟⎟ ⎠ ⎞ ⎜⎜ ⎝ ⎛φ+θ + ⎪⎩ ⎪ ⎨ ⎧ + ⎥ ⎦ ⎤ ⎢ ⎣ ⎡ ⎟ ⎠ ⎞ ⎜ ⎝ ⎛ φ + . ℜ = ω ⎥ ⎦ ⎤ ⎢ ⎣ ⎡ θ − ⎟ ⎠ ⎞ ⎜ ⎝ ⎛θ +π⎥ ⎦ ⎤ ⎢ ⎣ ⎡ θ + ⎟ ⎠ ⎞ ⎜ ⎝ ⎛θ +π
π π + θ α − 2 sin 2 2 sin 2 2 sin 2 4 10 1 2 1 2 10 2 1 2 1 1 m J e m J e m J e e P N I N N j N N j N jN jN o L RF dB (24)
In this publication, the modeling of the analog iber optic link is synthesized by Eq. 24. It enables the frequency domain analysis of how the iber optic chromatic dispersion afects the link performance which employ DD-MZM.
he ϕ parameter, which is given in Eq. 21, takes into account the harmonic order, RF, chromatic dispersion, and iber optic length. he optical modulation format can be speciied by properly selecting the parameters θ1 and θ2. his article follows
the approach adopted in Cheng et al. (2005), and the two
situations addressed are obtained when either θ1 = π (ODSB) or
θ1 = π/2 (OSSB), with θ2 = π/2 for both cases.
Usually, the performance of the iber link is evaluated in
terms of the RF power delivered to output load (RL), and the
average power of the harmonic with order N is (Eq. 25):
(
RF)
(
RF)
LR N I N R
P L 2
2 1
ω =
ω (25)
In order to compare the exact analytical model, Eqs. 24 and 25, with a particular case of small-signal approximation
(m << 1), which is widely discussed in the literature
(Lim et al., 2010), the detected RF fundamental (N = 1)
power is (Eq. 26):
(
)
⎟⎟ ⎠ ⎞ ⎜ ⎜ ⎝⎛π λ
⎟ ⎟ ⎟ ⎟ ⎠ ⎞ ⎜ ⎜ ⎜ ⎜ ⎝ ⎛ ℜ = ω α − c LDf R P m
P o L RF o
L RF R dB L 2 2 2 2 2 2 5 cos 8 10 (26)
Impedance matching networks are oten used at the DD-MZM input and PD output to provide the maximum signal power transfer, due to the frequency response of these
devices. In this work, all the impedances were considered purely resistive and matched. In Eq. 26, the modulation index (m) is related to signal power (PRF) and impedance (Zg) of the
RF source, and to the DD-MZM input impedance (ZMZM).
he RF power delivered to the load (PRL) is related to the PD
output impedance (Coutinho et al., 2005).
NUMERICAL RESULTS AND DISCUSSION
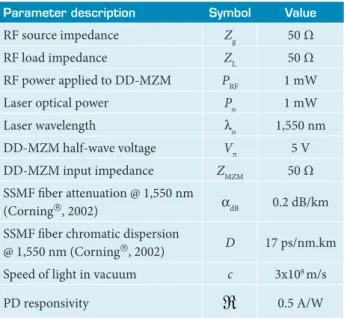
he numerical simulations were developed by using commercial components with parameters speciied in Table 1. To validate our model, irst of all we developed our simulations
with exactly the same link parameters used in Cheng et al.
(2005) and they were presented in Ferreira Júnior et al. (2012).
Figure 6a shows the normalized RF fundamental power for 10 GHz frequency in function of iber optic length, for both exact and small-signal approximations, using the ODSB modulation: (θ1 , θ2) = (π , π/2). It is observed that the results are in perfect agreement and the modeling presented can recover previous simulations (Lim et al., 2010). However, if the
modulation index increases, i.e. large-signal condition, the small-signal approximation moves away from the exact analysis as shown in Fig. 6b. It can be seen that the increases in a RF power do not improve the performance of the link.
In order to observe the iber optic length (L) in which the RF
power is minimum, this periodic variation, under the condition
Table 1. Typical values of parameters used in the simulation
Parameter description Symbol Value
RF source impedance Zg 50 Ω
RF load impedance ZL 50 Ω
RF power applied to DD-MZM PRF 1 mW
Laser optical power Po 1 mW
Laser wavelength λo 1,550 nm
DD-MZM half-wave voltage V π 5 V
DD-MZM input impedance Z MZM 50 Ω
SSMF iber attenuation @ 1,550 nm
(Corning®, 2002) αdB 0.2 dB/km
SSMF iber chromatic dispersion
@ 1,550 nm (Corning®, 2002) D 17 ps/nm.km
Speed of light in vacuum c 3x10⁸ m/s
PD responsivity
ℜ
0.5 A/Wwith low and equal modulation indexes (m1 = m2 = m << 1) and
fundamental RF frequency (N = 1), can be predicted by Eq. 27:
(
)
2 2
2 1 2
o RF p
Df c
p
L
λ +
= (27)
where p = 0, 1, 2, etc. he dispersion efect exhibits a cyclic behavior and the period length is determined by Eq. 28:
2 2
o RF Df
c
L
λ =
Δ (28)
Similar results were presented considering only the irst
minimum point (Gliese et al., 1996). he inluence of chirp
efect in the iber length in which the RF power is minimum
was observed in Smith et al. (1997).
Based on Eqs. 6 and 22, the authors have been investigating the chirp modeling of DD-MZM as a function of both the splitting ratio and modulation indexes, and the results will be published elsewhere. For instance, the relative detected RF
fundamental power to DC level v e rsus RF, with iber optic
length (L) equals 40 km, for ODSB push-pull (m1 = m2 = m,
θ1 = π, θ2 = π/2), single-arm (m2 = 0, θ1 = π, θ2 = +π/2 and
−π/2), and OSSB (m1 = m2 = m, θ1 = π/2, θ2 = π/2) modulations
are presented in Fig. 7.
It is observed in Fig. 7 that the analytical formulation presented in this paper is in agreement with experimental
results obtained by Han et al. (2003), which the expressions
are in ininite series form. For a single-arm ODSB modulation, the frequency that the detected power is minimized could be
changed by adjusting the bias parameter θ2. he dependence
of the fundamental RF power for the ODSB modulation is strongly afected by the chromatic dispersion and the power is minimized in approximately 10 GHz. his is the so-called notch ilter like behavior. For OSSB modulation, the link exhibits the special feature of RF fundamental power displaying very low sensitivity with respect to both the iber length and the RF. Such unique feature has been
Exact analysis
Small-signal approximation
0
0 20 40 60 80 100 120 140 160 180 200 220 240 -10
-20
-30
-40
-50
-60
-70
Fiber optic lenght (L), km
(a)
Relative detected RF to DC power, dB
Exact analysis
Small-signal approximation
0
0 20 40 60 80 100 120 140 160 180 200 220 240
-10
-20
-30
-40
-50
-60
-70
Fiber optic lenght (L), km
(b)
Relative detected RF to DC power, dB
Figure 6. Detected radiofrequency (RF) fundamental (N = 1)
power normalized to the direct current (DC) level versus
iber length, for exact and small-signal approximations, under conditions: (a) small- (m = 0.2), and (b) large-signals
(m = 1.2). The RF is equal to 10 GHz and uses optical
double sideband (ODSB) modulation (θ1, θ2) = (π, π/2).
Push-pull Single-arm
Single-arm
OSSB
0
0 1 2 3 4 5 6 7 8 9 10 11 12 13 14 15
-10
-20
-30
-40
-50
-60
-70
-80
-90
-100
Relative detected RF to DC power, dB
Frequency (fRF), GHz
(–θ2)
(+θ2)
Figure 7. Detected fundamental radiofrequency – RF (N = 1)
power normalized to the direct current (DC) level versus
widely exploited in practical applications on the subject of microwave photonics, as in aerospace and long-haul iber optical telecommunications (Urick e t a l . , 2011).
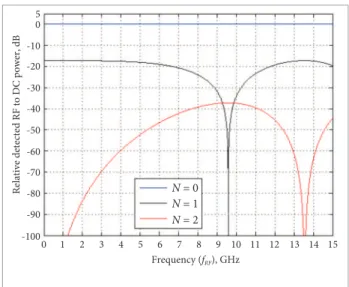
It is important to point out that the principle of energy conservation is obeyed, i.e. in this analysis the fundamental
RF power (N = 1) is minimized in a speciic RF for the
ODSB modulation (θ1, θ2) = (π, π/2), according to Fig. 7.
he energy is transferred to the harmonics of superior orders
(N = 2, 3,…) and DC level (N = 0). he summation of RF
power of all spectral components is the same for each value of RF (or iber optic length). Figure 8 shows the detected RF power v e r s u s RF for N = 0, 1, 2, with iber optic length (L)
equals to 40 km.
In order to be able to better illustrate the effect of the
chromatic dispersion in the RF fundamental (N = 1) power,
it is convenient to analyze its dependence with respect to the length of the fiber. To this aim we first tackled the ODSB
modulation (θ1, θ2) = (π, π/2), and the results are shown in
Fig. 9. As can be seen, irrespective of the RF, the chromatic dispersion results in a periodic variation of the RF power as the fiber length increases. The position along the fiber at which the RF power is minimized depends on the RF. For example, when the RF is 20 GHz, the first minimum occurs at approximately 10 km, whereas for a 10 GHz frequency this is nearly 36 km. Using Eqs. 27 and 28 allows one to calculate the fiber length in which the RF power is minimum.
CONCLUSION
This publication presented a very comprehensive analytical model that enables the analysis of the effect of fiber optic chromatic dispersion in the performance of analog fiber optic link with DD-MZM. The model besides relaying on parameters that suits experimental researchers, also allows one to retrieve important results widely available in the literature. Using some commercial components and devices, we performed numerical simulations that yielded results, which seem to be of practical interest. The authors are working towards designing, implementing, and characterizing fiber link based on the model developed.
ACKNOWLEDGMENTS
To the Electronic Warfare Laboratory at the Instituto Tecnológico de Aeronáutica (ITA) and the Instituto Na- cional de Telecomunicações (INATEL) for their support in this research.
Figure 9. Detected radiofrequency (RF) fundamental (N = 1)
power normalized to the direct current (DC) level versus
iber optic length, with RF as a parameter for optical double sideband (ODSB) modulation (θ1, θ2) = (π, π/2).
N = 0
N = 1
N = 2
0 5
0 1 2 3 4 5 6 7 8 9 10 11 12 13 14 15
-10
-20
-30
-40
-50
-60
-70
-80
-90
-100
Relative detected RF to DC power, dB
Frequency (fRF), GHz
f1 = 10 GHz f2 = 15 GHz f3 = 20 GHz
0 5 10 15 20 25 30 35 40 45 50 55 60
-10 0
-20
-30
-40
-50
-60
-70
-80
-90
-100
Relative detected RF to DC power, dB
Fiber Optic length (L), km
Figure 8. Detected radiofrequency (RF) power normalized to the direct current (DC) level versus frequency, with N = 0
(DC), N = 1 (fundamental) and N = 2 (second harmonic), for
optical double sideband (ODSB) modulation (θ1, θ2) = (π, π/2)
REFERENCES
Abramowitz, M. and Stegun, I., 1965, “Handbook of Mathematical Functions with Formulas, Graphs, and Mathematical Tables”, Dover Publications, New York.
Agrawal, G.P., 2002, “Fiber-Optic Communication Systems”, 3rd edition, John Wiley & Sons, New York.
Capmany, J. et al., 2013, “Microwave Photonic Signal Processing”, Journal of Lightwave Technology, Vol. 31, No. 4, pp. 571-586. doi:10.1109/JLT.2012.2222348.
Cheng, L. et al., 2005, “An Exact Analytical Model for Dispersive Transmission in Microwave Fiber-Optic Links Using Mach-Zehnder External Modulator”, IEEE Photonics Technology Letters, Vol. 17, No. 7, pp. 1525-1527. doi:10.1109/LPT.2005.848563.
Chi, H. and Yao, J., 2008, “Power Distribution of Phase-Modulated Microwave Signals in a Dispersive Fiber-Optic Link”, IEEE Photonics Technology Letters, Vol. 20, No. 4, pp. 315-317. doi:10.1109/ LPT.2007.915653.
Corning®, 2002, “SMF-28™ Optical Fiber Product Information”. Retrieved in April 29, 2013, from http://www.photonics.byu.edu/ FiberOpticConnectors.parts/images/smf28.pdf.
Corral, J.L. et al., 2001, “General expressions for IM/DD dispersive analog optical links with external modulation or optical up-conversion in Mach-Zehnder electrooptical modulator”, IEEE Transactions on Microwave Theory and Techniques, Vol. 49, No. 10, pp. 1968-1976. doi:10.1109/22.954816.
Coutinho, O.L. et al., 2005, “Analysis of analog iber optical links based on DSB+C and SSB+C modulation techniques”, In: International Conference on Microwave and Optoelectronics – SBMO/IEEE MTT-S, pp. 439-443. doi:10.1109/IMOC.2005.1580038.
Coutinho, O.L. et al., 2011, “Uso de redes de comunicações ópticas para transmissão e distribuição de emissores radar”, In: Simpósio de Aplicações Operacionais em Áreas de Defesa – XIII SIGE, São José dos Campos, SP, Brazil.
Essiambre, R.J. et al., 2010, “Capacity limits of optical iber networks”, Journal of Lightwave Technology, Vol. 28, No. 4, pp. 662-701. doi:10.1109/JLT.2009.2039464.
Ferreira Júnior, A.A. et al., 2012, “Effect of iber optic chromatic
dispersion on the performance of analog optical link with dual-drive Mach-Zehnder modulator”, In: Simpósio de Aplicações Operacionais em Área de Defesa – XIV SIGE, pp. 119-126, São José dos Campos, SP, Brazil. Gliese, U. et al., 1996, “Chromatic dispersion in iber-optic microwave and millimeter-wave links”, IEEE Transactions on Microwave Theory and Techniques, Vol. 44, No. 10, pp. 1716-1724. doi:10.1109/22.538964. Han, J. et al., 2003, “Reduction of iber chromatic dispersion effects in iber-wireless and photonic time-stretching system using polymer modulators”, Journal of Lightwave Technology, Vol. 21, No. 6, pp. 1504-1509. doi:10.1109/JLT.2003.812155.
Janner, D. et al., 2008, “Waveguide electro-optic modulation in micro-engineered LiNbO3”, Journal of Optics A, No. 10, pp. 01-06. doi:10.1088/1464-4258/10/10/104003.
Kitano, C. and Oliveira, J.E.B., 2000, “Dispositivos à Óptica Integrada para Aplicações em Telecomunicações”, Revista Telecomunicações, Vol. 3, No. 2, pp. 27-38.
Li, M.J. and Nolan, D.A., 2008, “Optical Transmission Fiber Design Evolution”, Journal of Lightwave Technology, Vol. 26, No. 9, pp. 1079-1092. doi:10.1109/JLT.2008.922150.
Lim, C. et al., 2010, “Fiber-Wireless Networks and Subsystem Technologies”, Journal of Lightwave Technology, Vol. 28, No. 4, pp. 390-405. doi:10.1109/JLT.2009.2031423.
Lim, W. et al., 2009, “Analytical time-domain model for radio over free space optical military communication systems under turbulence channels”, In: IEEE Military Communications Conference – MILCOM 2009, Paper 901734, pp. 1-5. doi:10.1109/MILCOM.2009.5379930. Lin, C. et al., 2008, “Impact of nonlinear transfer function and imperfect ratio of MZM on optical up-conversion employing double sideband with carrier suppression modulation”, Journal of Lightwave Technology, Vol. 26, No. 15, pp. 2449-2459. doi:10.1109/JLT.2008.927160. Morant, M. et al., 2011, “Dual-drive LiNbO
3 interferometric
Mach-Zehnder architecture with extended linear regime for high peak-to-average OFDM-based communication systems”, Optics Express, Vol. 19, No. 26, pp. 450-456. doi:10.1364/OE.19.00B452. Oliveira, J.E.B. et al., 1999, “Trends in photonics applied to electronic warfare at Brazilian airforce”, In: International Microwave and Optoelectronics Conference – SBMO/IEEE MTT-S, pp. 599-602, Rio de Janeiro, RJ, Brazil. doi:10.1109/IMOC.1999.866252. Oliveira, J.E.B. and Ribeiro, J.A.J., 2000, “Interfaces para enlaces de ibra óptica de alta velocidade”, Revista Telecomunicações, Vol. 3, No. 2, pp. 65-75.
Smith, G.H. et al., 1997, “Overcoming Chromatic-Dispersion Effects in Fiber-Wireless Systems Incorporating External Modulators”, IEEE Transactions on Microwave Theory and Techniques, Vol. 45, No. 8, pp. 1410-1415. doi:10.1109/22.618444.
Urick, V.J. et al., 2011, “Long-Haul Analog Photonics”, Journal of Lightwave Technology, Vol. 29, No. 8, pp. 1182-1205. doi:10.1109/ JLT.2011.2119292.
Wandel, M. and Kristensen, P., 2006, “Fiber designs for high igure of merit and high slope dispersion compensating ibers”, Journal of Optical and Fiber Communications Research, Vol. 3, No. 1, pp. 25-60. doi:10.1007/s10297-005-0061-1.
Winzer, P.J. and Essiambre, R.J., 2006, “Advanced Optical Modulation Formats”, Proceedings of the IEEE, Vol. 94, No. 5, pp. 952-985. doi:10.1109/JPROC.2006.873438.
Wu, P.Y. et al., 2011, “An upconverted phase-modulated iber optical CATV transport system”, Journal of Lightwave Technology, Vol. 29, No. 16, pp. 2422-2427. doi:10.1109/JLT.2011.2160330. Yao, J., 2012a, “A tutorial on microwave photonics I”, IEEE Photonics Society Newsletter, Vol. 26, No. 2, pp. 4-12.
Yao, J., 2012c, “Microwave Photonics,” In: IEEE International Workshop on Electromagnetics, Applications and Student Innovation – iWEM, pp. 1-2. doi:10.1109/iWEM.2012.6320333.
Yariv, A. and Yeh, P., 2007, “Photonics: Optical Electronics in Modern Communications”, 6th edition, Oxford University Press,
New York.
Zhang, H. et al., 2012a, “Polarization-modulated analog photonic
link with compensation of the dispersion-induced power fading”, Optics Letters, Vol. 37, No. 5, pp. 866-868. doi:10.1364/ OL.37.000866.