*e-mail: [email protected]
The Effect of Niobium Content on the Hardness and Elastic Modulus
of Heat-Treated Ti-10Mo-Xnb Alloys
Sinara Borborema Gabriela,b,*, Jean Dillec, Carlos Angelo Nunesd, Glória de Almeida Soaresa
a
Metallurgical and Materials Department, Federal University of Rio de Janeiro – UFRJ,
CP 68505, CEP 21945-970, Rio de Janeiro, RJ, Brazil
b
Engineering Department, Center Academical of Volta Redonda – UniFOA,
CEP 27240-560, Volta Redonda, RJ, Brazil
c
Materials Department, Free University of Brussels, CP 194/03, Brussels, Belgium
dMaterials Enginering, Department University of São Paulo – USP,
CP 116, CEP 12600-970, Lorena, SP, Brazil
Received: January 26, 2010; Revised: June 2, 2010
This study has investigated the niobium (Nb) additions effect on both microstructure and heat-treated Ti-10Mo-xNb (x = 3, 6 and 9) alloys mechanical properties. The microstructures were characterized by optical microscopy, X-ray diffraction and transmission electron microscopy. The mechanical characterization was carried out by Vickers microhardness test and Young’s modulus measurements. The outcomes show that the addition of Nb in alloys decreased the proportion of ω and α’ phases. The Ti-10Mo-3Nb alloy presented the best hardness and elastic modulus combination among the three developed alloys and also with respect to Ti-6Al-4V alloy and commercially pure Ti.
Keywords: hardness, microstructure, titanium, ti-alloys
1. Introduction
Ti-based alloys have been widely used as permanent implant materials in the replacement of damaged hard tissues due to their high corrosion resistance, good biocompatibility and good mechanical properties such as high strength and low elastic modulus1, 2. Femoral
stems, spinal cages and dental prosthesis or implants are some examples of the use of titanium alloys.
Titanium alloys can be classified as α, α + β and β-type, according to the phases present in their microstructures. Almost all development aims at a low modulus β-type titanium alloy in order to reduce diseases related to bone resorption in relation to stress shielding. Among the
β-type titanium alloys, metastable β-Ti alloys seem to exhibit the lowest elastic modulus and also meet most of the other requirements for an ideal alloy3-6, such as good corrosion resistance, high tensile
and fatigue resistance.
β-phase stability in titanium alloys can be assessed through the use of the so called molybdenum equivalent [Mo eq]7. If the [Mo eq]
value is higher than 10 or 11 wt. (%)7, 8, β phase is retained during
quenching from temperatures above the β transus in a metastable condition at room temperature. However, if this value is lower, martensitic transformation may occur during quenching, forming either the α’ (hexagonal) or α’’ (orthorhombic) phases, depending on the solute concentration in the alloy9. Moreover, studies have shown
that metastable ω phase (hcp structure) may also precipitate in the
β-Ti matrix during quenching10. As an alloy elastic modulus is mainly
determined by both amount and modulus of its constituent phases11,
the addition of different alloying elements and the combination of solution treatment and/or ageing affect the thermodynamics stability and the kinetic of phase precipitation, and thus should be carefully designed in order to obtain a low modulus alloy. From the literature, it is well known that among the phases normally formed in Ti-based alloys, ω phase presents the highest elastic modulus, followed by
α/α’, α’’ and β phase12. However, studies achieved by Matsumoto
et al.13 showed that α’ phase in Ti-V-Sn alloys had elastic modulus
similar to the metastable β type alloys and lower than ω and α phases. On the other hand, in addition to low modulus, a high mechanical strength is also necessary for the implant alloy. For example, ASTM F1472 standard for wrought Ti-6Al-4V alloy for surgical implants14.
The strengthening of β alloys can be achieved by fine precipitation of either ω or α phase and the refinement of β grains11. Consequently,
an adequate balance of phases precipitated in β alloys can result in a good combination of high strength and low elastic modulus.
Recently, Ti-Mo, Ti-Nb and Ti-Mo-Nb alloys have been considered for biomaterials applications15 - 17. Ho et al.15 investigated a
series of binary Ti-Mo alloys with molybdenum contents ranging from 6 to 20 wt. (%) and reported a minimum of 10 wt. (%) Mo to fully stabilize the β phase in metastable condition at room temperature. Niobium is well known as a biocompatible material and a β stabilizer for titanium alloys and studies have suggested that it can decrease the elastic modulus and increase the strength of Ti-base alloys2.
Thus, in order to contribute to this field of research, this work has investigated the role of niobium contents on the hardness and elastic modulus of three Ti-10wt. (%)Mo-xNb alloys (x = 3, 6 and 9 wt. (%)). The changes on the mechanical behavior arising from Nb addition were correlated with the phases present in the microstructures.
2. Materials and Methods
2.1. Specimen preparations
supplied by EEL/USP, Brazil) metals by arc melting with a tungsten electrode on a water-cooled copper hearth. The alloys were prepared under high purity argon atmosphere (> 99.9999 %), and the ingots were melted five times to improve chemical homogeneity. The obtained ingots were then treated at 950 °C under argon atmosphere for 1 hour in a tubular furnace and then quenched in water at room temperature. This treatment condition was selected based on Gordin et al.18 study of the Ti-12Mo-5Ta alloy.
2.2. Metallography and phase analysis
The phase analysis of the alloys (bulk, polished surface) were carried out by X-ray diffraction (XRD) using a Shimadzu model XRD 6000, Japan, diffractometer operated at 40 kV and 30 mA. A Ni- filtered CuKα radiation (λ =1.5418 Å) was used for this study. The phases were identified through the comparison of the obtained data with simulated diffractograms using the Powdercell program19
inserting the data (space groups, lattice parameters and atomic positions) of the α, α’, ω and β-Ti phases20.
The microstructures of the alloys were also investigated via optical microscopy (OM) [LEICA/DMIRM, Germany], scanning electron microscopy (SEM) [LEO-ZEISS 1450 VP SEM with OXFORD-LYNK EDS, Germany] and transmission electron microscopy (TEM) [Philips CM20, Holland] working under 200 kV. The samples for the OM and SEM analysis were hot mounted in resin, ground by using silicon carbide papers up to 2400 mesh, polished and then etched with Kroll’s reagent (3 mL of HF, 6 mL of HNO3 and 100 mL of H2O). TEM samples were prepared by using a twin-jet electro polisher in a chemical solution with (60 mL) HClO4, (590 mL) methanol and ether monobutylethylene (350 mL) at 35 V and –20 °C.
2.3. Microhardness and elastic modulus measurements
The Vickers microhardness values of the alloys were measured by using a Buehler Micromet 2004 equipment with a 100 gf load for 30 seconds. The Vickers microhardness value of a given alloy is the average of ten measurements.
The Elastic modulus (E) of the alloys was determined by ultrasonic method, measuring the alloys density (ρ) as well as the longitudinal VL and transversal VT sound velocities. A piezoelectric transducer (5 MHz), in contact with the sample via a coupling (honey), was used for such measurement. The Elastic modulus value of a given alloy is the average of ten measurements.
The comparison of values of Vickers microhardness and Elastic Modulus of Ti-10Mo-xNb alloys with commercially pure Ti (grade 2) and Ti-6Al-4V alloy was made by One-way ANOVA statistical analysis (α = 0.05).
3. Results
3.1. Phase analysis
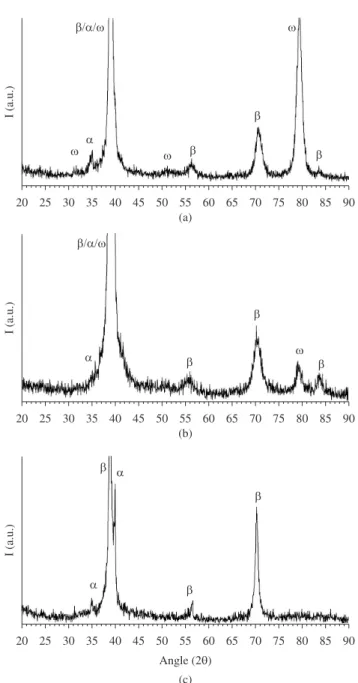
Figure 1 shows the XRD diffractograms of the (a) Ti-10Mo-3Nb, (b) Ti-10Mo-6Nb and (c) Ti-10Mo-9Nb alloys; the highest intense peak in each diffractogram was cut in order to better define the low intense peaks near the background. In addition to β-phase, the α phase was also found to coexist in the alloys. Notice in Figure 1a and b the indication of ω phase in the XRD diffractograms of the Ti-10Mo-3Nb and Ti-10Mo-6Nb alloys. As some α/α’ and α’’ phases reflections are very close and therefore hard to distinguish in the XRD data, TEM analysis was used to identify the possible presence of martensitic phases in the microstructures.
Figure 2 shows micrographs of (a, b) Ti-10Mo-3Nb (SEM), (c, d) Ti-10Mo-6Nb (SEM) and (e, f) Ti-10Mo-9Nb (SEM and OM, respectively) alloys. The adopted heat-treatment could not completely
Figure 1. X-ray diffractograms of the a) Ti-10Mo-3Nb, b) Ti-10Mo-6Nb and c) Ti-10Mo-9Nb alloys.
eliminate the as-cast dendrite structures observed in previous studies17.
This was more visible in the alloy with lower Nb content and is a consequence of the relatively low temperature (950 °C) of heat treatment. A fine acicular martensitic phase was observed in the β
matrix of all alloys, especially on the Ti-10Mo-3Nb [Mo eq = 10.8] alloy (Figure 2b). In the case of Ti-10Mo-6Nb [Mo eq = 11.7] and Ti-10Mo-9Nb [Mo eq = 12.5] alloys, a small amount of martensite was observed and it is clear from the micrographs that the amount of
α martensite decreases for higher Nb contents. This is in agreement with the fact that Nb additions increase the [Mo eq] and, therefore, the phase stability.
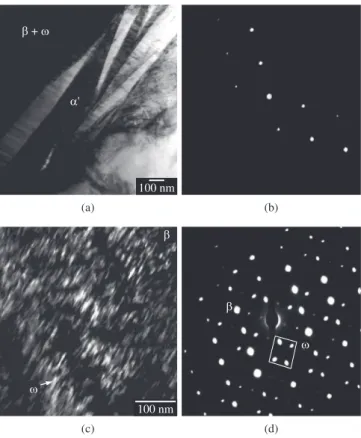
Figure 3a shows a bright-field TEM micrograph of the Ti-10Mo-3Nb alloy, where an acicular phase is observed in the β
Figure 2. Micrographs of alloys: a, b) Ti-10Mo-3Nb (SEM); c, d) Ti-10Mo-6Nb; and e, f) Ti-10Mo-9Nb (SEM and OM, respectively) alloys.
Figure 3.TEM data of Ti-10Mo-3Nb alloy: a) image of the martensitic α’ lamellas in an β matrix; b) SAED pattern (001) plane of α’; c) image of the precipitates with a near-spherical morphology in an β matrix; and d) SAED pattern showing β and ω phases.
as shown in Figure 3c, confirmed by the SAED data in Figure 3d. The precipitation of this phase in Ti-Mo, Ti-V and Ti-Nb alloys after quenching from the β field8 with either cubical (Ti-V alloys)
or ellipsoidal morphology (Ti-Mo and Ti-Nb alloys)1, 21 has been
reported by other authors. This ω phase morphology variation has been associated to the differences in lattice mismatch between the β
and ω phases in the different alloy systems20. Notice that these TEM
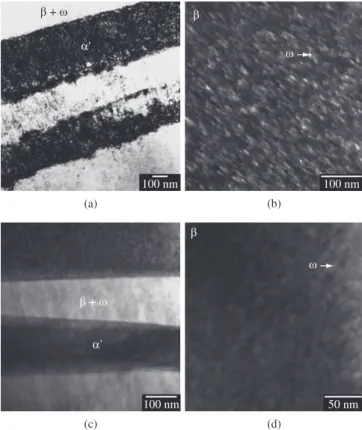
results are consistent with the previously shown XRD data. TEM images of Ti-10Mo-6Nb (Figure 4a and b) and Ti-10Mo-9Nb (Figure 4c and d) alloys also revealed acicular α’ phase and athermal
ω phase distributed within the β matrix, but increasing Nb content; the volumetric fraction of ω phase is reduced.
Combining the XRD, OM and TEM data, it is possible to conclude that the microstructures of the alloys are strongly dependent on their Nb contents, once α’ phase and athermal ω phase volume fraction decrease for higher Nb, in line with the role of Nb as a β stabilizer in these alloys.
3.2. Mechanical properties
Young’s moduli values of the studied alloys are plotted in Figure 5 as a function of Nb contents together with the results for commercially pure Ti (grade 2) and Ti-6Al-4V alloy. Results of ANOVAstatistical analysis (α = 0.05) showed that the Ti-10Mo-3Nb alloy presented the smallest modulus value while the modulus of Ti-10Mo-6Nb and Ti-10Mo-9Nb alloys were similar between them. ANOVA results also indicated that the alloys Ti-10Mo-6Nb (122 GPa) and Ti-10Mo-9Nb (120 GPa) modulus values were statistically equivalent to those of commercially pure Ti (121 GPa) and Ti-6Al-4V alloy (124 GPa).
Figure 5. Elastic modulus of Ti10Mo-xNb, Ti6Al4V and CP-Ti determined by ultrasonic method.
Figure 6. Microhardness of CP-Ti and Ti-10Mo-3Nb, Ti-10Mo-6Nb, Ti-10Mo-9Nb, Ti-6Al-4V alloys.
Figure 4. a) TEM dark-field image of the martensitic α’ lamellas in an β
matrix of the Ti-10Mo-6Nb; b) bright-field image of the ω precipitates with a near-spherical morphology in Ti-10Mo-6Nb; c) TEM dark-field image of the martensitic α’ in Ti-10Mo-9Nb alloy; and d) bright-field image of the ω
precipitates with a near-spherical morphology in Ti-10Mo-9Nb.
elastic modulus among all the phases in Ti alloys12. Matsumoto et al.13
showed that α’ phase in Ti-V-Sn alloys had elastic modulus which were similar or lower than the metastable β type alloys and lower than ω and α phases. The combination of high proportion of α’ in the
β matrix of the Ti-10Mo-3Nb alloy led to the lowest modulus among the three alloys. However, this value is still high when compared with other β Ti alloys and should be related to the presence of ω (high modulus) in this alloy13.
Figure 6 shows Ti-10Mo-xNb (x = 3, 6 and 9), Ti-6Al-4V alloys hardness values and commercially pure Ti determined by Vickers microhardness. Vickers microhardness values of the Ti-10Mo-3Nb, Ti-10Mo-6Nb and Ti-10Mo-9Nb alloys were statistically similar to the Ti-6Al-4V alloy and higher than that of commercially pure Ti.
4. Discussion
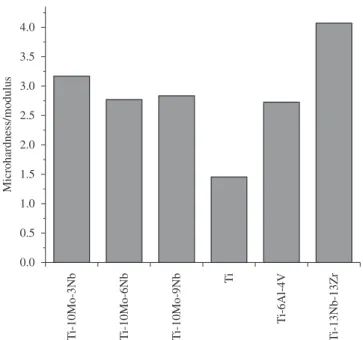
The results indicate that the precipitation sequence in these solution treated alloys proceeds via different mechanisms depending of alloy composition, thereby resulting in different microstructures. Ideal metallic biomaterials for a hard tissue are required to have not only an excellent corrosion resistance and biocompatibility but also a high strength and low-elastic modulus which is close to that of a human bone (10–30 GPa)12. As a barometer to evaluate the performance
of biomaterials with low Young’s and high hardness (associated with mechanical strength) for bone implants, the ratio of hardness to modulus was used. Figure 7 shows the hardness to modulus ratio of Ti-10Mo-xNb alloys in the conditions solubilized with commercially pure Ti (cp Ti), Ti-6Al-4V and Ti-13Nb-13Zr alloys15. The highest
Figure 7. Ratio of hardness to Young’s modulus of Ti10Mo-xNb, Ti-6Al-4V, Ti-13Nb-13Zr alloys and CP-Ti.
5. Conclusions
The increase in niobium additions from 3 to 9 wt. (%) to Ti-10Mo-xNb alloys heat treated at 950 °C / 1 hour and quenched results in the β-structure stabilization, thus decreasing the proportion of the ω and α’ phases. Consequently, the Ti-10Mo-3Nb alloy presented the best combination of high hardness with low elastic modulus.
Acknowledgements
This work was supported by CNPq (140032/2005-3), FAPERJ and CAPES. We would like to thank Prof. João Marcos Rebello from the Non-Destructive Testing Laboratory (PEMM/COPPE/UFRJ) for the ultrasound experiments.
References
1. Kim HY, Ikehara Y, Kim JJ, Hosoda H and Miyazaki, S. Martensitic transformation, shape memory effect and superelasticity of Ti-Nb binary alloys. Acta Materialia. 2006; 54:887-891.
2. Li SJ, Yang R, Li S, Hao YL, Cui YY, Niinomi M and Guo ZX. Wear characteristics of Ti-Nb-Ta-Zr and Ti-6Al-4V alloys for biomedical applications. Wear. 2004;257:869-876.
3. Hanada S, Matsumoto H and Watanabe S. Wear characteristics of Ti-Nb-Ta-Zr and Ti-6Al-4V alloys for biomedical applications.
International Congress Series. 2005;1284:239-247.
4. Banerjee R, Nag S and Fraser HL. A novel combinatorial approach to the development of beta titanium alloys for orthopaedic implants. Materials
Science and Engineering C. 2005; 25:282-289.
5. Zorn G, Lesman A and Gotman I. Oxide formation on low modulus Ti45Nb alloy by anodic versus thermal oxidation. Oxide Surface &
Coatings Technology. 2005; 201:612-618.
6. Ivasishin OM, Markovsky PE, Semiatin SL and Ward CH. Aging response of coarse-and fine-grained β titanium alloys. Materials Science and
Engineering A. 2005; 405:296-305.
7. Mythili R, Thomas Paul V, Saroja S, Vijayalakshmi M and Raghunathan VS. Study of transformation behavior in a Ti-4.4Ta-1.9Nb alloy. Materials
Science and Engineering A. 2005; 390:299-312.
8. Laheurte P, Eberhardt A and Philippe MJ. Influence of the microstructure on the pseudoelasticity of a metastable beta titanium alloy. Materials
Science and Engineering A. 2005; 396:223-230.
9. Kim H, Lim S, Yeo I and Kim W. Stress induced martensitic transformation of metastable β-titanium alloy. Materials Science and Engineering A. 2007; 449-451:322-325.
10. Ping DH, Cui CY, Yin FX and Yamabe-Mitarai Y. TEM investigations on martensite in a Ti-Nb-based shape memory alloy. Scripta Materialia. 2006;54:1305-1310.
11. Matsumoto H, Watanabe S and Hanada S. Microstructures and mechanical properties of metastable β TiNbSn alloys cold rolled and heat treated.
Journal of Alloys and Compounds. 2007;439:146-155.
12. Zhou YL and Niinomi M. Microstructures and mechanical properties of Ti-50mass%Ta alloy for biomedical applications. Journal of Alloys and
Compounds. 2008; 466:535-542.
13. Matsumoto H, Watanabe S and Hanada S. α’ Martensite Ti-V-Sn alloys with low Young’s modulus and high strength. Materials Science and
Engineering A. 2007; 448:39-48.
14. ASTM International. ASTM F1472 – 08 Standard specification wrought Titanium-6Aluminum-4Vanadium alloy for surgical implant Applications. ASTM; 2008.
15. Ho WF, Ju CP and Chern JH. Structure and properties of cast binary Ti-Mo alloys. Biomaterials. 1999; 20:2115-2122.
16. Hon YH, Wang JY and Pan YN. Composition/Phase Structure and Properties of Titanium-Niobium alloys. Materials Transactions. 2003; 44:2384-2390.
17. Gabriel SB, Nunes CA and Soares GA. Production, Microstructural Characterization and Mechanical Properties of Ti-10Mo-xNb alloys.
Artificial Organs. 2008; 32(4):299-304.
18. Gordin DM, Gloriant T, Nemtoi GH, Chelariu R, Aelenei N, Guillou A et al. Synthesis, structure and electrochemical behavior of a beta Ti-12Mo-5Ta alloy as new biomaterial. Materials Letters. 2005; 59:2959-2964.
19. Kraus W and Nolze GJ. Powdercell – a program for the representation and manipulation of crystal structure and calculation of the resulting X-ray powder patterns. Journal applied Crystallography. 1996; 29:301-303. 20. Villars P and Calvert LD. Pearson’s handbook of crystallographic data
for intermetallic phases. 2nd ed. Ohio: Metals Park; 1991.