ISSN 1517-7076 artigo 11747, pp.817-826, 2016
Corresponding Author : Mlader Stancic Received on: 10/11/2015 Accepted on: 29/07/2016
10.1590/S1517-707620160003.0076
Washing treatment impact on print quality
of screen printed knitted fabrics
Mladen Stančić 1
, Branka Ružičić 1, Nemanja Kašiković 2 Dragana Grujić3
, Dragoljub Novaković 2, Rastko Milošević 2
1
University of Banja Luka, Faculty of Technology, Department of Graphic Engineering, Vojvode Stepe Stepanovića 73, 78 000, Banja Luka, Bosnia and Herzegovina
e-mail: [email protected] 2
University of Novi Sad, Faculty of Technical Sciences, Department of Graphic Engineering and Design, Trg Dositeja Obradovića 6, 21 000, Novi Sad, Serbia
3University of Banja Luka, Faculty of Technology, Department of Textile Engineering, Vojvode Stepe Stepanovića 73,
78 000, Banja Luka, Bosnia and Herzegovina
e-mail: [email protected]; [email protected]; [email protected]; [email protected]; [email protected]
ABSTRACT
The surface of textile materials is highly textured, commonly in non-uniform ways. Because of this texture effect, textile surface appears rougher and more porous than other printing substrates, which can cause excessive ink penetration during printing process. Next, washing process is very important factor because it influences ink characteristics on printed samples as well as structural changes of the textile substrate. The aim of this paper is to determine the influences of washing process and different mesh tread count used for printing on print quality. This will be obtained by using spectrophotometric analysis, and GLCM image processing method for print mottle estimation. The results of this research show that increasing number of washing processes leads to higher color differences reproduction color in comparison to printed materials before washing. It also shows that textile surface texture has a great influence on print mottle as well as that number of washing treatment series can generate variations of solid-tone print uniformity.
Keywords: cotton, different thread count, GLCM, spectrophotometric analysis, series of washing process.
1. INTRODUCTION
818 change (air permeability, tearing resistance, rigidity). It was revealed that washing treatment causes color changes [10]. The extent of washing process impact on textile materials are conditioned by “mechanical” factors (items being rubbed together by movement within a washing machine, or in the course of being hand-washed), washing temperature, the level of water mineralization, as well as the duration of these factors presence. Modern laundry detergents contain a wide range of additives and enhancing ingredients such as bleaching agents and their enzyme activators as well as color-transfer inhibitors all of which could influence the change in the color of a textile [11]. Printing process control mostly consists of color reproduction monitoring. The color reproduction can be characterized using the CIE L*a*b* color coordinates and spectral reflectance curves. CIE L*a*b* coordinates enable color differences estimation between samples, or between samples and standards. Color differences determination is based upon calculations of the differences of color space coordinates (ΔL, Δa, Δb) [12]. There are many systems which have improved color differences estimation in different ways for particular experimental dataset, in chronological order, were JPC79 [13], CMC [14], BFD [15], CIE94 [16] and CIEDE2000 [17]. In particular, CIEDE2000 is the currently recommended formula by the CIE. Color difference (ΔE2000) is defined by the equation [18]:
(1)
In the equation (1) ΔE2000 is the color difference value, and other parameters are obtained by computation of coordinates L*, a*, b*, with L* representing an achromatic attribute and a* and b*, respectively, red-green and yellow-blue chromatic attributes. Colorants such as pigments or dyestuffs of an object reflect some, permeate some and select and absorb some of light wavelengths. In each wavelength, the amount of reflecting and permeating light can be measured. This forms spectral curve which is a color characteristic of the object. Relative reflecting curves are practically like the fingerprint of the color. Therefore spectral reflectance data in each wavelength of the color are given as a numeric list and the color communication is provided easily by means of a data system through using this list [19].
In this research, the attention was placed on color reproduction and print mottle analysis. Print mottle or solid-tone print uniformity usually occurs in the manner of systematically structured patterns which the human vision system notices very easily due to its perfect responsiveness for pattern detection [20]. Causes of print mottle are various, for example: inadequate printing pressure, printing speed, high printing substrate surface roughness, poor ink transfer and uneven absorption, etc. [21]. Print mottle assessment in this research was conducted with the aid of GLCM (Grey Level Co-occurrence Matrix) image processing method, also known as the gray level spatial dependence matrix. It is a table that keeps track of how often different combinations, pairs of pixel intensities (gray level values), occur in a specific spatial relationship and distance in an analyzed image [22]. It was found that following GLCM parameters: contrast, correlation, entropy, energy and homogeneity can be used for print mottle assessment [22, 23]. Low contrast, low correlation, low entropy, high energy and high homogeneity correspond to uniform gray level distribution, i.e., indicate a uniform, smooth surface [22, 24]. Energy and entropy parameters correlate very well with the visual ranking of the cyan printed samples so they, according to these findings, have a good potential to be used as predictors of solid-tone print uniformity [22]. GEBEJEŠ, et al. [25] find that entropy parameter correlates the best with human texture perception and if the entropy value is high, particular texture becomes more visible and noticeable. Therefore it can be concluded that higher entropy value suggests stronger texture pattern which is perceived easier. Correlation determines a linear dependency of grey levels on those of neighboring pixels, and it is quite different calculation from the other texture measures described above. As a result, it is independent of them (gives different information) and can often be used profitably in combination with another texture measure. It also has a more intuitive meaning to the actual calculated values: 0 is uncorrelated, 1 is perfectly correlated [26].
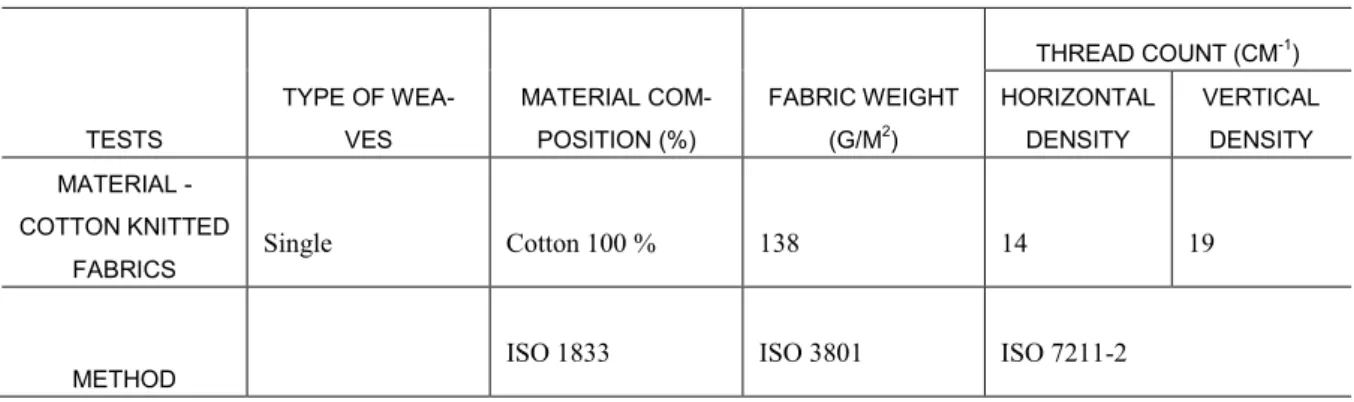
819 2. MATERIALS AND METHODS
For the experimental part of the research, cotton based textile material was used. Material characterization was done according to following standards: material composition (ISO 1833), fabric weight (ISO 3801) and thread count (ISO 7211-2). These properties are presented in Table 1.
Table 1: Characteristics of material used in testing
TESTS
TYPE OF WEA-VES
MATERIAL COM-POSITION (%)
FABRIC WEIGHT (G/M2)
THREAD COUNT (CM-1)
HORIZONTAL DENSITY
VERTICAL DENSITY MATERIAL -
COTTON KNITTED FABRICS
Single Cotton 100 % 138 14 19
METHOD
ISO 1833 ISO 3801 ISO 7211-2
The special test chart was developed using Adobe Illustrator CS 5 application. The test chart size was 297 x 420 mm and it consisted of various elements for print quality analysis. Areas sized 2.54 x 2.54 cm, 100% tone values of cyan process color were analyzed. The samples were printed using screen printing technique, M&R Sportsman E Series six-color printing machine. PAN, et al. [27] found that four main parameters have a crucial effect on screen print quality. These parameters were kept constant during the printing of all samples. Printing speed was 15 cm/sec; squeegee hardness was 80 Shore Type A, printing pressure 275.8 x 10³ Pa and 4 mm snap-off distance. Sericol Texopaque Classic OP Plastisol (OP215) ink was used. Ink fixation was done under the temperature of 160o C, with the exposure time of 150 seconds.
Printing form was made using printing screen mesh counts of 90, 120, 140 and 160 threads per cm on aluminium tubing frames (58 x 84 cm). Size of the stencil, without frame, was 50 x 76 cm. Conventional exposure was conducted using linear positive films. The optical density of transparent areas of the film was 0.3 and 4.1 of the opaque areas. Film liniature was five times smaller than printing screen mesh count. Photosensitive Sericol Dirasol 915 emulsion was used. Light exposure was done using metal-halogen UV lamp (1000 W) at a 1 m distance from the mesh. Exposure time for each stencil was calculated using control tape Autotype Exposure Calculator by Sericol Company. Light exposure time for each stencil is represented in Table 2.
Table 2: Exposure time of stencils
THREAD COUNT
(THREADS/CM)
LIGHT EXPOSURE
TIME (MIN)
90 3
120 2,6
140 1,6
160 1,3
The samples were treated according to ISO 105-C10:2006 standard [28]. The process was repeated 10 times on washing temperature on 90 °C. All the print quality parameters as well as colorfastness to washing were measured repeatedly four times: before washing treatment, after first, fifth and tenth washing treatment.
820 SpectroDens (Illumination types D50, standard observer angle 2º, measurement geometry 0o/45o, measurement aperture 3 mm). Measurements were repeated 10 times for each printed sample and the results are presented as a mean value. Samples were scanned using a flatbed scanner Canon CanoScan 5600F.
Scanning resolution was set to 600 spi without auto correction function. Image elements of the significance to this measurement were saved as separate TIFF files and they were analyzed afterwards. Scanned samples were subjected to GLCM analysis for obtaining quantitative solid-tone print uniformity results.
Applied MATLAB function proposed by UPPULURI [29] provides information about 22 GLCM parameters, out of which the most relevant and used in literature, as well as in this investigation are: contrast, correlation, entropy, energy and homogeneity as suggested in references [22, 24, 30]. Those five parameters should be interpreted as follows: low values of contrast, correlation and entropy parameters, while high values of energy and homogeneity parameters correspond to a uniform grey level distribution, indicating a uniform solid-tone print surface [22, 24].
3. RESULTS AND DISCUSION
3.1 Color reproduction analysis
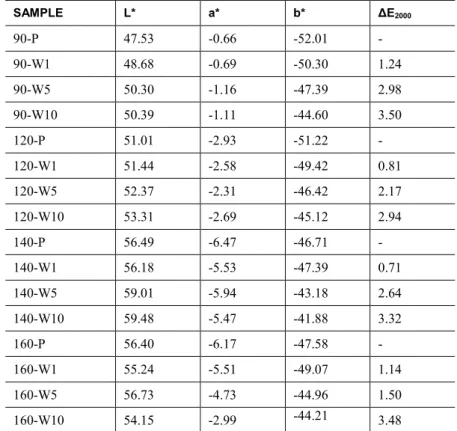
Measured spectrophotometric data is determined by the CIE L*a*b* color coordinates after the printing process, and after subjecting samples to series of washing processes. The obtained values are presented in Table 3. When calculating the color differences (ΔE2000) as reference values were taken L*a*b* values of printed samples, and in relation to them have been calculated values of color differences after each series of washing.
Table 3: CIE L*a*b* color coordinates and color differences (ΔE2000) before and after series of washing treatment
SAMPLE L* a* b* ΔE2000
90-P 47.53 -0.66 -52.01 -
90-W1 48.68 -0.69 -50.30 1.24
90-W5 50.30 -1.16 -47.39 2.98
90-W10 50.39 -1.11 -44.60 3.50
120-P 51.01 -2.93 -51.22 -
120-W1 51.44 -2.58 -49.42 0.81
120-W5 52.37 -2.31 -46.42 2.17
120-W10 53.31 -2.69 -45.12 2.94
140-P 56.49 -6.47 -46.71 -
140-W1 56.18 -5.53 -47.39 0.71
140-W5 59.01 -5.94 -43.18 2.64
140-W10 59.48 -5.47 -41.88 3.32
160-P 56.40 -6.17 -47.58 -
160-W1 55.24 -5.51 -49.07 1.14
160-W5 56.73 -4.73 -44.96 1.50
160-W10 54.15 -2.99 -44.21 3.48
Note: Numbers 90/120/140/160 represent the thread count; P is a mark of the printed sample; W1 denotes the sample after first washing treatment, W5 de-notes the sample after fifth washing treatment and W10 dede-notes the sample after tenth washing treatment.
821 of washing treatments were conducted, after which the spectral curves were created. By this the influence of printing screen thread count and washing treatment on the printed surface reflection characteristic was observed. Figure 1 presents spectral curves of the samples printed using different thread counts, before and after washing treatment. According to figure 1, it can be noted that spectral curve shapes remain the same for each sample printed using all four thread counts. Unchanged form of the curves indicates that washing treatment resulted in insignificant change of tone of the color, whereby only change of intensity of the reflected light occurred, which is the result of brightening of printed color.
This can be explained by the fact that during the washing process of the knitted fabric, wash off of the ink (pigment) particles which absorb the light occurs. Thus, a higher amount of light is being reflected from the surface of the sample, and a higher amount of reflected light the human eye perceives as a lighter shade of color. At the same time, all samples showed insignificant changes of spectral reflection after subsequent washing treatment, comparing to previous sample results. Those changes, although small, make difference after multiple washing treatments.
Summing the result of spectral curve analysis up, it can be concluded that increased number of washing treatments provoke the rise of spectral reflection for samples printed using all mesh counts. This is due to washing off of the ink from the substrate surface, which evoke higher light reflection from the material surface.
Figure 1: Spectral curves after printing and washing treatments of the samples printed using different thread counts: a) 90 threads/cm, b) 120 threads/cm, c) 140 threads/cm, d) 160 threads/cm. Note: Numbers 90/120/140/160 represent the thread count; P is a mark of the printed sample; W1 denotes the sample after first washing treatment, W5 denotes the sample after fifth washing treatment and W10 denotes the sample after tenth washing treatmentOne or more appendixes can be used to describe the details of the experimental arrangement, manufacturing or mathematical developments used along the work.
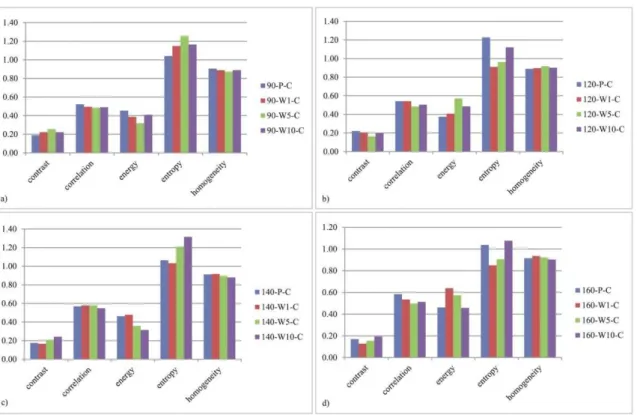
3.2 Print mottle analysis
822 Figure 2: Cyan samples printed with 90/120/140/160 threads/cm mesh comparison: a - sample scanned after printing, b - sample scanned after first washing treatment, c - sample scanned after fifth washing treatment, d - sample after tenth washing treatment.
In Figure 3 are presented results of GLCM Matlab function application on scanned samples. According to the results, all samples have low contrast, correlation, while energy and high entropy and homogeneity parameters which lead to conclusion that these samples have high surface non-uniformity. It is noticeable that for each sample the highest value possesses GLCM parameter entropy, so it can be concluded that cotton knitted fabrics have strong texture pattern, easily perceptible.
There are noticeable changes on GLCM parameters values after subjecting samples to washing processes as well. In the figure 3a are presented results of samples printed with 90 thread/cm mesh, which show decrease of printed surface uniformity after subjecting samples to washing process. There is a rising trend of contrast and entropy parameters and decreasing trend energy and homogeneity parameters after the first washing treatment. After the fifth washing treatment, values of contrast and entropy parameters continue to increase while energy and homogeneity parameters continue to fall, which leads to even higher amount of surface non-uniformity.
Then after the tenth washing treatment GLCM parameters trends changed, values of contrast and entropy parameters dropped, while energy and homogeneity rose, which resulted in a higher print uniformity than after the fifth washing treatment of same samples. It can be assumed that a certain number of washing treatments results in an uneven wash off effect of the ink particles from the material surface, which generates more pronounced mottle. However, after the following few washing treatments, results of print uniformity show certain improvements, which may be a cause of leveling out of ink amount on the substrate surface, decreasing that way previously produced uneven wash off effect.
On the other side, figure 3b show results of samples printed using 120 thread/cm mesh, and here the opposite results can be noticed. They indicate that after the first washing treatment value of contrast parameter falls while energy and homogeneity rise, which results in higher print uniformity. This trend continues after the fifth washing treatment and then goes in opposite direction after the tenth washing treatment. It can be assumed that by thread count increase, a lower amount of ink penetrates into the textile substrate, which produces a more uniform ink layer. Wash off which occurs with the first washing treatment leads to increase of print uniformity. After the fifth washing treatment print uniformity continuously grows, but after subsequent washing series it, more wash off occurs and print uniformity starts to drop. Figures 3c and 3d show GLCM analysis results for samples printed with 140 threads/cm and 160 threads/cm respectively.
These two data sets have identical trend. Contrast and entropy values dropped and energy and homogeneity values rose after the first washing, but after the fifth this trend became opposite, i.e., contrast and entropy parameters rise while energy and homogeneity parameters decreased. After the tenth washing treatment results of contrast and entropy parameters continue to rise and energy and homogeneity parameters continue to drop. For both of these results sets it can be assumed that meshes with higher thread count transfers lower amount of ink on textile substrate.
823 Figure 3: GLCM parameters comparison for samples printed with different thread count, subjected to series of washing treatments: a) 90 thread/cm, b) 120 thread/cm, c) 140 thread/cm, d) 160 thread/cm. Note: Numbers 90/120/140/160 repre-sent the thread count; P is a mark of the printed sample; W1 denotes the sample after first washing treatment, W5 denotes the sample after fifth washing treatment and W10 denotes the sample after tenth washing treatment.
Lightness (L*) coordinate values, of the CIE L*a*b color space, were predicted using linear multiple regression analyses method. Energy and entropy values were used as independent variables in analyses. Statistical analysis indicated that there was a linear relationship between these GLCM parameters and lightness parameter. The linear multiple regression analysis equation was obtained and shown in Table 4 and Table 5 for samples printed with 90 thread/cm mesh and samples printed with 120 thread/cm mesh respectively.
Table 4: Multiple linear regression coefficients for the obtained mathematical model that determine dependence of light-ness parameter L* on Energy and Entropy parameters for samples printed with 90 thread/cm mesh
L* = -2.105 + 34.95 * ENG + 32.676 * ENT
Multiple
regression
coefficient
Std. Error
of the
Estimate
b0 = -2.105 b1 = 34.95 b2 = 32.676
Std.
Error t p
Std.
Error t p
Std.
Error t p
R2 s
13.209 -0.159 0.879 12.281 2.846 0.014 7.388 4.423 0.001 0.770 0.721
Table 5: Multiple linear regression coefficients for the obtained mathematical model that determine dependence of light-ness parameter L* on Energy and Entropy parameters for samples printed with 140 thread/cm mesh
L* = 120.311 – 70.726 * ENG – 29.742 * ENT
Multiple
regression
coefficient
Std. Error
of the
Estimate
b0 = 120.311 b1 = - 70.726 b2 = - 29.742
Std.
Error t p
Std.
Error t p
Std.
Error t p
R2 s
824 It can be seen from equations in table 4 and 5 that Energy and Entropy parameters can determine the lightness parameter value. For the samples printed with 120 and 160 thread/cm meshes, results of multiple linear regression mathematical model did not give statistically reliable dependence of lightness parameter L* on energy and entropy parameters as texture features of the original image.
4. CONCLUSIONS
After analysis of washing treatment effects on print quality parameters of cotton material, certain conclusions can be made. The aim of the investigation was to compare the same printed samples before and after washing treatments, in order to reveal in what extent this affects color reproduction and the uniformity of printed solid-tone area. Spectrophotometric analysis shows that color reproduction difference exist after each washing treatment and rise after each following washing treatment. From spectral reflectance analysis results it can be concluded that tone of the color of the printed ink using all four mesh tread counts remained pretty the same, which indicated the same shape of the spectral curves. All samples showed insignificant changes of spectral reflection values after each subsequent washing treatment. But those changes, although small, make difference after the fifth and the tenth washing treatment. This is due to washing off of the ink from the material surface, which evoke higher light reflectivity of the material surface.
Based on the print mottle analysis results, all the samples have low values of contrast, correlation and energy parameters on the one side, and high values of entropy and homogeneity. This leads to conclusion that these samples have high print non-uniformity. It can be noted that the highest value possesses parameter entropy for all samples, so it can be concluded that cotton knitted fabrics have “strong” texture pattern, easy to perceive. Also, there are noticeable changes on GLCM parameters values after subjecting samples to washing processes. Increase of the washing treatments number leads to an uneven wash off of the ink from the material surface which results in the change of print uniformity. By increasing the thread count of a mesh the poorer ink coverage is accomplished, which leads to poor print uniformity. Therefore after washing treatment is done a washing off of the areas with more ink occurs and the uniformity of the printed surface grows. After more washing treatments, ink continues to wash off from the samples and print uniformity drops. Statistical results of multiple linear regression mathematical model gave statistically reliable dependence of lightness parameter L* on energy and entropy parameters as texture features of original image with a high value of the coefficient of multiple regression for samples printed with 90 and 140 thread/cm, R2 = 0.77 and R2 = 0.81.
In order to broaden current knowledge in this scientific area, our plan is to conduct investigations that include washing treatment influence on different textile material substrates, which will provide insight into effect of structural characteristics of a textile substrate material on print quality. Future research should be directed to utilization of different process colors, different washing process temperatures, another printing technique (e.g. ink-jet) as well as introduction of pre-treatment of textile materials, which may provide better results.
5. ACKNOWLEDGMENTS
The research is supported by Ministry of education, science and technology development of Republic of Serbia, project number: 35027 “Development of software model for scientific and production improvement in graphic industry” and project CEEPUS III RS-0704-03-1516, “Research and Education in the Field of Graphic Engineering and Design”.
6. BIBLIOGRAPHY
[1] GRUJIĆ, D.Influence of fabric properties of thermal physiological comfort of clothing, Degree Ph.D., University of Maribor, Faculty of Mechanical Engineering, Maribor, Republic of Slovenia, 2010.
[2] ONAR ÇATAL, D., ÖZGÜNEY, A. T., AKÇAKOCA KUMBASAR, E. P. “The influence of rheological properties of the pretreatment thickeners on ink-jet printing quality”, Tekstil ve Konfeksiyon, v. 22 , n. 4, pp. 309-316, 2012.
[3] KAŠIKOVIĆ, N., NOVAKOVIĆ, D., KARLOVIĆ, I., et al., “Influence of ink layers on the quality of
ink jet printed textile materials”, Tekstil ve Konfeksiyon, v. 22, n. 2, pp. 115-124, 2012.
[4] KIATKAMJORNWONG, S., PUTTHIMAI, P., NOGUCHI, H. “Comparison of textile print quality between inkjet and screen printings”, Surface Coatings International Part B: Coatings Transactions, v. 88, n. 1, pp. 25-34., 2005.
825
Films, v. 516, n. 21, pp. 7875-7880, 2008.
[6] KREBS, F., JØRGENSEN, M., NORRMAN, K., et al., “A complete process for production of flexible
large area polymer solar cells entirely using screen printing - First public demonstration”, Solar Energy Materials and Solar Cells, v. 93, n. 4, pp. 422-441, 2009.
[7] STANČIĆ, M., NOVAKOVIĆ, D., TOMIĆ, I., et al., “Influence of Substrate and Screen Thread Count
on Reproduction of Image Elements in Screen Printing”, Acta Graphica, v. 23, n. 2, pp. 1-12, 2012. [8] GEMCI, R., KURT, M., SOLAK, H. H., et al., “Printing of cellulose-based fabrics with sodium
hydroxide and investigating color efficiency and fastness properties of these fabrics”, Tekstil ve Konfeksiyon, v. 22, n. 3, pp. 240-247, 2012.
[9] STANČIĆ, M., KAŠIKOVIĆ, N., NOVAKOVIĆ, D., et al., “Thermal load effect on print quality of ink
jet printined textile materials”, Journal of Graphic Engineering and Design, v. 4, n. 2, pp. 27 – 33, 2013. [10] STANČIĆ, M., KAŠIKOVIĆ, N., NOVAKOVIĆ, D., et al., “The influence of washing treatment on screen printed textile substrates”, Tekstil ve Konfeksiyon, v. 24, n. 1, pp. 96 – 104, 2014.
[11] WAS-GUBALA, J. “The kinetics of colour change in textiles and fibres treated with detergent solutions Part I - Colour perception and fluorescence microscopy analysis”, Science and Justice, v. 49, n. 3, pp. 165-169, 2009.
[12] KOČEVAR, N. T.“Kolorimetrijska analiza i vizuelna ocjena boja na dvobojnoj tkanini”, Tekstil, v. 55, n. 3, pp. 127 – 134, 2006.
[13] MCDONALD, R. “Industrial pass/fail color matching. Part III - development of a pass/fail formula for use with instrumental measurement of color difference”, Journal of the Society of Dyers and Colourists, v. 96, pp. 486-497, 1980.
[14] CLARKE, F. J. J., MCDONALD, R., RIGG, B. “Modification to the JPC79 Colour–difference Formula”, Journal of the Society of Dyers and Colourists, v. 100, pp. 128–132, 1984.
[15] LUO, M. R., RIGG, B., “BFD (l:c) colour-difference formula Part 1- Development of the formula”,
Journal of the Society of Dyers and Colourists, v. 103, pp. 86–94, 1987. [16] CIE Publication 116 CIE Central Bureau, Vienna 1995
[17] CIE Publication 142 CIE Central Bureau, Vienna 2001
[18] LUO, M. R., CUI, G., RIGG, B. “The development of the CIE 2000 colour-difference formula: CIEDE2000”, Color Research and Application, v. 26, pp. 340–350, 2001.
[19] IKIZ Y., KESKIN R., “Fastness and PF/3 evaluations of reactive dyestuffs”, Scientific Research and Essays, v. 6, n. 7, pp. 1498-1506, 2011.
[20] PETERSSON, J., A Review of Perceptual Image Quality, BSc thesis, Department of Science and Technology, Linkoping University, Norrkoping, Sweden, 2005.
[21] KAWASAKI, M., ISHISAKI, M., TAPPI, http://www.tappi.org/content/06IPGA/5-4%20Kawasaki%20M%20Ishisaki.pdf. Accessed in November 2015.
[22] HLADNIK, A., LAZAR, M., “Paper and board surface roughness characterization using laser
profilometry and gray level cooccurrence matrix”, Nordic Pulp and Paper Research Journal, v. 26, n. 1, pp. 99-105, 2011.
[23] FAHLCRANTZ, C., On the Evaluation of Print Mottle, Degree Ph.D., School of Computer Science and Communication, Stockholm, Sweden, 2005.
[24] CHEN, Y., Image analysis methods for paper formation evaluation, Degree Ph.D., University of Toronto, Canada, 1998.
[25] GEBEJEŠ, A., TOMIĆ, I., HUERTAS, R.,et al., “A preliminary perceptual scale for texture feature parameters”, In: Proceedings of the 6th International Symposium on Graphic Engineering and Design,
Faculty of Technical Science, pp. 195-202, Novi Sad, Serbia, 2012.
[26] DUTTA, R., STEIN, A., PATEL, N. R., “Delineation of diseased tea patches using mxl and texture based classification”, ISPRS Archives, v. 37, pp. 1693-1700, 2008.
[27] PAN, J., TONKAY, G., QUINTERO, A., “Screen printing process design of experiments for fine line printing of thick film ceramic substrates”, In: Proceedings of International Symposium on Microelectronics, pp. 264-269, San Diego, California, USA, 1998.
826 soda and soda, International Organization for Standardization, Geneva, 2006.
[29] MATHWORKS,. http://www.mathworks.com/matlabcentral/fileexchange/22187-glcm-texture-features Accessed in November 2015.