Resumo
A separação magnética industrial tem ganhado força com o advento de equipamento contínuo com alto gradiente de campo. A recuperação magnética de hematita contida em lamas espessadas é aqui discutida, a partir de ensaios comparativos em escala-piloto com três separadores de alto gradiente, simulando a adoção de um circuito de esgotamento (seguido de limpeza do concentrado). Dois separadores magnéticos de rotor em anel horizontal (tipo carrossel) - rotulados como W1 e W2 - e um de rotor em anel vertical e pulsante (marcado como V) foram testados em cotejo, separadamente. Rejeito típico de lama de usina de beneiciamento no Quadrilátero Ferrífero (Minas Gerais, Brasil) foi empregado como alimentação do circuito. O melhor desempenho foi a máquina W2, com intensidade de campo magnético de 1,2 T, sob concentração mássica de 35% na alimentação e pressão de água de lavagem dos médios igual a 300 kPa. O mais indicado para a subsequente etapa de limpeza foi o emprego de campo de 1,2 T, gerando concentrado contendo 5,48% de SiO2, com 62,75% de recuperação mássica. Como se vê, os resultados mostraram-se promissores, acenando para o detalhamento de novos estudos, a im de se enfrentarem desaios análogos ocorrentes na prática industrial, num contexto de intensa atividade de mineração em região sabidamente de recursos minerais tão vastos, resultando em ganhos no aproveitamento econômico e na minoração de impactos ambientais decorrentes de operações de baixa recuperação metalúrgica.
Palavras-chave: Separação magnética de alto gradiente, minério de ferro, separação magnética a úmido.
Abstract
Magnetic separation has gained force with the advent of high gradient and ield intensity continuous machines. A comparative pilot study was realized in order to magnetically recover hematite from a typical slime thickener underlow of a mill plant from Quadrilátero Ferrífero (Minas Gerais, Brazil). Two rotor (carrousel) high gradient magnetic separators (tagged as W1 and W2) and one vertical ring and pulsating high gradient magnetic separator (tagged as V) were tested. The best option was the machine W2 with ield of 1.2 T, feed mass concentration of 35 %, and middlings lush water of 300 kPa. The more indicated for the cleaner step is the use of a magnetic ield of 1.2 T, generating a concentrate with 5.48% of SiO2 and 62.75% of mass recovery. So, the relevance of this research also stems from the fact that it can subsidize other studies in order to face analogous problems in this context of intense mining activities in a region of such vast mineral resources.
Keywords: High gradient magnetic separation, iron ore, wet magnetic separation.
Maximiliano Batista da Silva Universidade Federal de Ouro Preto, Campus do Morro do Cruzeiro [email protected]
José Aurélio Medeiros da Luz Universidade Federal de Ouro Preto, Campus do Morro do Cruzeiro [email protected]
Magnetic scavenging of
ultraine hematite from itabirites
Concentração magnética esgotadora
de ultrafinos itabiríticos
1. Introduction
As an industrial operation, magnetic separation gained force with the advent of continuous equipment capable of pro-ducing high gradients of ield intensity. It succesfully separates paramagnetic materials mixed with diamagnetic ones because there is suficient granulation and particle liberation; i.e. enhancement of itabirite ines concentration, puriication of alumina, bauxites, calcarium, feldspate, quartz sand, etc. (Daniels, 1989). Aiming to reach high magnitude ield gradients, equipment able to produce high tempera-ture superconductivity has recently been applied (Ciesla, 1992).In addition, there is the separation of oxygen and nitrous oxide from gas luxes (Zwick et al., 1989). Lundt (n.d) pointed to a typical value of
1.000.000 A/m2 as the caracteristic cur-rent density of these superconductors.
On high gradient magnetic separa-tors, the hydrodynamic resistence to the passage of the poulp through the gap depends on its geometrical coniguration, specially its empty fraction (through where it is supposed to lush the non-magnetic poulp). In opposition, the existence of corners and edges favours the magnitude of local gradients because of the converig-ing ield; which, in general, supposes a high index of tortuosity and, thus, a high hydrodynamic resistence. As pointed out by Lundt, the best situation is that which conciliates these two opposite effects.
On the speciic ambit of iron ore, magnetic separation is completed with
lotation. Usually, high intensity magnetic separation generates major initial invest-ment costs. But these operational costs are minor when compared to those for lotation, which consumes reagents that normally present restrictions for their disposition within the environmental surroundings of the enterprise. As an additional advantage, magnetic separa-tion requires less trainning of employees because it is easier to operate.
As far as iron ore is concerned, sin-ter feed and pellet feed are often dressed by high intensity magnetic separation, especially in the case of itabirite, a kind of banded iron formation (BIF) with al-ternating exhalative quartz and sediments of iron oxide.
2. High intensity magnetic separation
There are different types of mag-netic separators, whereby each one of them can be adjusted to a limited number of applications. The choice is inluenced by several factors; and depending on how the equipment is articulated (i.e. type of lush and type of magnetic ield source), it is possible to mount several arrangements that can be applied to dif-ferent contexts and materials. So, a good application depends a lot on experience.
The particle dimension and the magnetic properties of the material to be treated are the most important variables that determine the choice of the magnetic separation technique; bearing in mind that, according to the context, an ap-propriate magnetic separation technique must be chosen.
In regards to processing capacity, speciically for wet high intensity mag-netic separators produced by Gaustec,
Luz (2010) developed the following equa-tion to forecast the producequa-tion capacity when using medium-grade iron ore from
Quadrilátero Ferrífero (a region in Minas Gerais, Brazil). Using all SI units, the referenced equation furnishes the value of feeding mass low in function of the separator carousel diameter and gap open-ing of the ferromagnetic matrix (for the mathematical condition that the carousel diameter is inferior to 4 m):
Q
a= 380. d
0,48. a
0,4984 - d
(1)
( )
Where:
Qa – mass low feeding of material with two carrousels [kg/s];
a – effective opening of the grooved plates (gap) [m];
d – diameter of the carrousel [m].
Wet high intensity magnetic separators
According to Viana Jr (1980), Wills (2006), Lawver and Hopstock (1974), from a technical-economical point of view, the development of high gradient magnetic separators was one of the most important facts for mineral processing (though generally in literature, lotation is attributed irst place when considering positive impacts on mineral technol-ogy). This type of separator can treat a signiicant amount of paramagnetic and diamagnetic ore mass particles, separating them. It is outstanding that this equipment has a high recovery yield with iron ore having fractions below 75 µm.
The high gradient magnetic separa-tor (more known as Jones) produced by
Eriez, whose constructive and working principle is nowadays used by many other types of wet separators (for example, in Brazil, the equipment produced by Gaustec), has the following basic elements: energizing coil; working ring (or carrousel) which turns around a horizontal plane between the poles created by the coils; and magnetic gaps with cracks or interstices through which the treated pulp is lushed. These gaps have a geometric coniguration with adequate format (corners, grooves, wires, or stings) promoting a strong magnetic ield gradient. When being fed, the magnetic particles are attracted by the walls of the gap, while those which are non-magnetic are promptly carried to the
collection and discharge chutes. When the rotor reaches areas beyond the magnetic lush, a pressurized water lush occurs; depositing on the chute the material pre-viously apprehended by the cracks of the gaps, where the material was collected when exposed to the magnetic ield. There also are manners in which to lush water at the point in which the material is exposed to the ield (middlings wash water, used to carry diamagnetic materials).
Jr., 1980) in the application of a relatively uniform magnetic ield on a ferromagnetic
structure that can have a trapezoidal, bar, groove, steel-wool, or sphere format that
generate ield gradients. (Svodoba, 1987, 2004).
Vertical ring and pulsating high gradient magnetic separator
The commercially known Verti-cal Ring and Pulsating High Gradient Magnetic Separator (VRPHGMS) was developed to overcome the disadvantages of the traditional type of horizontal ring high intensity magnetic separator (Wet High Intensity Magnetic Separator),
equipment successfully applied for de-cades to recover low-content iron ore (and other minerals) in several mineral processing plants in China (Zeng, 2003). The concept VKMSis an evolution of VMS, but with a pulsation system in-corporated in the equipment to improve separation eficiency.
The Vertical Ring and Pulsating High Gradient Magnetic Separator (SLon) was developed in 1988 in China and it proved to be eficient and safe, as
discussed by Xiong Da-he (2000). Used on large scale in China, it is found in more than 30 plants of ore treatment, among them: Meishan Iron Ore Mine (major applier of SLon in China); and Qi Dashan Mineral Processing Plant (Liao Ning prov-ince) (SVOBODA, 2004). Nowadays, this equipment is not installed on an industrial scale in Brazil.
The working principle of this equip-ment: an electromagnetic ield is generated inside the separation zone; 1) a rotational carrousel on its horizontal axle shelters the matrixes; 2) the pulp is placed in the feed-ing box and goes to the separation zone; 3) the magnetic particles of the pulp are attracted to the surface of the matrixes; 4) transported from the separation zone to the top of the carrousel; 5) it is now out of
the separation zone, where the magnetic ield does not act on it and this collected magnetic material is washed and unloaded into the concentrate box; and 6) on the other hand, while the matrix is still at the separation zone, the gravity and the pulp hydrodynamic force of pulsation drag the non-magnetic particles from inside the matrixes to the tailings box. (Xiong, Wenqing, 2003).
Silva (2011) applied essays on a semi-industrial-scale VRPHGMS with an ultraine hematite feeding capacity of seven tons per hour. The results veriied that the percentage of solids is important for the selectivity of the process. In addi-tion, the results for the pulsation impacts were positive and in accordance with the speciications of the manufacturer.
3. Materials and methods
The material used on the essays was the slime thickener underlow of an iron ore treatment mill from Quadrilátero Fer-rífero. The characterization of the focused feeding is summarized in Tables 1 and 2.
Based on the data presented by the tables above, it is noticeable that: the
silica, main contaminant, is found totally freed of iron minerals; the material is not favorable for ultra-ines lotation because it presents specular hematites, martites and goethite; the material is favorable for high intensity magnetic separation because of its low contents of magnetite
and its high liberation of silica. Picnometry with helium was also realized, obtaining the speciic mass of 3.330 kg/m³.
Aiming to evaluate the technical applicability of ine iron ore recovery on the slime thickener underlow using the technology (yet to be applied on
indus-Table 1
Grade of quartz liberation.
Table 2
Chemical and mineralogical characteristics of the feeding.
Mesh (mm) QL QM GL
-1.000 + 0.150 384 1 99.7
-0.150 + 0.075 435 0 100.0
-0.075 + 0.053 344 0 100.0
-0.053 + 0.037 374 0 100.0
(QL = free quartz. QM = mixed quartz. GL = liberation grade).
Chemical analysis by size
mm Weight
( % ) Al2O3 FeT MnT NaOH P PPC SiO2 CaO MgO MnO2 FeO TiO2 BaO
0.15 18.85 2.5 28.18 0.13 0.00 0.11 2.38 53.7 0.1 1.91 0.00 1.33 0.36 0.00 0.75 28.99 2.5 28.18 0.13 0.00 0.11 2.38 53.7 0.1 1.91 0.00 1.33 0.36 0.00 0.53 24.35 0.9 29.37 0.4 0.00 0.5 1.2 55.4 0.1 0.74 0.00 1.58 0.22 0.00 0.37 27.82 0.77 36.96 0.5 0.00 0.14 1.5 44.4 0.1 0.68 0.00 0.83 0.3 0.00 -0.37 0.00 0.00 0.00 0.00 0.00 0.00 0.00 0.00 0.00 0.00 0.00 0.00 0.00 0.00 Global 1.1 5.33 32.89 0.44 0.00 0.48 5.68 37.66 0.1 4.27 0.00 0.61 0.8 0.00
Mineralogical analysis
mm Weight
( % ) HE HL HG HMic HS HC’s HM MA GO GT QL QM MN CA GB MI
trial scale) of magnetic separation, three magnetic separators were tested. From now on, these machines will be named W1, W2 and V.
W1 and W2 are pilot units (car-rousel) with capacity up to ive tons per hour of dry feeding on the larger crack gap. They reach ield intensities of 1.5 T. The equipment W2 is similar to equipment W1. And the equipment V (Vertical Ring and Pulsating High Gradient Magnetic Separator) is a pilot machine with a feed-ing capacity of 250 kg/h (dry basis).
Three operational parameters have been explored for W1 e W2: magnetic ield intensity; middlings lush water pressure; and mass solids concentration on feed-ing. And for the equipment V: magnetic ield, pulsation frequency and mass solids concentration on feeding were explored. The levels of the variables were deined according to the following Table (3).
Then, 36 essays for the rougher stage were executed in each machine (with the aim of providing good mass recovery).
So, 108 essays (36 x 03 per equipment) have been executed. Three samplings were generated by each essay: concentrate, mid-dlings and tailings. These samplings were packed into buckets and immediately iden-tiied in loco. Each sampling was weighed wet, dewatered in a pressure ilter, oven-dried, and weighed again.
The main contaminants of: Al2O3. SiO2 and P have been analyzed by atomic emission of inductively coupled plasma (ICP). The iron (Fe) has been quantiied by the wet titration method. The per-formance evaluation parameters used were: metallurgical recovery, pondered eficiency and the classic selectivity index of Gaudin, as displayed by the Table 4.
The concept of pondered eficiency (a relationship between metallurgical recovery and mass recovery) was applied to compare three different machines. As the maximum recovery of iron is the aim of the process, the following weights were used: α=2 e β=1, with priority for metal-lurgical recovery.
Each sample was homogenized and subjected to wet particle size analy-sis (screen apertures: 500 µm, 300 µm, 212 µm, 150 µm, 75 µm, 63 µm, 53 µm, 45 µm, and 37 µm). The undersize fraction in 37 μm was not studied here.
The samplings were homogenized in rifle splitter, ground in ring mill, analyzed for total iron (FeT) by oxy-reduction volu-metric analysis with automatic titration; FeO by volumetric analysis with attack in inert atmosphere; loss on ignition (LOI) by thermo-gravimetrical method applying furnace. The levels of: Al2O3. Mn, P, CaO, MgO, SiO2 and TiO2 were determined by sampling fusion on platinum crucible and acid attack, followed by spectrometry of atomic emission - ICP (inductively coupled plasma). The fractions over 35 μm were sent for mineralogical analysis. A relected light optical microscope (model Leica DMLP) with magniication up to 200 times was used for this analysis. It was observed that the major part of mineral in those fractions was quartz.
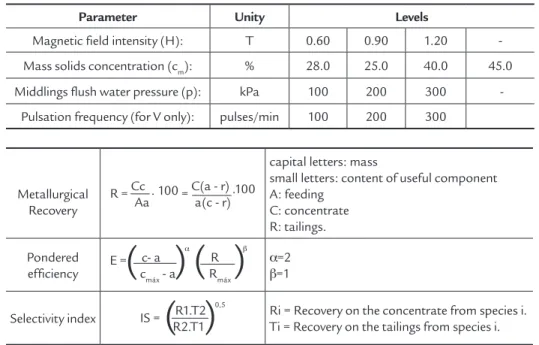
Parameter Unity Levels
Magnetic ield intensity (H): T 0.60 0.90 1.20
-Mass solids concentration (cm): % 28.0 25.0 40.0 45.0 Middlings lush water pressure (p): kPa 100 200 300
-Pulsation frequency (for V only): pulses/min 100 200 300
Table 3 Resume of experiment plan:
equipments W1, W2 and V.
Metallurgical Recovery
R = Cc . 100 = C(a - r) .100 Aa a(c - r)
capital letters: mass
small letters: content of useful component A: feeding
C: concentrate R: tailings.
Pondered
eficiency E = c- a α
R β cmáx - a Rmáx
α=2
β=1
Selectivity index IS = R1.T2
0,5
R2.T1
Ri = Recovery on the concentrate from species i. Ti = Recovery on the tailings from species i.
( )
( ) ( )
Table 4 Parameters for performance evaluation.
4. Results and discussion
Tables 5, 6 and 7 present the results of the chemical analysis for the complex Fe/SiO2 displaying the values of the re-sponse variables for the equipment studied by the essays. In table 5, it can be observed that essay 13 (H = 0.9 T, Mc = 25% and middlings water pressure, p = 100 kPa) obtained a mass recovery of 70.82%, and metallurgical recovery of 83.28%. It must be pointed out that the execution of essay 7 presented errors, obtaining a metallurgi-cal recovery superior to 100%.
The following codiication was used
on the tables presented below: N - essay number; H - ield intensity (T); Cm - mass solids concentration; p - middlings lush water pressure; Rm - mass recovery; R – metallurgical recovery; SiO2 - silica on concentrate; Fe_a - total iron on feeding; fe_c - total iron on concentrate; fe_r – total iron on tailings; IS – selectivity index of Gaudin; Ep – weighted eficiency.
Table 6 displays that essay 30 (ield = 1.2 T, cm = 30 % and middlings lush water pressure = 300 kPa) obtained a mass recovery of 57.18%, and the metallurgical
recovery of 78.28%. It must be observed that: the execution of essay 29 presented errors, obtaining a metallurgical recov-ery superior to 100%; and that essay 20 presented problems in tailings sampling, resulting in a mass and metallurgical re-covery equal to 100%.
N H [T]
Cm [%]
p [kPa]
Rm [%]
R [%]
SiO2 [%]
Fe_a [%]
Fe_c [%]
Fe_r [%] IS
Ep [%]
1 0.6 25.0 100 19.27 35.30 19.22 27.73 50.79 22.25 0.32 5.74 2 0.6 25.0 200 34.74 54.42 19.96 33.55 52.55 23.58 2.87 9.44 3 0.6 25.0 300 24.62 43.59 17.30 29.91 52.95 22.25 2.09 8.13 4 0.6 30.0 100 44.39 44.39 24.31 44.98 44.98 24.90 1.60 0.00 5 0.6 30.0 200 34.77 52.55 20.18 31.90 48.21 23.58 2.11 6.37 6 0.6 30.0 300 14.02 13.81 34.65 33.68 33.17 31.17 0.33 0.00 7 0.6 35.0 100 77.82 102.23 29.42 29.66 38.96 21.40 - 4.14 8 0.6 35.0 200 47.37 60.64 27.31 32.96 42.19 24.61 1.54 2.94 9 0.6 35.0 300 45.03 60.30 24.17 33.83 45.30 24.90 1.93 4.53 10 0.6 45.0 100 44.68 60.44 32.86 26.22 35.47 13.47 0.56 1.99 11 0.6 45.0 200 47.45 53.30 34.47 31.00 34.82 26.80 0.58 0.46 12 0.6 45.0 300 34.37 41.46 33.21 30.17 36.40 26.40 0.64 0.84 13 0.9 25.0 100 70.82 83.28 23.20 39.41 46.34 26.80 4.03 3.63 14 0.9 25.0 200 48.76 66.87 20.66 35.13 48.18 23.75 3.28 6.83 15 0.9 25.0 300 14.74 4.83 70.61 37.38 12.25 21.10 - 8.75 16 0.9 30.0 100 23.18 19.74 43.31 30.03 25.58 21.69 - 0.29 17 0.9 30.0 200 33.15 48.37 28.10 28.91 42.18 22.57 1.08 3.46 18 0.9 30.0 300 57.26 74.26 26.58 33.08 42.90 22.44 2.17 4.05 19 0.9 35.0 100 49.89 66.49 30.87 28.88 38.49 18.84 0.93 2.72 20 0.9 35.0 200 13.07 18.09 24.39 33.04 45.74 31.25 1.20 1.54 21 0.9 35.0 300 53.73 66.51 28.61 32.03 39.65 23.69 1.58 2.16 22 0.9 45.0 100 13.44 9.59 34.22 32.54 33.95 31.83 1.13 0.02 23 0.9 45.0 200 42.40 48.23 37.32 28.90 32.88 25.79 - 0.40 24 0.9 45.0 300 64.33 69.30 35.59 31.05 33.44 26.45 0.60 0.24 25 1.2 25.0 100 21.29 16.78 45.42 28.10 22.15 22.61 - 0.43 26 1.2 25.0 200 30.12 46.89 24.34 28.54 44.44 25.30 2.06 4.43 27 1.2 25.0 300 10.05 7.10 40.80 34.99 24.72 21.63 - 0.86 28 1.2 30.0 100 33.50 43.19 36.63 25.88 33.37 22.45 - 0.96 29 1.2 30.0 200 41.18 52.08 34.02 28.46 35.99 23.34 0.56 1.35 30 1.2 30.0 300 25.36 18.65 47.95 29.45 21.65 23.08 - 0.94 31 1.2 35.0 100 35.50 31.19 46.03 25.74 22.61 25.64 - 0.18 32 1.2 35.0 200 47.30 44.90 45.36 25.99 24.67 31.02 - 0.04 33 1.2 35.0 300 61.19 69.67 33.45 31.00 35.29 24.78 1.02 0.74 34 1.2 45.0 100 50.96 59.19 32.94 31.29 36.35 26.37 1.04 0.87 35 1.2 45.0 200 35.11 39.27 40.00 28.65 32.05 26.58 - 0.24 36 1.2 45.0 300 52.83 55.93 36.39 29.47 31.20 27.73 - 0.10
Table 5
Recovery of Fe content on the experiments realized in W1 separator.
Table 6
Recovery of Fe content on the experiments realized in W2 separator.
N H
[T] Cm [%]
p [kPa]
Rm [%]
R [%]
SiO2 [%]
Fe_a [%]
Fe_c [%]
Fe_r [%] IS
Ep [%]
1 0.6 25.0% 100 54.47 55.74 28.16 38.49 39.39 21.69 1.19 0.04% 2 0.6 25.0% 200 50.46 46.54 16.04 57.78 53.30 20.01 1.86 6.78% 3 0.6 25.0% 300 47.53 68.67 18.35 33.30 48.11 18.91 2.52 7.74% 4 0.6 30.0% 100 56.20 74.57 17.47 38.64 51.27 23.11 4.28 9.12% 5 0.6 30.0% 200 50.23 69.91 15.06 39.25 54.62 23.91 3.93 12.55% 6 0.6 30.0% 300 26.13 45.41 15.69 31.21 54.24 23.24 2.35 9.21% 7 0.6 35.0% 100 42.90 63.38 14.80 37.08 54.78 24.08 2.95 12.40% 8 0.6 35.0% 200 34.34 55.51 13.61 34.76 56.19 23.95 2.95 12.70% 9 0.6 35.0% 300 31.88 50.79 18.27 32.49 51.76 22.49 1.75 8.41% 10 0.6 45.0% 100 53.91 62.95 15.70 45.70 53.36 19.54 2.51 5.35% 11 0.6 45.0% 200 28.99 50.94 16.17 30.47 53.54 21.05 2.06 9.87% 12 0.6 45.0% 300 31.75 53.25 16.35 29.88 50.12 20.47 2.12 8.08% 13 0.9 25.0% 100 47.54 70.23 14.93 36.51 53.94 20.72 3.46 12.88% 14 0.9 25.0% 200 20.56 39.66 13.18 29.27 56.45 22.23 2.23 9.16% 15 0.9 25.0% 300 37.47 58.34 14.00 35.69 55.56 23.78 3.32 12.57% 16 0.9 30.0% 100 37.51 60.14 14.24 34.63 55.52 22.09 3.03 13.09% 17 0.9 30.0% 200 33.47 56.29 12.30 34.30 57.68 22.54 3.30 14.36% 18 0.9 30.0% 300 38.51 60.54 14.17 35.50 55.80 22.78 3.30 13.34% 19 0.9 35.0% 100 40.11 47.36 14.43 46.26 54.63 20.24 2.02 4.98%
20 0.9 35.0% 200 100.00 100.00 13.65 55.98 55.98 - 0.00%
Figure 1 represents the curves of cleaner step using equipment W2: mass recovery, percentage of SiO2 in the concen-trate, and percentage of Fe in the tailings. The used feeding was the concentrate of essay 33, which obtained the best results. It can be observed that both the mass recovery and the percentage of SiO2 on the concentrate are directly proportional to the magnetic ield intensity, obtaining its maximum for the essay in 1.2 T. The maximum mass recovery was 82.86%. And the greatest percentage of SiO2 in the concentrate was 9.4%. But as the magnetic ield intensity increases, a decrease of iron on the tailings occurs (as displayed in the
graph): varying from 65.12% to 0.3 T; and 60.49% to 1.2 T.
It can be veriied that, in comparison to the feeding, there is a major portion of ines in the concentrate. The typical min-eral assembly and the size and chemical analysis justify the statement given above for the distribution of the total iron (FeT) on the iner granule-metrical range. The equipment W1 presented tendency to major pondered eficiency, to minor mass concentration values, and low intensity of magnetic ield; not depending on mid-dlings lush water pressure.
Table 7 displays that the essay 34 (ield = 1.2 T. cm = 45% and middlings
lush water pressure = 100 kPa) obtained mass recovery of 81.14%, and metallurgi-cal recovery of 89.57%.
The equipment W2 obtained a major pondered efficiency of 35% for mass recovery (according to the information of the manufacturer) and high ield intensities. Operational parameters were not signiicant in the performance of equipment V; generat-ing, for all essays, a pondered eficiency of 5% to 10%.
Essay 33 using equipment W2 (with a magnetic ield of 1.2 T, mass concen-tration of pulp of 35%, and middlings lush water pressure equal to 300 kPa)
Table 7 Recovery of Fe content on the experiments realized in V separator.
N H
[T] Cm [%]
p [kPa]
Rm [%]
R [%]
SiO2
[%]
Fe_a [%]
Fe_c [%]
Fe_r [%] IS
Ep [%]
1 0.6 25.0% 100 53.89 70.31 17.82 40.47 52.80 24.80 3.93 9.40% 2 0.6 25.0% 200 48.16 67.28 15.12 39.14 54.67 22.23 3.35 12.20% 3 0.6 25.0% 300 41.38 49.16 15.13 45.57 54.13 25.01 3.12 5.08% 4 0.6 30.0% 100 32.03 25.40 36.58 36.33 28.81 25.44 2.61 1.60% 5 0.6 30.0% 200 43.13 59.29 18.84 37.19 51.13 25.47 6.11 7.79% 6 0.6 30.0% 300 33.96 51.97 15.17 35.05 53.65 25.13 5.05 9.62% 7 0.6 35.0% 100 55.41 63.36 17.94 45.37 51.88 22.55 1.45 3.87% 8 0.6 35.0% 200 53.31 70.48 17.46 39.40 52.10 21.33 1.70 9.18% 9 0.6 35.0% 300 58.00 75.39 15.21 42.38 55.09 24.84 2.07 12.28% 10 0.6 45.0% 100 40.80 56.91 17.53 37.01 51.63 25.70 1.40 8.01% 11 0.6 45.0% 200 61.47 75.42 17.38 41.91 51.42 26.74 2.20 7.04% 12 0.6 45.0% 300 36.66 55.89 15.01 35.70 54.43 23.53 1.58 10.93% 13 0.9 25.0% 100 43.31 59.64 20.29 35.25 48.54 23.51 2.36 6.33% 14 0.9 25.0% 200 44.02 60.07 21.03 35.55 48.51 21.78 2.03 6.23% 15 0.9 25.0% 300 36.71 56.69 16.07 34.56 53.38 22.14 2.59 10.35% 16 0.9 30.0% 100 64.58 76.99 19.96 41.17 49.08 26.74 4.04 4.86% 17 0.9 30.0% 200 68.96 80.55 21.01 40.85 47.72 25.60 4.01 3.83% 18 0.9 30.0% 300 61.41 76.31 17.99 40.86 50.77 25.08 3.61 7.11% 19 0.9 35.0% 100 56.21 74.37 19.00 37.31 49.36 20.85 1.63 7.64% 20 0.9 35.0% 200 39.84 57.43 19.19 34.53 49.78 23.36 1.17 7.36% 21 0.9 35.0% 300 47.31 66.52 17.80 35.83 50.38 19.85 1.49 8.58% 22 0.9 45.0% 100 41.01 56.60 19.25 34.96 48.25 25.72 1.40 5.90% 23 0.9 45.0% 200 44.62 60.00 21.00 35.82 48.16 25.87 1.12 5.82% 24 0.9 45.0% 300 58.40 43.25 18.44 67.33 49.87 24.51 1.22 2500.56% 25 1.2 25.0% 100 40.64 57.77 20.00 34.80 49.47 23.04 2.26 7.06% 26 1.2 25.0% 200 36.94 42.15 20.21 42.64 48.66 23.31 1.67 1.79% 27 1.2 25.0% 300 40.52 58.99 17.22 35.37 51.49 21.72 2.64 8.78% 28 1.2 30.0% 100 49.29 62.86 20.49 37.85 48.27 27.72 2.42 5.18% 29 1.2 30.0% 200 53.59 67.91 20.18 38.66 48.99 26.73 4.14 5.82% 30 1.2 30.0% 300 51.45 66.72 17.97 39.28 50.94 26.93 3.27 7.41% 31 1.2 35.0% 100 49.02 63.41 20.99 36.60 47.35 26.27 0.99 5.08% 32 1.2 35.0% 200 35.25 52.34 20.77 31.58 46.90 20.73 0.86 5.60% 33 1.2 35.0% 300 39.74 57.52 20.13 33.32 48.22 21.07 1.02 6.56% 34 1.2 45.0% 100 81.14 89.57 19.23 44.62 49.25 20.61 2.70 2.70% 35 1.2 45.0% 200 35.17 49.16 20.56 34.23 47.85 26.84 - 5.10% 36 1.2 45.0% 300 43.49 59.89 18.92 35.37 48.71 25.11 1.99 6.45%
Figure 1 Graphic from cleaner step of the
Equipment W2: mass recovery, percentage of SiO2 in the concentrate, and percentage of Fe in the tailings.
Concentrate_Rougher 1,2 T
Concentrate_Cleaner 1,2 T
% Rec. Massa % SiO Conc.2 % Fe Rej.
Concentrate_Cleaner 1,0 T
Concentrate_Cleaner 0,8 T
Concentrate_Cleaner 0,6 T
Concentrate_Cleaner 0,3 T 0,00
10,00
11,76 19,36
9,4 8,28 6,68 5,48 5,12
47,78 65,12 62,75
62,15 60,49
57,61
82,86
63,50
64,59 72,80
78,12
presented the greatest percentage of pon-dered eficiency. Both the mass recovery and the percentage content of SiO2 on the concentrate are directly proportional to
the magnetic ield intensity in the cleaner step. The maximum mass recovery was 82.86%; and the greatest percentage content of SiO2 in the concentrate was
9.4%. As expected, the increasing of the ield intensity lowers the content of iron in the tailings: varying from 65.12% to 0.3 T and from 60.49% to 1.2 T.
5
. Conclusions
The best option to concentrate the iron from the slime thickener is to adopt the equipment similar to W2 in the rough-er step with a ield intensity of 1.2 T, mass concentration of 35% in the feeding, and middlings lush water pressure of 300 kPa. A magnetic ield of 1.2 T is advisable for the cleaner step, generating a concentrate with 5.48% of SiO2 and 62.75% of mass recovery.
The hypothetical adoption of the parameters proposed by this research would allow a typical plant (receiving 2.5 Mt/year run of mine with an iron content of 45%, metallurgical recovery of 82%, and production line of 1.6 Mt/year with operational eficiency of 85%) to treat 20 t/h of underlow from the slime thickner. That would imply an extra recovery of 6.29 t/h of a concentrate having 5.48%
of SiO2, and with a global mass recovery of 31.48%. This recovery potential would reduce tailings by 46,760 t/year, and could strengthen production and minimize environmental impacts. So, the relevance of this research also stems from the fact that it can furnish data for other studies in order to face analogous problems in this context of intense mining activities in a region of such vast mineral resources.
6. References
CIESLA, A. Application of superconducting magnets to magnetic separation: some selected aspects. Magnetic and Electrical Separation, v. 3, p. 219-240, 1992. DANIELS, E. J. Industrial application for HTSCs. In: VOLSKY, A. M. et al. (Ed.).
Applied Superconductivity. Park Ridge: Noyes Data. 1989, p. 121-128. 365 p.
DAHE, X. W. The latest application of SLon vertical ring and pulsating high-gradient magnetic separator. Minerals Engineering, n 16. Amsterdam: Elsevier, 2003. p.563-565.
HEARN, S. B., DOBBINS, M. N. SLon magnetic separator: A new approach for recovering and concentrating iron ore ines. In: MONTREAL ENERGY & MINES, Montreal, April 29- May 2, 2000. Disponível em: http://www.outotec. com/36175.epibrw. Acesso 01.12.2010.
LUNDT, J. High gradient magnetic separation as a means of water puriication. LUZ, J. A. M. Parametrização de separação magnética de alto gradiente (chamada:
produtividade em pesquisa 2010). Ouro Preto: Departamento de Engenharia de
Minas - UFOP, 2010. 16 p.
MARTINS, A. H. Análise estatística de experimentos. Belo Horizonte: Curso de Pós-Graduação de Engenharia Metalúrgica e de Minas da UFMG, 2009. (Monograia). XIONG, D. SLon magnetic separator applied to upgrading iron concentrate. In:
PHYSICAL SEPARATION IN SCIENCE AND ENGINEERING, 2. Amsterdam: Elsevier, 2003. p. 63-69.
ZWICK, S. A. et al. Potencial for magnetic separation of gases from gases. In: VOLSKY, A. M. et al. (Ed.). Applied Superconductivity. Park Ridge: Noyes Data, 1989. p. 133-145. 365 p.