Scientiic/Technical Article
http://dx.doi.org/10.1590/2318-0331.0318170141
Hydrodynamics of a tropical estuary: Buranhém River, Porto Seguro, Brazil
Hidrodinâmica de um estuário tropical: rio Buranhém, Porto Seguro, Brasil
Ana Carolina Rodrigues de Sá Silva1, Marcos Eduardo Cordeiro Bernardes2, Arcilan Trevenzoli Assireu3, Eduardo Siegle4,
Paulo Henrique Gomes de Oliveira Sousa5 and Dustin Brown6
1Universidade Estadual Paulista, Guaratinguetá, SP, Brazil 2Universidade Federal do Sul da Bahia, Eunápolis, BA, Brazil
3Universidade Federal de Itajubá, Itajubá, MG, Brazil 4Universidade de São Paulo, São Paulo, SP, Brazil
5Universidade da Integração Internacional da Lusofonia Afro-Brasileira, Redenção, CE, Brazil 6University of Guelph, Guelph, Ontario, Canada
E-mails: [email protected] (ACRSS), [email protected] (MECB), [email protected] (ATA), [email protected] (ES), [email protected] (PHGOS), [email protected] (DB)
Received: August 28, 2017 - Revised: November 08, 2017 - Accepted: December 04, 2017
ABSTRACT
Estuaries are dynamic environments that are highly vulnerable to anthropogenic inluences, especially when adjacent to urban areas. In this study it is assessed for the irst time the hydrodynamic characteristics of the Buranhém estuary (Northeast Brazil). The aim is to deine the salt transport mechanisms and the hydrodynamics and stratiication patterns of this tropical estuary, under both spring and
neap tidal conditions. Fieldwork was carried out during 8 days covering varying tidal range conditions (July 30th to August 7th, 2015).
Salinity and temperature were continuously monitored at moored stations at both the surface and bottom, whereas velocity proile
was sampled by a bottom-mounted instrument. Average velocity in the water column was 0.46 m.s-1 during lood tides and 1.0 m.s-1 during ebb tides. Residual currents were seaward, with ebb dominance. The dominant salt transport mechanism is turbulent diffusion.
Most of the layer Richardson values did not exceed 2, indicating well mixed conditions mainly during spring tides. Stratiication varies
with tide condition, with spring tides being able to further mix the vertical structure. Vertical velocity gradients that generate vertical mixing overcome the stabilizing effects generated by vertical density gradients.
Keywords: Tide; Stratiication; Salinity.
RESUMO
Estuários são ambientes dinâmicos e altamente vulneráveis às inluências antrópicas, em especial, nas áreas urbanas. Neste estudo, avalia-se pela primeira vez as características hidrodinâmicas do estuário do rio Buranhém (Nordeste do Brasil). Objetiva-se deinir os mecanismos de transporte de sal e os padrões hidrodinâmicos e de estratiicação desse estuário tropical, sob condições de maré de sizígia e quadratura. O trabalho de campo foi realizado durante 8 dias cobrindo uma variedade de condições de altura de maré (entre 30 de julho e 07 de agosto de 2015). A salinidade e a temperatura foram monitoradas continuamente na superfície e no fundo, enquanto o peril de velocidade foi monitorado por um instrumento no fundo do canal. As velocidades médias foram de 0.46 m.s-1, durante a maré de enchente, e 1.0 m.s-1, durante a
maré de vazante. As velocidades residuais foram no sentido de saída do estuário, com o domínio da vazante. O mecanismo de transporte de sal dominante foi difusão turbulenta. A maioria dos valores de número de Richardson por camada foi inferior a 2, indicando que o estuário é bem misturado, principalmente, durante a maré de sizígia. A estratiicação varia de acordo com a condição da maré, com as marés de sizígia podendo haver uma maior misturar na estrutura vertical. Os gradientes de velocidade vertical que geram misturas verticais
superam os efeitos estabilizadores gerados pelos gradientes de densidade vertical.
INTRODUCTION
Coastal zones and their associated environments are among the regions of highest population density in Brazil (IBGE, 2013), and consequently, high anthropogenic pressure increases the vulnerability of these areas. One of such environments are estuaries, which are semi-enclosed bodies of water with an open connection to the ocean. In estuaries, there is mixture between continental freshwater and the saltwater provided by the adjacent ocean (CAMERON; PRITCHARD, 1963; PEREIRA et al., 2010). These environments provide a range of ecosystem services, such
as the nurturing of life, coastal protection, puriication of water,
and carbon capture, among others.
Estuaries are vulnerable to human activity, since they are used for access to the interior of the continent, they are receiving
bodies for natural and industrial efluents, and they are subject to
high human occupancy rates in their surroundings (MIRANDA et al., 2002; PEREIRA et al., 2010).
One of the important components of the study of any given estuary is its hydrodynamics – or, the movement of water of the estuary – which in turn depends on processes which may
be continental (e.g. river low), atmospheric (e.g. wind and rain),
and/or oceanic (e.g. tides and waves in general), with the impact of each process depending on its spatial and temporal scales.
Recent studies about estuarine hydrodynamics seek to generate a better understanding of processes like sediment transport (GONZÁLEZ et al., 2010), water quality (LIU et al., 2015), and ecological processes (TOWNEND et al., 2011), directly linked to the transport of energy and suspended matter.
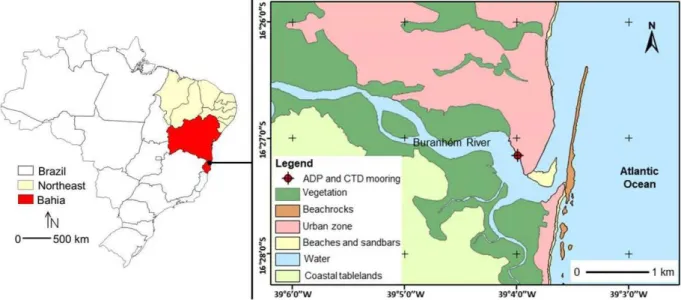
In this study, it is assessed for the irst time the hydrodynamics of the Buranhém river estuary (16°27’7.8” S, 39°3’59.3” W, Figure 1).
The Buranhém estuary is located in Porto Seguro, southern Bahia,
Brazil. Porto Seguro is an important touristic destination in Brazil, resulting in high anthropogenic pressure with its surrounding area being densely populated. While the population of Porto Seguro is estimated on 150,000 inhabitants (IBGE, 2017), the number of tourists can reach up to 6 to 7 times its population per year.
This severely constrains water and sanitation systems during high season and has motivated the development of the municipal basic sanitation plan, which is under way. As most of the city´s sewage is
released in the Buranhém estuary, it is highlighted the importance
of understanding local hydrodynamics.
There are only a few studies in the estuaries of southern Bahia, including some in the region adjacent to the Abrolhos Marine National Park, the largest coral reef habitat in the South Atlantic,
approximately 120 km south of the Buranhém extuary. In this region, the Caravelas, Peruípe and Itanhém estuaries have been
relatively well studied (e.g. PEREIRA et al., 2010; SCHETTINI; MIRANDA, 2010; ANDUTTA et al., 2013; PAIVA et al., 2016). These studies show the tide dominance in governing the estuarine processes, resulting in well mixed estuaries. Although being only 120 km to the north, due to the complex continental shelf
morphology, the tidal range at the Buranhém estuary is about 1 m
smaller than at the Caravelas region.
Therefore, the objective of this work is to understand the
hydrodynamics of the Buranhém estuary and its stratiication
patterns based on hydrographic and velocity data and to show the dominant salt transport mechanism in up-estuary direction.
Such information is presented for the irst time for the Buranhém
estuary and, in addition to the better understanding of its dynamics, it provides important background information for future studies in the region, such as water availability, sanitation and pollution.
STUDY AREA
The Buranhém River watershed spans approximately
2,500 km2, as it covers land in the Brazilian states of Minas Gerais
and Bahia. The source of the river is in Serra dos Aimorés, in Santo
Antônio do Jacinto, Minas Gerais, while its mouth and estuary is in the municipality of Porto Seguro, Bahia.
Based on Pereira et al. (2010), who studied the Caravelas and Peruípe estuaries (to the south of Porto Seguro, in the Abrolhos region), and on tidal charts of Porto Seguro
(http://www.tabuademares.com/br/bahia/porto-seguro), one may conclude that the region is subjected to an astronomical tide that ranges from micro to mesotidal conditions, with variations in the water level reaching just over 2 m under spring tide conditions.
In the study area, the reefs and coastal rocks located at the
mouth of the Buranhém River (Figure 1) have a signiicant role
in the local hydrodynamics by inluencing a range of processes, such as directing the water entrance and forcing the outlow to
be parallel to the coast during most of the tidal cycle.
The lower estuary presents large mangroves areas and a sandbar close to the inlet (Figure 1). The intertidal areas of the
mangroves have a signiicant role in the estuarine tidal prism, being
able to store a large volume of water during high-tides.
MATERIALS AND METHODS
Hydrological data
The National Water Agency (ANA, 2016) runs a luviometric
station in the Buranhém river that is known as Fazenda Limoeiro (16°25’30” S and 39°21’12” W). Historical discharge data are
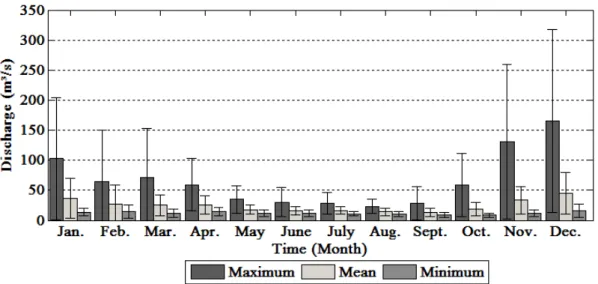
available from January 1973 to January 2015. They indicate an average discharge value of 24 m3.s-1, with seasonal variability (Figure 2). The same data source was used to deine the discharge during the study period (July - August, 2015).
Field measurements
The ield measurements included the mooring of a set of
instruments in order to collect physical properties at the locations of
interest. These included an Acoustic Doppler Proiler (ADP) with a pressure sensor (Nortek Aquadopp current proiler 1 MHz) and two
CT sensors (JFE Advantech), with one being attached to the ADP
frame on the bottom and the second ixed to a loating platform
at a ixed depth of 0.2 m below the water surface. The sampling
area was located in the estuarine channel approximately 2.5 km
landward of its main inlet (16°27’7.8” S, 39°3’59.3” W; Figure 1). Based on the local morphology, with sandbars and meanders,
the sampling position has been deined in order to minimize the inluence of lateral circulation, thus representing the estuarine
circulation pattern.
The instruments collected velocity proiles in ten vertical bins
0.5 m high, water level, salinity and temperature data at 30 minute intervals from July 31, 2015 to August 7, 2015 (a total of 169 h). Depths at the mooring location varied from 3.3 to 5.4 m during data collection.
Velocity data were decomposed on longitudinal (parallel to main channel) and transversal components according to the estuary axis and were corrected for local magnetic declination. The main
estuary axis was deined according to the channel orientation at
the sampling station (approximately SE – NW– Figure 1). This was performed in such a way that positive values of longitudinal velocity indicate seaward currents.
Due to tidal inluence, water column height is not constant
over time. Therefore, the dimensionless depth was estimated using
Equation 1 (MIRANDA et al., 2002), where the vertical axis is zero at the bottom and 1 at the surface:
( )1 c
z=z * h t− (1)
Where:
z: dimensionless depth [ - ]; zc: cell height [m];
h (t): total height [m] at time t.
With these new dimensionless heights, the cubic spline method indicated by Miranda et al. (2002), Bérgamo (2000) and Cavalcante et al. (2013) was used in order to interpolate velocity values. According to these authors, this method improves the data adjustment through a third-degree polynomial.
Estuarine classiication
The estuary was classiied for each complete tidal cycle according to the stratiication-circulation diagram proposed by
Hansen and Rattray Junior (1966). This classiication shows the dominant salt transport mechanism in the upward direction, which can be either dispersive or advective (HANSEN; RATTRAY JUNIOR, 1966; SCOTT, 1993).
The stratification parameter was estimated using
Equation 2 (HANSEN; RATTRAY JUNIOR, 1966; DYER, 1997; MIRANDA et al., 2002; BÉRGAMO et al., 2002):
f s e S S P S −
= (2)
Where:
Pe: stratiication parameter (-); Sf: salinity at the bottom (psu); Ss: salinity at surface (psu);
S: average salinity of the water column (psu).
The circulation parameter was estimated using Equation 3:
s c f u P u
= (3)
Where:
Pc: circulation parameter (-);
us: residual current at the surface (m.s-1); uf: velocity generated by river discharge (m.s-1).
The river discharge velocity (uf) was estimated by taking the averaged value in space and time of the water column, as proposed by Miranda et al. (2002).
The parameters calculated were plotted on the Hansen-Rattray Diagram using the MatLab code proposed by Bérgamo et al. (2002). This code plots the diagram along with the contour lines of parameter v, which represents the relative proportion between turbulent dispersive and advective processes.
Layer Richardson number
The layer Richardson number is deined by Equation 4
(MIRANDA et al., 2002):
v v
L 2 2
g H g H S
Ri
u u
∆ρ β∆
= ≈
ρ (4)
Where:
RiL: layer Richardson number; g: acceleration of gravity (9.81 m.s-2); H: local depth [m];
∆pv: difference between densities at the riverbed and the surface [kg.m-3];
ρ: average density in the water column [kg.m-3]; u: average velocity in the water column [m.s-1];
β: average saline contraction coeficient (≈ 7,0 * 10-4);
∆Sv: difference between salinity at the riverbed and at the surface.
Ranges for this number are used to deine estuarine behavior:
if RiL> 20, stratiied conditions occur, since the generation of
turbulence at the riverbed is insuficient to induce mixture; if
2<RiL<20, the degree of mixture increases as the value decreases; and if RiL< 2, there is total mixture (DYER, 1997).
The layer Richardson number allows for the evaluation of
the relative importance between turbulence and vertical stratiication
at different moments of the tidal cycle. This dimensionless number characterizes the stability of the water column (BÉRGAMO et al., 2002).
RiL was calculated throughout the whole time series. As the variables needed to calculate RiL were measured every 30 minutes, RiL was calculated every 30 minutes.
RESULTS AND DISCUSSION
Hydrological data
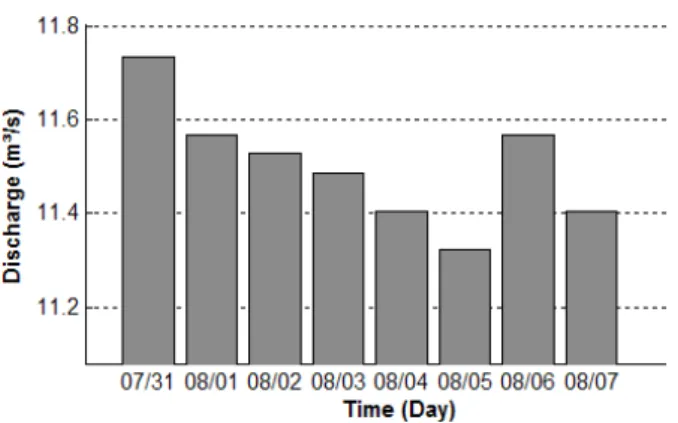
The river discharge at Fazenda Limoeiro during the study period is shown in Figure 3, where an average low of 12.2 m3.s-1 was estimated, with a standard deviation of 0.3 m3.s-1. During the period of interest, the discharge varied from 11.8 to 12.8 m3.s-1, within the expected historical averages for the period (Figure 2).
Discharge values during the experiment (Figure 3) were within the historical range, corresponding to a dry period (Figure 2). Thus, the impact of this component was not considered in this work due to its minimal impact on the results when compared
to tidal inluence.
Temperature, salinity, and vertical oscillation
The spring tide period began on July 31st, 2015 and neap tide started on August 6th, 2015 (Figure 4). The vertical oscillations of the water surface (Figure 4) showed that the maximum tidal range was 2.16 m.
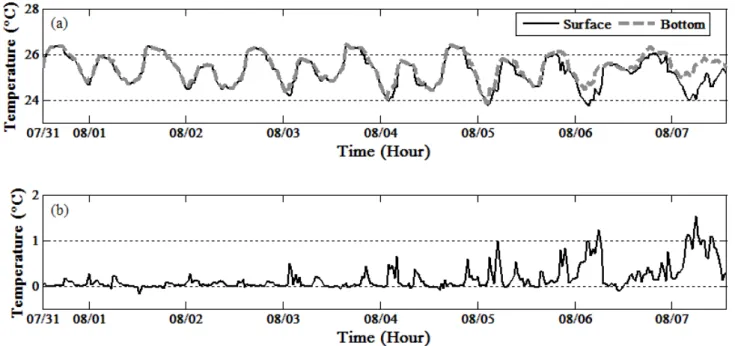
Surface and bottom temperatures are in phase (Figure 5 and Table 1), with a maximum difference of 1.53 °C and an average
of 0.18 ± 0.27 °C. The largest difference between the surface
and bottom temperature was observed during the last three tidal cycles (starting on August 6th), during which there were small tidal amplitudes (Figure 4). The largest thermal stratiication was, thus, observed during neap tides.
Figure 3. Daily data of discharge (m3.s-1) at Fazenda Limoeiro
luviometric station between July 31 and August 07, 2015 (ANA,
In general, temperatures at the bottom and surface were
similar, indicating a negligible thermal stratiication in the water
column, apart from the last three cycles (Table 1).
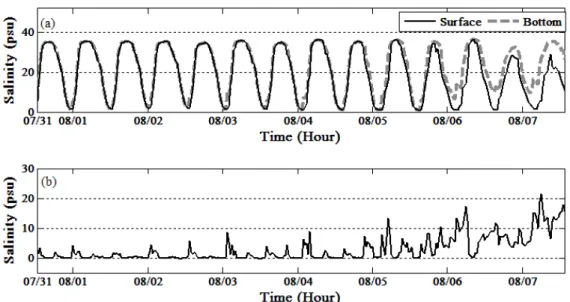
Salinity at the bottom and surface were similar under spring tide conditions and during most of the study period (Figure 6).
The exception was the neap tides period when salt stratiication
did occur. The maximum vertical difference of salinity was at neap tide.
Velocity
The longitudinal velocity (i.e. velocity parallel to the channel axis) data showed that the largest velocities occurred during the late stages of ebb tides (Figure 7). Data for average velocity in the water column had a maximum of 0.46 m.s-1 during lood tides and 1.0 m.s-1
during ebb tides. An analysis of the averaged velocity proile (Figure 8) shows surface velocity of 0.28 m.s-1 (ebb) and an average in the water column of 0.16 m.s-1 (ebb). Observed tidal asymmetry showed ebb
dominance. With net lows and velocity being in the ebb direction,
the estuary behaved as a potential exporter of matter towards the ocean, at least during the observed period (Figure 8).
Residual current was unidirectional and seaward (Figure 8), which is a characteristic of a well-mixed estuary (ANDUTTA et al., 2013)
and inluenced by the large mangrove areas that are able to store
a large volume of water (e.g. WOLANSKI, 1992; MAZDA et al., 1995; RIGO, 2004; ASP et al., 2012; GOMES et al., 2013).
Table 1. Surface temperature and temperature at the bottom.
Temperature (°C) Surface Bottom
Mean 25.3 25.4
Standard deviation 0.7 0.6
Minimum 23.8 23.9
Maximum 26.5 26.4
Figure 4. Data at 30 minute intervals of vertical oscillations (m) of the water surface from 12:30 pm on July 31, 2015 to 1:30 pm on August 7, 2015.
Layer Richardson number
According to Figure 9, during most of the time (77.9% of measurements), the value of RiL was lower than 2, indicating total mixture of the water column. This is reinforced by the difference between the surface and bottom salinity (Figure 6).
The layer Richardson number was greater than 20 during
only 5.6% of the time. Only during these periods stratiication
was observed, when lower tidal shear during neap tides was less
eficient in promoting mixture.
Under spring conditions (full moon on July 31st, 2015), there was a lower Richardson number in comparison to neap tide conditions (waning moon on August 6th, 2015). This is expected, as the spring tides generated stronger currents and more tidal shear when compared to neap tides. Thereby, spring tides promoted more mixture of the water column.
Figure 6. Data at 30 minute intervals of (a) Surface salinity (black continuous line) salinity at the bottom (gray dashed line) (b) difference between the surface and base salinity (psu) from 12:30 pm on July 31, 2015 to 1:30 pm on August 7, 2015.
Figure 7. Data at 30 minute intervals of longitudinal velocity (m.s-1); Positive values: ebb; negative: lood; Black line: water column
height.
Figure 8. Average longitudinal velocity proile from 12:30 pm
The degree of stratiication depends on the amount of
energy available to generate mixture in the water column. There is
a link between degree of stratiication and the turbulence generated
by the tide (BARRETO; SCHETTINI, 2014). In this type of
estuary, the tide has a large inluence as a modulating effect. In general, the bottom salinity was shown to be virtually equal to
the salinity at the surface under spring tide conditions, indicating
small stratiication during most of the time. Thus, the vertical lux of salt is quite small, and the mixture of salt occurs mainly in the
longitudinal direction (MIRANDA et al., 2002).
It was observed that large variations in salinity between
bottom and surface occurred in the inal periods of the ield
campaign, under neap tide conditions. This is expected due to reduction in tidal shear as variations became smaller during neap tides. In general, when tide amplitudes are large (spring tides), there is more mixture in the water column, causing small layer Richardson numbers (Figure 9).
The RiL assumes that the energy for mixing comes
predominantly from the low over the bed (CAVALCANTE et al., 2017). There was weak salinity stratiication (well-mixed) during
spring tides. The largest vertical stratiication of salt (i.e. RiL > 20) was intensiied during slack periods (i.e. lower velocities), because
the turbulence generated by the low near bottom was reduced and unable to generate mixture. In Buranhém estuary, bottom
turbulence may not become effective (RiL>20) especially during slack water and/or neap tides. The same behavior, with varying vertical structure as a function of tidal range has been observed by Siegle et al. (2009) for a similar sized estuary, under low discharge conditions.
Estuary classiication
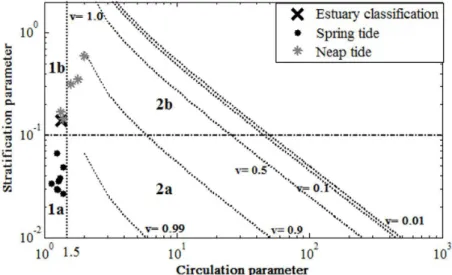
The overall classiication of the estuary, according to the
Hansen and Rattray Junior (1966) stratiication and circulation parameter, is 1B. Temporal variations according to the tides
resulted in varying stratiication, moving from Type 1B to 1A, as
the tidal phase shifted from neap to spring conditions (Figure 10). The dashed lines in Figure 10 represent the relative proportion between the dispersive and advective processes. A proportion value (v) of one was estimated, meaning there is a dominance of turbulent diffusion over advection (MIRANDA et al., 2002). In other words, gravitational circulation was negligible and the salt transport in the upstream direction was due to turbulent diffusion (e.g. DIAS et al., 2016).
Figure 10. Hansen and Rattray Junior (1966) classiication diagram of the Buranhém river estuary in Porto Seguro, Bahia; relative
proportion (0<v≤1) between the dispersive and advective (dashed lines).
The classiication of the estuary was 2b (partially mixed and highly stratiied) during some neap tidal cycles. There was a high stratiication during last three cycles. The baroclinic gradient pressure
force is important. Similarly to the studies of Andutta et al. (2013) and Cavalcante et al. (2017), advection and diffusion contributed
to the net up-estuary salt lux.
Stratiication varies with tide condition, with spring tides
being able to further mix the vertical structure. Vertical velocity gradients that generate vertical mixing overcome the stabilizing effects generated by vertical density gradients. This means that during large tidal ranges, gravitational circulation is inhibited. Based on the layer Richardson number (Figure 9), the estuary was classiied as well-mixed. As for the Hansen and Rattray Junior (1966) classiication, the estuary was of Type 1B, with some alternation between 1A (during spring tides) and 1B (during neap tides). Estuaries of Type 1
have residual low downstream the entire water column, while the estuary’s transport of salt in the landward direction occurs by the
process of turbulent diffusion. Also, Type 1 estuaries are driven by
tides, which have suficient energy to induce vertical stratiication
and vertical homogenization in the water column.
In general, a well-mixed estuary is characterized by a larger
tide inluence, with river low being of secondary importance.
Our dataset spanned dry conditions under ENSO (El Niño/Southern Oscillation) conditions. Increased river discharge would result in
increased stratiication in the water column, when compared to
observed data. Such conditions will be important for local ecosystem
development, because there is reduced vertical lux of matter and energy, such as nutrients and heat, under more stratiied conditions
(CAVALCANTE et al., 2013). Although the present study does not
cover the wet period, the Buranhém estuary may become partially stratiied or stratiied during neap tides (Figure 10), after large rainfall
events or other periods with larger river lows (Figure 3). Therefore,
the classiication could be different in other phases of the year.
Although our results focused only on dry conditions, they provide important background information for the region. A thorough
understanding of the study area requires the replication of these ield measurements under larger river discharges.
CONCLUSION
Based on in situ data, a irst assessment of the hydrodynamics
of the Buranhém river estuary is presented. Results show the inluence of varying tides on the system, under low river discharge
conditions.
Semidiurnal tides from micro to mesotidal range were observed. During spring tide conditions, the importance of the
tidal inluence was ampliied as expected, which relected on weak vertical stratiication.
Most of the time, the value of the RiL indicated a total mixture in the water column. The largest values were found close to slack water and/or neap tides.
Hansen and Rattray Junior (1966) classiication diagram indicated the estuary was of Type 1B - well-mixed with a dominant turbulent diffusion process, which is typical of tide-driven estuaries.
Although these results represented dry conditions, they form important background information on the local dynamics. We recommend for future studies in the region to assess the
inluence of the varying river discharge ranges and their effects
on the estuarine dynamics.
ACKNOWLEDGEMENTS
The authors are thankful to the anonymous reviewers for their valuable comments.
This article is part of the project Environmental diagnosis
and monitoring of the estuary of the Buranhém river, Porto
Seguro, Bahia, sponsored by National Council of Technological
and Scientiic Development (CNPq), process nº 447545/2014-0,
a collaboration between the Federal University of Southern Bahia (UFSB), Federal University of Itajubá (UNIFEI), Oceanographic Institute of the University of São Paulo (IOUSP) and State University of Santa Cruz (UESC). A.T.A. and E.S. are sponsored
by CNPq research fellowships.
We are also grateful to the Coordination for the Improvement of Higher Education Personnel (CAPES), to the Brazilian Navy and to the Department of Environment of Porto Seguro.
REFERENCES
ANA – AGÊNCIA NACIONAL DE ÁGUAS. Hidroweb: séries
históricas. 2016. Available from: <http://hidroweb.ana.gov.br/>.
Access on: 05 jan. 2016.
ANDUTTA, F. P.; MIRANDA, L. B.; SCHETTINI, C. A. F.; SIEGLE, E.; SILVA, M. P.; IZUMI, V. M.; CHAGAS, F. M. Temporal variations of temperature, salinity and circulation in the Peruípe river estuary (nova Viçosa, BA). Continental Shelf Research, v. 70, p. 36-45, 2013. http://dx.doi.org/10.1016/j.csr.2013.03.013.
ASP, N. E.; SCHETTINI, C. A. F.; SIEGLE, E.; SILVA, M. S.; BRITO, R. N. R. The dynamics of a frictionally-dominated Amazonian estuary. Brazilian Journal of Oceanography, v. 60, n. 3, p. 391-403, 2012. http:// dx.doi.org/10.1590/S1679-87592012000300011.
BARRETO, G. A. M.; SCHETTINI, C. A. F. Papel da Maré e da descarga fluvial na circulação do Estuário do Rio Araranguá. Revista Brasileira de Recursos Hídricos, v. 19, n. 3, p. 7-17, 2014. http://dx.doi. org/10.21168/rbrh.v19n3.p7-17.
BÉRGAMO, A. L. Caracterização da hidrograia, circulação e transporte de sal:
Barra de Cananéia, Sul do Mar de Cananéia e Baía de Trapandé. 2000. 254 f. Dissertação (Mestrado em Ciências) - Instituto de Oceanografia,
Universidade de São Paulo, São Paulo, 2000.
BÉRGAMO, A. L.; MIRANDA; L. B.; CORRÊA, M. A. Estuários: programas para o processamento e análise de dados hidrográficos e correntográficos. São Paulo: Universidade de São Paulo, 2002. 16
p. Relatórios Técnicos.
CAMERON, W. M.; PRITCHARD; D. W. Estuaries. In: HILL, M. N. (Ed.). The sea: ideas and observations on progress in the study of the seas. New York: Interscience, 1963. p. 306-324.
CAVALCANTE, G. H.; FEARY, D. A.; KJERFVE, B. Effects of tidal range variability and local morphology on hydrodynamic
behavior and salinity structure in the Caeté River Estuary, North
CAVALCANTE, G.; MIRANDA, L. B.; MEDEIROS, P. R. P. Circulation and salt balance in the São Francisco river Estuary (NE / Brazil). Brazilian Journal of Water Resources, v. 22, p. e31, 2017. http:// dx.doi.org/10.1590/2318-0331.021720170003.
DIAS, F. J. S.; CASTRO, B. M.; LACERDA, L. D.; MIRANDA, L. B.; MARINS, R. V. Physical characteristics and discharges of suspended particulate matter at the continent-ocean interface in an estuary located in a semiarid region in northeastern Brazil. Estuarine, Coastal and Shelf Science, v. 180, p. 258-274, 2016. http://dx.doi.org/10.1016/j. ecss.2016.08.006.
DYER, K. R. Estuaries: a physical introduction. 2nd ed. England: John Wiley & Sons, 1997. 195 p.
GOMES, V. J. C.; FREITAS, P. T. A.; ASP, N. E. Dynamics and seasonality of the middle sector of a macrotidal estuary. Journal of Coastal Research, v. 2, n. 65, p. 1140-1145, 2013. http://dx.doi. org/10.2112/SI65-193.1.
GONZÁLEZ, C. J.; ÁLVAREZ, Ó.; REYES, J.; ACEVEDO, A. Two-dimensional modeling of hydrodynamics and sediment transport in the San Pedro tidal creek (Cadiz Bay): morphodynamical implications. Ciencias Marinas, v. 36, n. 4, p. 393-412, 2010. http:// dx.doi.org/10.7773/cm.v36i4.1624.
HANSEN, D. V.; RATTRAY JUNIOR, M. New dimensions in estuary classification. Limnology and Oceanography, v. 11, n. 3, p. 319-326, 1966. http://dx.doi.org/10.4319/lo.1966.11.3.0319.
IBGE – INSTITUTO BRASILEIRO DE GEOGRAFIA E ESTATÍSTICA. IBGE Cidades. 2017. Available from: <https:// cidades.ibge.gov.br/brasil/ba/porto-seguro/panorama>. Access on: 24 out. 2017.
IBGE – INSTITUTO BRASILEIRO DE GEOGRAFIA E ESTATÍSTICA. IBGE lança mapa de densidade demográica de 2010. 2013. Available from: <http://saladeimprensa.ibge.gov.br/noticias?view= noticia&id=1&busca=1&idnoticia=2501>. Access on: 16 maio 2015.
LIU, W. C.; CHAN, W. T.; YOUNG, C. C. Modeling fecal coliform contamination in a tidal Danshuei River estuarine system. The Science of the Total Environment, v. 502, p. 632-640, 2015. PMid:25302451. http://dx.doi.org/10.1016/j.scitotenv.2014.09.065.
MAZDA, Y.; KANAZAWA, N.; WOLANSKI, E. Tidal asymmetry in mangrove creeks. Hydrobiologia, v. 295, n. 1-3, p. 51-58, 1995. http:// dx.doi.org/10.1007/BF00029110.
MIRANDA, L. B.; CASTRO, B. M.; KJERFVE, B. Princípios de
oceanograia física de estuários. São Paulo: Editora da Universidade de São Paulo, 2002.
PAIVA, B. P.; SCHETTINI, C. A. F.; PEREIRA, M. D.; SIEGLE, E.; MIRANDA, L. B.; ANDUTTA, F. P. Circulation and suspended sediment dynamics in a tropical estuary under different morphological setting. Anais da Academia Brasileira de Ciencias, v. 88, n. 3, p. 1265-1276, 2016. PMid:27598844. http://dx.doi.org/10.1590/0001-3765201620150620.
PEREIRA, M. D.; SIEGLE, E.; MIRANDA, L. B.; SCHETTINI, C. A. F. Hidrodinâmica e transporte de material particulado em suspensão sazonal em um estuário dominado por mare: Estuário de Caravelas (BA). Revista Brasileira de Geofísica, v. 28, n. 3, p. 427-444, 2010. http:// dx.doi.org/10.1590/S0102-261X2010000300008.
RIGO, D. Análise do escoamento em regiões estuarinas com manguezais – medições e modelagem na Baía De Vitória, ES. 2004. 140 p. Tese (Doutorado em
Engenharia Oceânica) - Instituto Alberto Luiz Coimbra de Pós-Graduação e Pesquisa de Engenharia, Universidade Federal do Rio
de Janeiro, Rio de Janeiro, 2004.
SCHETTINI, C. A. F.; MIRANDA, L. B. Circulation and suspended particulate matter transport in a tidally dominated estuary: Caravelas Estuary, Bahia, Brazil. Brazilian Journal of Oceanography, v. 58, n. 1, p. 1-11, 2010. http://dx.doi.org/10.1590/S1679-87592010000100001.
SCOTT, S. F. Canonical parameters for estuary classification. Estuarine, Coastal and Shelf Science, v. 36, n. 6, p. 529-540, 1993. http://dx.doi. org/10.1006/ecss.1993.1032.
SIEGLE, E.; SCHETTINI, C. A. F.; KLEIN, A. H. F.; TOLDO JUNIOR, E. E. Hydrodynamics and suspended sediment transport in the Camboriú estuary - Brazil: Pre jetty conditions. Brazilian Journal of Oceanography, v. 57, n. 2, p. 123-135, 2009. http://dx.doi.org/10.1590/ S1679-87592009000200005.
TOWNEND, I.; FLETCHER, C.; KNAPPEN, M.; ROSSINGTON, K. A. Review of salt marsh dynamics. Water and Environment Journal, v. 25, n. 4, p. 477-488, 2011. http://dx.doi.org/10.1111/j.1747-6593.2010.00243.x.
WOLANSKI, E. Hydrodynamics of mangrove swamps and their coastal waters. Hydrobiologia, v. 247, n. 1-3, p. 141-161, 1992. http:// dx.doi.org/10.1007/BF00008214.
Authors contribuitions
Ana Carolina Rodrigues de Sá Silva: participated in the ield,
analysis, interpretation and discussion of results, writing and revision of the article.
Marcos Eduardo Cordeiro Bernardes: participated in the ield,
responsible for reviewing the data analysis, discussion of the results, writing and revision of the article.
Arcilan Trevenzoli Assireu: responsible for reviewing the data analysis, writing and revision of the article.
Eduardo Siegle: responsible for reviewing the data analysis, discussion of the results, writing and revision of the article.
Paulo Henrique Gomes de Oliveira Sousa: participated in the ield,
responsible for reviewing the data analysis, writing and revision of the article.