ISSN 0104-6632 Printed in Brazil
Brazilian Journal
of Chemical
Engineering
Vol. 21, No. 01, pp. 1 - 12, January - March 2004
THE EFFECT OF SOME PROCESSING
CONDITIONS ON THE CHARACTERISTICS
OF BIODEGRADABLE MICROSPHERES
OBTAINED BY AN EMULSION SOLVENT
EVAPORATION PROCESS
J. L. Maia
1M. H. A. Santana
1and M. I. Ré
21
Universidade Estadual de Campinas, Faculdade de Engenharia Química, Campinas - SP
2
IPT , Instituto de Pesquisas Tecnológicas do Estado de São Paulo Laboratório de Tecnologia de Partículas/Divisão de Química- Cidade Universitária,
Butantã, CEP 05508-901, São Paulo – SP, Brasil. E-mail: [email protected]
(Received: April 15, 2003 ; Accepted: August 1, 2003)
Abstract - Unloaded microspheres were prepared from polyhydroxybutyrate (PHB) and polyhydroxybutyrate-co-valerate (PHB-HV) polymers using an oil-in-water emulsion solvent evaporation method. The study was conducted to evaluate how the polymer and some process parameters affect properties of the final microspheres such as particle size, superficial area, zeta potential, surface morphology and microsphere degradation. The variables included surfactant concentration in the emulsion water phase and solvent composition. From the results, it was found that the parameters affecting microsphere size the most were surfactant concentration in the emulsion water phase and solvent composition. Properties such as zeta potential, surface area and surface morphology remained pratically unchanged over the range of the processing conditions studied here.
Keywords: microencapsulation, poly-hydroxybutirate-hydroxyvalerate, emulsification/evaporation.
INTRODUCTION
Polymers and copolymers of lactic and glycolic acids are the most commonly used to develop drug delivery systems due to their safe and authorized use applications in humans (Chulia et al., 1994). However, other biodegradable polymers have been studied to increase the number of biodegradable materials available for pharmaceutical and medical applications.
One of these, the polyhydroxyalkanoates (PHAs) comprise a large family of bacterial storage polyesters. Their chemical structure (Figure 1) is very similar to the highly popular synthetic biodegradable polymers, the polylactides (PLA) and their
copolymers with glycolides, poly(lactide-co-glycolide) (PLGA), but they generally degrade at a much slower rate (Amass et al., 1998).
CH-CH2-C-O
=
O R
R = methyl ; 3-hydroxybutyrate (HB)
R = ethyl ; 3-hydroxyvalerate (HV)
Figure 1: Structural formula for the 3-hydroxyalkanoates.
Their use in drug release systems has been reported in recent years (Sendil et al., 1999; Baran et al., 2002) and emulsion solvent evaporation has been the most frequently used microencapsulation method. When preparing microspheres by an oil-in-water (o/w) emulsion solvent evaporation method, after the oil phase (polymer + solvent) is injected into the aqueous phase (water + surfactant), the solvent dissolves into the aqueous phase and evaporates at the air-liquid interface. The extent and speed of solvent transfer from the dispersed phase into the aqueous phase depends on the solubility as well as the solvent mass transfer rate. On the other hand, solvent evaporation depends mostly on temperature and the concentration of solvent in the air. The solvent elimination procedure may influence properties of the final microspheres and that is one of the effects of processing conditions that should be known during microsphere production, before the design of controlled drug delivery systems.
In this study, some processing conditions that will affect both the extent and speed of the emulsion solvent extraction and the evaporation rate were varied to observe their effect on microsphere characteristics such as microsphere shrinking rate during formation, particle size, superficial area and surface morphology. Also, the effect that the surfactant concentration in the water phase can have on size and zeta potential of the micropheres was examined here.
MATERIALS
Polyhydroxybutyrate (PHB) and Polyhydroxybutyrate- hydroxyvalerate copolymers (PHB-HV) were the generous gift of the company PHB-Industrial S.A (Serrana, Brazil). Polyvinyl alcohol (88% hydrolyzed) was received from Hoechst GAC (Germany). Chloroform (99.8%) was purchased from Carlo Erba Reagenti (Italy).
METHODS
Preparation of PHB and PHB-HV Microspheres
PHB and PHB-HV microspheres were prepared by an oil-in-water (o/w) emulsion solvent extraction procedure, as schematized in Figure 2. The polymer (4 g) was dissolved in chloroform (76mL) at 50ºC. The organic solution was then emulsified in an aqueous phase (400 mL) containing different concentrations of polyvinyl alcohol (PVA) from 0 to 4 % w/v as an emulsion stabilizer. The resulting o/w emulsion was stirred at 700 rpm and 50ºC for 6 hours to extract chloroform. The microspheres were washed with 1500 mL of distilled water and dried under vacuum for 4 hours. They were then stored in vacuum at room temperature.
Microsphere Characterization
a) Molecular Weight
The average molecular weight of the microspheres was determined by gel permeation chromatography (GPC), using a pump (Waters 600, MA, USA), a differential refractometer detector (Waters 410, MA, USA) and an integrator (Waters 746, MA, USA). Three HR5E columns with elective molecular weight ranges of 2000-4000000 Da were connected in series. The mobile phase was chloroform (CHCl3) with a flow rate of 1 ml/min at
30ºC. The dried microspheres were dissolved in CHCl3 and filtered. A 100 µl volume of polymer
solution was injected. Data collection and analysis were done with Waters Millennium software.
b) Zeta Potential
Powdered microspheres Drying (vacuum oven)
Washing in water and redispersion
Evaporation Emulsification PHB or PHB-HV
dissolved in chloroform PVA aqueous solution
Figure 2: Experimental procedures for microsphere production by the emulsion solvent evaporation method.
c) Solvent Removal Rate
The solvent removal rate was taken from the rates of reduction in the microsphere diameter determined by laser diffraction during the formation process. The first sample of the o/w emulsion was drawn 3 min after injection of the organic phase into the aqueous phase. Samples were continuously drawn at 5-min intervals for the first 30 min after the first sampling. Following this, samples were still regularly collected at 60-min intervals throughout the whole emulsion extraction solvent procedure. Optical photomicrographs were taken for all the samples, using a Nikon E400 POL optical microscope.
d) Particle Size
The particle size distribution was determined by laser diffractometry using a Malvern laser sizer. Average particle size was expressed as volume mean diameter (d4,3) in µm. Particle diameter dv,90 (90%
below this range) and particle diameter dv,10 (10%
below this range) were also recorded.
e) Morphology
Optical and scanning electron microscopy were used to evaluate the quality of the microspheres
obtained under the various conditions used. After being vacuum-coated with a thin layer of gold, the microspheres were examined by means of a JEOL JSM5200 scanning electron microscope at an intensity of 10-15 kV, using various magnifications to observe the surface morphology.
e) Surface Area
The specific surfaces of samples were determined with Micromeritics ASAP 200 equipment from data on nitrogen adsorption and desorption isotherms at the boiling point of liquid nitrogen under atmospheric pressure (–195ºC). In the validity range of the BET isotherm, specific surface was calculated from the slope and intercept of a line formed by five measuring points. A sample weight of 0.6-0.7g was used to ensure accurate and reproducible results, based on a recommendation in the literature (Hausberger and DeLuca, 1995).
f) Differential Scanning Calorimetry (DSC)
Thermograms of the samples were obtained with a DSC (Shimadzu Tga-50h) in the temperature range of –100 to +250oC at a heating rate of 10ºC/min in a nitrogen atmosphere.
Accurately weighed microsphere samples were added to sterile screw-capped tubes containing Hank’s buffer pH 7.4 (136.900 mmol/L NaCl; 5.370 mmol/L KCl; 0.812 mmol/L MgSO4.7H2O; 1.260
mmol/L CaCl2; 0.337 mmol/L Na2HPO4.2H2O,
0.441 mmol/L KH2PO4 and 4.170 mmol/L NaHCO3
in bidistilled water). All microspheres were incubated for a total of 30 days under agitation in a shaker bath (37º C and 50 cycles min-1). After 10, 20 and 30 days of incubation, small representative samples of microspheres were washed three times with distilled water and dried in a vacuum dessicator to constant weight. The percentage weight loss (PWL) was computed as the dry weight loss after 10, 20 or 30 days of incubation (g)/ original dry weight of sample x 100.
The structural morphology of the microspheres during degradation in vitro was also monitored using SEM microscopy at each interval in simultaneous experiments. In these cases, a small representative sample of microspheres was removed after 10, 20 and 30 days, washed briefly in distilled water and thoroughly dried in a dessicator for 24h prior to being prepared for SEM observation.
RESULTS AND DISCUSSION
Effect of PVA Concentration on the Particle Size and Zeta Potential of the Microspheres
a) PVA Concentration
PVA concentration in the external water phase is known to be a factor that influences the size of microspheres (Yang et al., 2001). In the present work, PHB and PHB-HV microspheres were produced with a PVA concentration in the external water phase from 0 to 4.0%w/v in order to examine
the effect of this process parameter on microsphere characteristics.
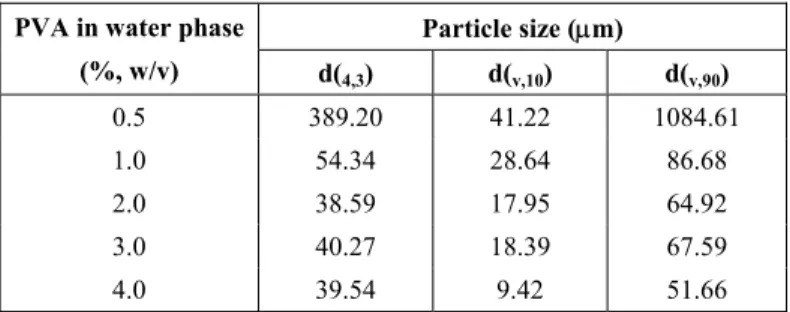
First, it was proven experimentally in this study that without PVA it is not possible to produce PHB-HV or PHB microspheres, since the resultant product in both cases is a precipitated polymeric mass. The effect of PVA concentration on the volume mean diameter is shown in Tables 1 and 2 for PHB-HV and PHB microspheres, respectively. The sizes of PHB-HV microspheres obtained at 0.5, 1.0, 2.0, 3.0 and 4.0 %PVA (w/v) were 389.20µm, 54.34µm, 38.59µm, 40.27µm and 39.54µm, respectively (Table 1). It can be seen that a significant decrease in microsphere size could be achieved by increasing PVA concentration from 0.5% to 2.0%w/v. This result can be explained as follows: by increasing PVA concentration from 0.5 to 2.0%w/v, the emulsion droplets were stabilized to avoid coalescence, resulting in smaller microspheres.
However, no additional significant reduction in PHB-HV microsphere size was obtained by increasing the concentration of PVA in the water phase from 2.0% to 4.0%w/v. In this case, since PVA is a polymer with a high molecular weight, further increases in PVA concentration up to 2.0%w/v increased the viscosity of the o/w emulsion, resulting in an increasing difficulty to break up the emulsion into smaller droplets.
The trends observed for PHB microspheres are practically the same as those observed for PHB-HV microspheres. The sizes of the PHB microspheres obtained at 1.0, 2.0, 3.0 and 4.0%w/v PVA were 49.16µm, 51.45µm, 33.85µm and 31.30µm, respectively (Table 2). It can be seen that a decrease in microsphere size could be achieved by increasing PVA concentration from 2.0% to 3.0%w/v. However, no further significant reduction in microsphere size was obtained by increasing the concentration of PVA in the water phase from 3.0% to 4.0%w/v.
Table 1: Variation in PHB-HV microsphere size as a function of PVA concentration in the emulsion water phase.
Particle size (µm) PVA in water phase
(%, w/v) d(4,3) d(v,10) d(v,90)
Table 2: Variation in PHB microsphere size as a function of PVA concentration in the emulsion water phase.
Particle size (µm) PVA in water phase
(%, w/v) d(4,3) d(v,10) d(v,90)
1.0 49.16 23.61 80.04 2.0 51.45 26.97 81.88 3.0 33.85 14.83 56.79 4.0 31.30 12.71 56.08
-20 -16 -12 -8 -4 0 4 8 12 16 20
1 2 3 4
PVA in the emulsion water phase (%w/v)
Z
et
a
P
o
te
n
ti
a
l
(m
V
)
PHB-HV PHB
Figure 3: Zeta potential from electrophoresis measurements for PHB and PHB-HV microspheres prepared by the emulsion solvent evaporation method.
b) Zeta Potential Measurements
The value of this potential depends on the charges present on the particle surface (Nernst potential). An increase or a decrease in the surface charged groups will result in a higher or lower zeta potential (Muller et al., 1986). In the case of the PHB or PHB-HV microspheres produced with different PVA concentrations, a change in the number of surface charges would be due to the incorporation of ionic surfactant and/or its adsorption on the surface. The emphasis here was placed on changes in the zeta potential of the microspheres after a washing procedure to remove the free PVA from their surfaces and not on an absolute value of potential.
Figure 3 shows the zeta potential of PHB and PHB-HV microspheres obtained with different PVA concentrations in the emulsion water phase. Values of potential for cleaned PHB and PHB-HV
microspheres are measured in the range of 8 mV to -18 mV. However, the oscillation of the potential in this range can not be attributed to an increase in the number of charges on the surface of the microspheres with an increase in the surfactant concentration used for their preparation.
Differential Scanning Calorimetry (DSC)
To evaluate the effect of the oil-in-water emulsion solvent evaporation method on the thermal properties of PHB and PHB-HV, microspheres and original samples of both polymers were submitted to DSC analysis.
This indicates that the polymer (PHB-HV) becomes less crystalline than PHB. Further studies on permeability of PHB-HV microspheres would be expected to reveal a larger increase in the release rates than that for PHB microspheres as a result of the lower crystallinity of PHB-HV.
Table 3 also shows that the conversion of both PHB and PHB-HV polymers into microspheres causes a reduction in the glass transition temperature (Tg). An explanation for these data can be some residual solvent that was incorporated in the commercial products. On the other hand, changes in melting temperature (Tm) from one polymer to the other and from the commercial products to their resultant microspheres were not significant.
Surface Area
The surface areas calculated by the BET method for the PHB and PHB-HV microspheres are shown in Table 4. The values, between 19 and 20m2/g, are 100 times larger than the superficial area of the PLGA microspheres prepared by Hausberger and De Luca (1995) using the same oil-in-water emulsion solvent evaporation method. Assuming that the surface area of biodegradable microspheres may affect their biodegradation rate, the larger surface area of the PHB and PHB-HV microspheres shown here can be advantageous for development of controlled delivery systems by overcoming the degradation rate of these polymers, which is slower than that of the PLGA microspheres.
Degradation in Vitro
Despite its limitations, gravimetry is very useful to provide a simple picture of the relative rates of disappearance of biodegradable polymers and it was employed in this study. To do so, the fraction of PHB and PHB-HV that became microspheres was estimated by monitoring the percentage weight loss (PWL) during their incubation in Hanks buffer 37oC, pH 7.4 for 30 days.
The PWL for PHB and PHB-HV microspheres in Figure 4 represents the amount of microsphere matrix bulk and surface erosion. After 30 days of incubation in Hank’s buffer, the PWL for PHB microspheres was 2.0% as opposed to 6.0% for PHB-HV microspheres. Considering that before degradation, PHB and PHB-HV microspheres had similar average molecular weights (118.455Da for PHB and 98.612Da for PHB-HV microspheres, determined by GPC), these results confirm that the two biopolymers degrade slowly and that because it is more crystalline, PHB degrades more slowly than PHB-HV.
The trends observed from SEM observations were the same, regardless of the polymer used. It can be seen in Figure 5 that after 30 day of incubation in Hank’s buffer, PHB-HV microspheres had retained their spherical shape and pores structure. There was no evidence of surface erosion. These results are in agreement with other experimental results obtained previously on the slow degradation of these polymers in a similar medium (Holland, 1986; Amass et al., 1998).
Table 3: DSC thermograms for commercial products and microspheres: a) commercial PHB and PHB microspheres; b) commercial PHB-HV and PHB-HV microspheres.
Material analyzed by DSC Tg (ºC) Tm (ºC)
PHB +1.9 168.7 PHB Microspheres -1.3 167.3
PHB-HV -2.4 168.9 PHB-HV Microspheres -5.6 170.7
Table 4: BET gas adsorption from surface area measurements of PHB and PHB-HV microspheres.
Microspheres Sample weight (g) BET surface area (m2/g)
Correlation coefficient
0 1 2 3 4 5 6 7
0 10 20 30 40
Incubation Time (days)
%
W
e
ig
h
t
L
o
ss
(P
W
L
)
PHB
PHB-HV
Figure 4: Percentage weight loss from PHB and PHB-HV microspheres after 10, 20 and 30 days of incubation at 37ºC in Hank´s buffer, pH 7.4.
(a) (b)
(c)
Effect of Processing Conditions on the Rate of Solvent Removal from the Microspheres
In this study, temperature and solvent composition, two processing conditions that affect both the extent and speed of the emulsion solvent extraction and the evaporation rates were varied to observe their effect on the PHB-HV microsphere shrinking rate during formation.
a) Temperature
PHB-HV microspheres were prepared with 1% PVA w/v in the emulsion water phase at different temperatures, 40°C and 50°C.
This research emphasized the net solvent removal from the nascent microspheres during the entire process up to obtention of the resultant microspheres. Since the solvent diffused out through the nascent microsphere skin, the microsphere diameter decreased and its reduction was continuously monitored by optical microscopy and size distribution by laser diffraction. The reduction in diameter of PHB-HV microspheres obtained at 40°C and at 50°C is shown in Figure 6 and illustrated in Figure 7 by optical microphotographs taken at different times (1 and 25 min). One can observe that the microspheres obtained at both temperatures shrink substantially within a few minutes and that the higher temperature contributed to enhancing solvent removal in this initial period of time.
15 20 25 30 35 40 45
0 60 120 180
Time (min.)
D
[4
,3
] (m
ic
rons
)
T 40ºC
T 50ºC
Figure 6: Change in diameter of PHB-HV microspheres during production at 40ºC and 50ºC.
50ºC 1 min. 25 min.
40ºC 1 min 25 min
From the solubility data (Washburn et al., 1928), it is known that the solubility of chloroform in water is 7.35 g/L at 40oC and 7.45 g/L at 50oC. Thus at the beginning, the solubility of chloroform at 50°C, as compared to 40°C (less than 1.5 wt% difference), can not explain the faster removal of the solvent from the emulsion droplets observed at 50oC. On the other hand, the diffusion coefficient and the concentration gradient of the solvent, both significant factors in mass transfer, are dependent on temperature. The diffusion coefficient increases with temperature. Higher temperatures will provide a greater driving force for evaporation at the air/liquid interface, reducing the solvent concentration in the sink. The concentration gradient between the two liquid phases will then decrease, favoring mass transfer.
The net solvent removal rate could be estimated by the volume shrinkage of a nascent microsphere at 40°C. The same procedure was employed by Yang et al. (2000) in a similar study with PLGA microspheres. The analysis here is based on the initial shrinkage rate of a single oil droplet taken from the water phase at time t=0 (3.0 min after the injection of the oil phase into the water phase).
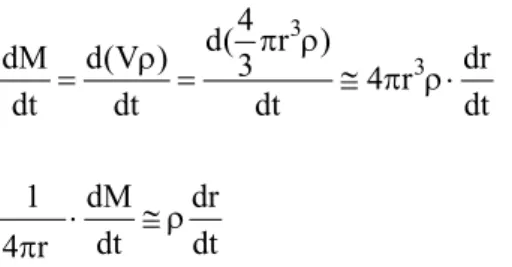
From the data presented in Figure 6 for 40°C, the rate reduction in diameter is constant during the first 7.0 minutes, indicating a constant flux (mass transfer per unit surface area) during this time if the density is assumed to be invariant because
3
3
4 d( r )
dM d(V ) 3 dr
4 r
dt dt dt dt
1 dM dr
dt dt
4 r
π ρ ρ
= = ≅ π ρ⋅
⋅ ≅ ρ
π
(1)
where M is solvent mass within a microsphere, t is time and ρ is liquid density.
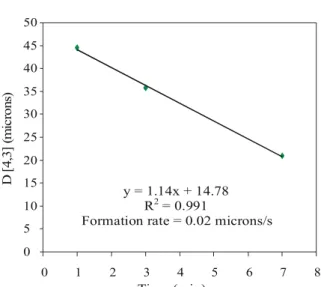
Figure 8 represents the reduction in microsphere diameter during the first 7 minutes at 40ºC. The rate of formation of PHB-HV microspheres at 40ºC, calculated from the straight line slope, is 0.02 µm/s. Interestingly, it was of the same order of magnitude as the rate of formation of PLGA microspheres, found by Yang et al. (2000) in a similar process.
It was not possible to estimate the initial shrinking rate from the experimental data obtained at 50°C. At high temperatures like 50°C, equilibrium is not reached since the evaporation of solvent is very
rapid. This is reflected in the final diameter rapidly reached by the microspheres.
b) Solvent Composition
Another strategy studied here that affected the solvent removal rate was the use of a binary mixture of chloroform (water-immiscible solvent) with acetone, a water-miscible organic solvent. In this case, microspheres are formed by the following steps: when the polymeric solution is poured into the water phase, emulsion droplets are formed; acetone quickly diffuses out from each emulsion droplet, drastically reducing its size and the remaining chloroform is removed from the system, causing the droplets to solidify and finally form polymeric microspheres. Reduction of the final size of the microspheres by this procedure would be expected.
First, a cloud point titration technique (Murakami et al., 1999) was employed to identify the composition of the binary mixture dissolving the biopolymer. PHB-HV microspheres were prepared using a binary mixture of chloroform and acetone (2:1) at 50oC with a 1% PVA w/v. The same experimental procedure used to monitor the effect of temperature on solvent removal rate was employed here.
The variation in emulsion droplet size with time is shown in Figure 9 for the binary mixture chloroform-acetone, compared to the data obtained with only chloroform as the solvent. The same behavior monitored by optical microscopy is illustrated in Figure 10. The results show that solvent composition can also be a key factor in controlling the solvent removal rate and the final size of the microspheres.
0 5 10 15 20 25 30 35 40 45 50
0 1 2 3 4 5 6 7 8 Time (min)
D
[4,
3]
(m
ic
ro
ns
)
y = 1.14x + 14.78
R2 = 0.991
Formation rate = 0.02 microns/s
Figure 8: Initial rate of reduction in diameter of PHB-HV microspheres produced at 40ºC.
10 14 18 22
0 60 120 180
Time (min)
D
[4
,3
] (
m
ic
ro
n
s) Chloroform/
acetone Chloroform
Figure 9: Change in diameter of PHB-HV microspheres as a function of solvent composition (chloroform and chloroform/acetone).
Chloroform 1 min 120 min.
Chloroform/Acetone 1 min 120 min
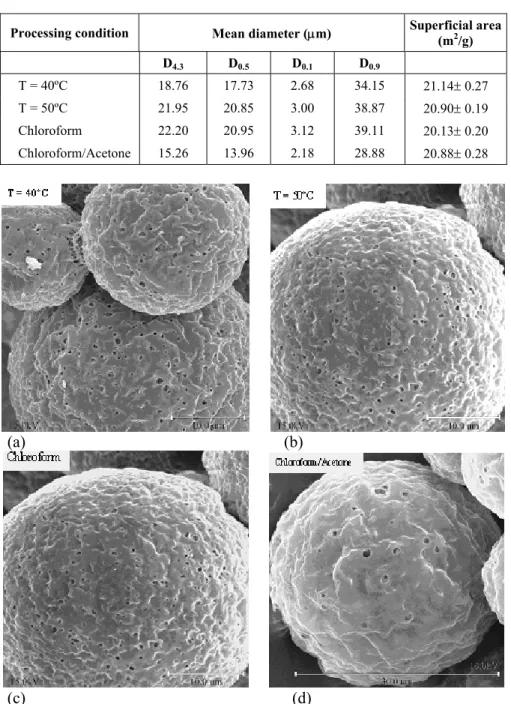
Table 5: Volume mean diameter and superficial area of PHB-HV microspheres as a function of processing conditions.
Processing condition Mean diameter (µm) Superficial area (m2/g)
D4.3 D0.5 D0.1 D0.9
T = 40ºC 18.76 17.73 2.68 34.15 21.14± 0.27 T = 50ºC 21.95 20.85 3.00 38.87 20.90± 0.19 Chloroform 22.20 20.95 3.12 39.11 20.13± 0.20 Chloroform/Acetone 15.26 13.96 2.18 28.88 20.88± 0.28
(a) (b)
(c) (d)
Figure 11: Photomicrographs of PHB-HV microspheres under different process conditions: a) T = 40ºC; b) T = 50ºC; c) Chloroform and d) Chloroform/acetone.
CONCLUSIONS
A process of oil-in-water emulsification with solvent evaporation was used to fabricate PHB and PHB-HV microspheres characterized by a volume mean diameter ranging from 31 to 390 µm.
Some processing conditions such as temperature, solvent composition and surfactant concentration in the aqueous phase were varied and their effects on the physical properties of the resultant microspheres were studied. Some properties such as zeta potential
and superficial area remained practically unchanged, regardless of the variations in the parameters investigated, whereas microsphere size was influenced by all processing conditions. The control of the size of the microspheres is important since size affects degradation rate, loading and initial burst release of the microspheres.
Further studies will involve the incorporation of a drug model to study the kinetics of its release from the microspheres.
REFERENCES
Amass, W., Amass, A. and Tighe, B., A Review of Biodegradable Polymers: Uses, Current Development in the Synthesis and Characterization of Biodegradable Polyesters, Blends of Polymers and Recent Advances in Biodegradation Studies, Polymer International, vol. 47, pp. 89-144, 1998.
Atckins, T.W. and Peacock, S.J., Journal of Biomaterials Science-Polymer, Ed. 7, 1075, 1996. Athanasiou, K.A., Niederauer, G.G. and Agrawal,
C.M., Sterilisation, Toxicity, Biocompatibility and Clinical Applications of Polylactic Acid/Polyglicolic Acid Copolymers, Biomaterials, vol. 17, pp. 93-102, 1996.
Baran, E.T., Ozer, N. and HasirciI,V., Poly(hydroxybutyrate-co-hydroxyvalerate)
Nanocapsules EnzymeCcarriers for Cancer Therapy: An in vitro Study, Journal of Microencapsulation, vol. 19, pp. 363-376, 2002. Chulia, D., Deleuil, M. and Pourcelot, Y., Powder
Technology and Pharmaceutical Processes. 557 p. Elsevier Science B.V. Amsterdam, 1994.
Donbrow, M., Microcapsules and Nanoparticles in Medicine and Pharmacy. CRC Press, Inc. Boca Raton, 347p., 1992.
Gürsel, I. and Hasirci, V., Properties and Drug Release Behavior of Poly(3-hydroxybutyric acid) and Various Poly(3-hydroxybutyrate-hydroxyvalerate) Copolymer Microcapsules, Journal of Microencapsulation, vol. 12, pp. 185-193, 1995. Hausberger, A. G. and DeLuca, P.P.,
Characterization of Biodegradable Poly(D,L-lactide-co-glycolide) Polymers and Microspheres, Journal of Pharmaceutical & Biomedical Analysis, vol. 13, nº. 6, pp. 747-760, 1995.
Holland, S.J., Ph.D. Diss., Aston University, Birminghan, 1986.
Holland, S.J. and Tighe, B.J., in Advances in Pharmaceutical Sciences. vol. 6, Chap. 4, p. 101, Academic, San Diego, CA. 1992..
Jabbal-Gill, I., Lin, W., Jenkins, P., Watts, P., Jimenez, M., Illum, L., Davis, S.S., Wood, J.M., Major, D., Minor, P.D., Li, X., Lavelle, E.C. and
Coombes, A.G.A., Potential of Polymeric Lamellar Substrate Particles (PLSP) as Adjuvants for Vaccines. Vaccine, vol. 18, pp. 238-250, 2000.
Koosha, F., Muller, R.H., Davis, S.S., and Davies, M.C.,
The Surface Chemical Stucture of Poly(hydroxybutyrate) Microparticles Produced by Solvent Evaporation Process, Journal of Controlled Release, vol. 9, pp. 149-157, 1989. Muller, R.H., DAVIS, S.S., Illum, L. and Mark, E.,
Particle Charge and Surface Hydrophobicity of Colloidal Drug Carriers, in: G. Gregoriadis, J. Senior and G. Poste (Eds.), Targeting of Drugs with Synthetic Systems, pp. 239-263, Plenum, New York, NY,1986.
Murakami, H., Kobayashi, M., Takeuchi, H. and Kawashima, Y., Preparation of Poly(DL-lactide-co-glycolide) Nanoparticles by Modified Spontaneous Emulsification Solvent Method, International Journal of Pharmaceutics, vol. 187, pp. 143-152, 1999.
Porte, H. and Couarraze, G., Microencapsulation Processes for the Manufacture of Systems Providing Modified Release of the Active Constituent. In: Powder Technology and Pharmaceutical Processes, Chap. 14, pp. 513-543, 1994.
Sendil, D., Gürsel, I., Wise, D.L. and Hasirci, V. Antibiotic Release from Biodegradable PHBV Microparticles, Journal of Controlled Release. vol. 59, pp. 207-217, 1999.
Washburn, E.D., West, C.J., Dorsey, N.E., Bichowsky, F.R. and Klemenc, A., International Critical Tables of Numerical Data, Physics, Chemistry and Technology. vol. 3, pp. 387, 1st ed., McGraw-Hill Book Company, 1928.
Yang, Y.Y., Chia, H.H. and Chung, T.S. Effect of Preparation Temperature on the Characteristics and Release Profiles of PLGA Microspheres Containing Protein Fabricated by Double-emulsion Solvent Extraction/Evaporation Method, Journal of Controlled Release, vol. 69, pp. 81-96, 2000.