Protective e¡ect of ions against cell death induced by acid stress in
Saccharomyces
Gilzeane dos Santos Sant’Ana1, Lisvane da Silva Paes1, Argentino F. Vieira Paiva1, Luciano Gomes Fietto1,2, Antoˆnio Helv ´ecio Totola1, Maria J. Magalha˜es Tr ´opia1, Denise Silveira-Lemos3, Caˆndida Lucas4, Juliana L. Rangel Fietto1,2, Rogelio L. Branda˜o1& Ieso de Miranda Castro1
1
Laborat ´orio de Biologia Celular e Molecular (LBCM), Nu´cleo de Pesquisa em Cieˆncias Biol ´ogicas, Departamento de Farm ´acia, Instituto de Cieˆncias Exatas e Biol ´ogicas, Universidade Federal de Ouro Preto, Ouro Preto, MG, Brazil;2Departamento de Bioqu´ımica e Biologia Molecular, Universidade
Federal de Vic¸osa, Vic¸osa, MG, Brazil;3Nu´cleo de Pesquisa em Cieˆncias Biol ´ogicas, Universidade Federal de Ouro Preto, Ouro Preto, MG, Brazil; and 4
Departamento de Biologia, Centro de Biologia (CB-UM), Universidade do Minho, Braga, Portugal
Correspondence:Ieso de Miranda Castro, Laborat ´orio de Biologia Celular e Molecular (LBCM), Nu´cleo de Pesquisa em Cieˆncias Biol ´ogicas, Departamento de Farm ´acia, Instituto de Cieˆncias Exatas e Biol ´ogicas, Universidade Federal de Ouro Preto,Campus Morro do Cruzeiro, Ouro Preto CEP 35400.000, MG, Brazil. Tel.:155 31 35 591 722; fax:155 31 35 591 680; e-mail: [email protected]
Received 19 February 2009; revised 31 March 2009; accepted 17 April 2009.
Final version published online 18 May 2009.
DOI:10.1111/j.1567-1364.2009.00523.x
Editor: Andre´ Goffeau
Keywords
Saccharomyces boulardii; probiotic; acid tolerance;ENA genes.
Abstract
Saccharomyces boulardiiis a probiotic used to prevent or treat antibiotic-induced gastrointestinal disorders and acute enteritis. For probiotics to be effective they must first be able to survive the harsh gastrointestinal environment. In this work, we show that S. boulardiidisplayed the greatest tolerance to simulated gastric environments compared with several Saccharomyces cerevisiae strains tested. Under these conditions, a pH 2.0 was the main factor responsible for decreased cell viability. Importantly, the addition of low concentrations of sodium chloride (NaCl) protected cells in acidic conditions more effectively than other salts. In the absence ofS. boulardiimutants, the protective effects of Na1in yeast viability in acidic conditions was tested using S. cerevisiae Na1-ATPases (ena1-4), Na1/H1
antiporter (nha1D) and Na1/H1antiporter prevacuolar (nhx1D) null mutants,
respectively. Moreover, we provide evidence suggesting that this protection is determined by the plasma membrane potential, once altered by low pH and low NaCl concentrations. Additionally, the absence or low expression/activity of Ena proteins seems to be closely related to the basal membrane potential of the cells.
Introduction
Living microorganisms have long been used as dietary supplements to enhance growth and performance or in the prevention and treatment of intestinal infections of humans and other animals (Czeruckaet al., 1991, 2007; Czerucka & Rampal, 2002; Mitterdorfer et al., 2002a). Among the biotherapeutic/probiotic agents most commonly used are select strains of bacteria (e.g.Lactobacillusand Bifidobacter-ia) and yeasts (e.g.Saccharomyces boulardii and Saccharo-myces cerevisiae). Several mechanisms have been proposed to explain the protective effects conferred by these organ-isms, including their potential to add nutritional value to food products (Mitterdorferet al., 2002a, b), the competi-tive exclusion of undesirable microorganisms (Nader-de-Maciaset al., 1993), the production of antimicrobial
sub-stances, the inhibition of pathogen adhesion, immune response modulation (Qamaret al., 2001) or the inactiva-tion of toxins and/or toxin receptors (Castagliuolo et al., 1996, 1999).
Saccharomyces boulardii, a yeast isolated from the lychee fruit from Indochina has been used to treat diarrhea caused by several pathogens. Therefore, the protective effects con-ferred by this yeast against experimental diseases have been extensively studied (Toothaker & Elmer, 1984; Czerucka et al., 1991; Diaset al., 1995; Rodrigueset al., 2000; Czerucka & Rampal, 2002). Previously, we have demonstrated that yeast cells are able to internalize cholera toxin, triggering cAMP-mediated responses such as trehalase activation (Branda˜oet al., 1998), suggesting that toxin sequestration could be an additional mechanism by which yeast cells exerted protective effects.
Although comparative molecular studies have shown that S. boulardiicould be considered a strain ofS. cerevisiae, it is metabolically and physiologically very different (Mitterdor-feret al., 2002a, b; Fiettoet al., 2004; Czeruckaet al., 2007), for example,S. boulardiican survive the stress of a simulated gastric environment and bile salts toxicity (Fiettoet al., 2004). In order to function as effective probiotics, yeast cells must have the ability to sense and respond to changes in the host environment, including temperature, bile salt concen-trations and low gastric pH levels. These are common properties used for the selection of probiotic strains and are considered critical to both survival of the microorganism and for their capacity to extend potential health benefits to the host (Charteriset al., 1998; van der Aa Kuhleet al., 2005). The capacity to tolerate low pH levels by maintaining cytoplasmic pH at physiologically favorable levels is critical to survival in the gastrointestinal environment. By pumping protons out of the cells the H1 pump Pma1 H1-ATPase
contributes, in concert with proton/cation antiporters, to intracellular pH regulation (Serrano et al., 1986). Ion homeostasis in yeast is achieved by the coordinated activity of plasma membrane efflux and influx systems and by sequestration systems (Gaber, 1992; Navarre & Goffeau, 2000). Moreover, the transmembrane H1-gradient
gener-ated by H1-pumping is the driving force for active nutrient
uptake directly affecting cell survival.
Taking into account these considerations, we investigated the S. boulardii and S. cerevisiae responses to separate elements of a simulated gastric environment and the effect of different salts [especially sodium chloride (NaCl)] in cellular tolerance to an acidic environment. Despite being a S. cerevisiae strain (Fiettoet al., 2004), this work confirms thatS. boulardiiis metabolically and physiologically differ-ent from other S. cerevisiae strains and exhibits a higher tolerance to acid stress. We found that the presence of Na1
ions at the low concentrations found in gastric fluids confers protection to the yeast cells exposed to acid stress. Moreover, we provide evidence suggesting that systems involved in maintaining the plasma membrane potential (Pma1p H1
-ATPase and secondary transporters systems) are linked to the acidic stress response and that the plasma membrane potential established by the presence of NaCl is the major determinant of Na1-mediated protection against acidic
stress.
Materials and methods
Yeast strains and growth conditions
Saccharomyces boulardii (Floratils, Merck S.A., Rio de Janeiro, Brazil) and other yeast strains listed in Table 1 were grown in an orbital shaker (200 r.p.m.) at 301C in YP medium [1% (w/v) yeast extract and 2% (w/v) peptone]
containing 4% (w/v) glucose (YPD). Cellular growth was monitored by measuring OD600 nm.
Gastric and acid stress conditions
Yeast cell cultures (OD600 nm 1.0–1.2) were harvested by
centrifugation at 3000g for 5 min, washed with YP media twice and incubated in an orbital shaker at 371C for 1 h under the following conditions: (1) a simulated gastric environment composed of an aqueous solution containing 3 g L1pepsin (Sigma, St. Louis, MO) (3200–4500 U mg1 protein), 86 mM NaCl, pH adjusted to 2.0 with 1 M HCl (Charteriset al., 1998); (2) an aqueous solution at pH 2.0 (acid tolerance condition). This condition was supplemen-ted with a variety of salts (see figure legends), as well as cycloheximide, to assess the effects of, respectively, different ions and protein synthesis on cell survival. Milli-Q water was utilized as a negative control. Aliquots were collected after 0, 5, 10, 15, 30 and 60 min of incubation and cell viability was determined microscopically using a Neubauer chamber and vital staining with methylene blue (Mills, 1941).
Na1and K1content
Cell cultures (OD600 nm1.0) were washed with YP media and
incubated in HCl (pH 2.0), 86 mM NaCl in a rotary shaker at 371C. At various time intervals, cells were collected on Millipore (Billerica, MA) membrane filters and rapidly washed with a 20 mM MgCl2solution. Then, acid extraction
was performed with 0.1 M HCl, overnight at 101C. The Na1
and K1 content of the extracts were assessed by atomic emission spectrometry (Rodr´ıguez-Navarro & Ramos, 1984). Results were expressed in nanomoles of Na1or K1
mg1of dry weight.
Salt tolerance
Yeast cells were grown to mid-log phase in liquid YPD media (2% glucose) and then diluted to an OD600 nmof 1.0. Three
microliters of this dilution were used to inoculate solid YPD (2%) medium supplemented with different concentrations of NaCl. Plates were visualized after 72 h at 301C.
Intracellular pH
The intracellular pH ofS. cerevisiaecells was assessed based on the relative distribution of [2-14C]-propionic acid (Ka= 1.35105) between the cell’s interior and the
labeled propionic acid in the extracellular medium and in the cytoplasm was previously determined. The cells (4 mL) were then passed through a glass fiber filter (Whatman GFC) and washed with cold water (10 mL). The filters were suspended in a scintillation cocktail and placed in a Beck-man LS 6000SC scintillation counter. To determine the total concentration of extracellular propionic acid, 500mL of the cell suspension was centrifuged for 2 min at 10 000g. and the radioactivity of 20mL of the supernatant was also measured. The total intracellular concentration of propionic acid was determined using 2.2mL mg1dry biomass as the value of the internal cell volume (Viegas & S´a-Correia, 1995). External pH was measured using a pH Meter (Orion Model 720A). Values for pHiwere calculated as the means of
at least two determinations using cells from at least three independent cultures.
Measurement of H1-ATPase activity
Measurements of H1-ATPase activity were made using
375 mg cells (wet weight) grown in YPD (4% glucose) to an
OD600 nmof 1.0–1.2. After collection on glass fiber filters, the
cells were removed from the filters and immediately frozen in liquid nitrogen and stored until use. Plasma membrane isolation and determination of ATPase activity was per-formed as described previously (Becher dos Passos et al., 1992). Protein content was determined using the method developed by Lowryet al. (1951).
RNA isolation and Real-Time (RT) PCR
For the shift from glucose growth to an acidic environment (pH 2.0, 86 mM NaCl) yeast cells were grown in 50 mL YPD media 4% (w/v) to an OD600 nm 1.0–1.2. The sample was
split in two and washed quickly by centrifugation with Milli-Q water. One of the cellular pellets was used for RNA extraction (control). The other was resuspended in an aqueous solution (pH 2.0, 86 mM NaCl), rapidly mixed and incubated at 371C for 30 min. Samples were collected and washed by centrifugation with Milli-Q water. The pellet was used for RNA extraction (stressed cells). Total RNA was extracted from yeast cells following the protocol of Kohrer &
Domdey (1991) and stored at 801C. RNA quantity and integrity was monitored by spectrophotometry and agarose gel electrophoresis, respectively.
Total RNA (4mg) was treated with DNAse (Promega, Madison, WI). Reverse transcription was carried out using M-MLV Reverse Transcriptase (Promega) and oligo-dT(18) primers (Promega) according to the manufacturer’s instruc-tions. RT-PCR reactions were performed on an ABI7500 instrument (Applied Biosystems, Foster City, CA), using Platinums qPCR SuperMixes (Invitrogen). The amplifica-tion reacamplifica-tions were performed as follows: 2 min at 501C, 10 min at 951C and 40 cycles at 941C for 15 s and 591C for 1 min. To confirm primer specificity, the dissociation curves of all amplification products were analyzed on the ABI7500 instrument. Fold variation in gene expression was quantified using the comparativeCtmethod: 2½DCtðTreatmentÞDCtðControlÞ,
which is based on a comparison of expression of the target gene (normalized to the endogenous control) between the experimental and control samples. Actin RNA was used to normalize all values in the RT-PCR assays because its expression levels do not change between treatments. Primers ENA1 (forward: 50-AGTTGGCGGTATTGCTTTTCTG-30; reverse: 50-TTGAGAGGCCATGACGATGAT-30), NHA1 (forward: 50-CGCGCCGCCACATTTT-30; reverse: 50-CATT CCAATCTCCTCATTTACGTTGT-30), and ACT1 (forward: 50-GCCGAAAGAATGCAAAAGGA-30; reverse: 50-TCTGG AGGAGCAATGATCTTGA-30) were used for amplification.
Membrane potential
To carry out membrane potential (m.p.) measurements we used the bis[1,3-dibutylbarbituric acid(5)trimethine oxonol diBA-C4-(3)] dye. The flow cytometric method was based
on the assumption that the dye is distributed across the cytoplasmic membrane according to the Nersnt equation (Krasznai et al., 1995). The Di-BaC-4(3) dye (Sigma) was dissolved in 1% DMSO and stored at 201C in the dark. Fresh dilutions of the stock were prepared for each experi-ment.
A Becton Dickinson FACS-Calibur flow cytometer with an argon ion laser was utilized. Oxonol fluorescence was excited Table 1.Saccharomyces cerevisiaestrains
Yeast strains Genotype Sources
UFMG 20 Wild type Martinset al. (2008)
UFMG 24 Wild type Martinset al. (2008)
S. boulardii Wild type FLORATILs, Merck S.A.
W303 Mataleu2-3,112 ura3-1 trp1-1 his3-11 Johan M. Thevelein
15 ade2-1 can1-100 GAL mal SUC2
LBCM 479 W303 Mataena1<HIS3<ena4 Jos ´e Ramos
LBCM 511 W303 Matanha<LEU2 Hana Sychrov ´a
LBCM 500 W303 Mataena1<HIS3<ena4 nha1<LEU2 Hana Sychrov ´a
with the 488-nm line at 300–700 mW power. The output optics contained a combination of a 560-nm longpass filter to block the scattered excitation light and a 540-nm band filter. Small-angle forward-scattered light was also detected and used for electronic gating of the data collection. Data collected from cellular debris were excluded from the analysis. Cells grown in YPD medium containing 4% (w/v) glucose to an OD600 nm 1.0–1.2 were washed twice with YP and
resuspended in phosphate-buffered saline (PBS: 137 mM NaCl, 2.7 mM KCl, 10 mM Na2HPO4 and KH2PO4, pH
7.4). Cells were fixed overnight at 41C (W303 andena1-4D
strains) and at room temperature (RT) (S. boulardii). Ice-cold or RT solutions of 0.33 M paraformaldehyde, 1 M NaOH, 0.05 M sodium cacodylate and 0.11 M NaCl, pH 7.2, were slowly added with mild stirring to an equal volume of cells (5106cells mL1). The fixation was monitored by
staining with methylene blue. Fixed cells were washed twice with PBS and resuspended in PBS containing various extra-cellular dye concentrations at 5106cells mL1for 30 min in the dark. Means of the fluorescence measured with the flow cytometer were used to construct a calibration curve of fluorescence intensity measured from stained cells vs. extra-cellular dye. This curve allows the evaluation of the m.p. in millivolts using fluorescence readings of the cells both in the depolarized state and in the state of interest (Krasznaiet al., 1995). One calibration curve was constructed for each strain (S. boulardii, W303 and ena1-4 mutant).
The determination of the absolute potential of yeast cells exposed to acid pH and 86 mM NaCl was assessed after dilution of the cells in PBS (5106cells mL1) containing 500 nM of the dye and measuring the fluorescence intensity values for the sample of interest (FIS) and when completely depolarized (FI0). These values allowed the determination of the intracellular and extracellular concentrations of the dye (DiSandDeS). The value of the Di/Deratio was used to calculate
the transmembrane potential (Krasznai et al., 1995). Stain with propidium iodide allowed the identification of the population of cells to be analyzed because there is a parallel between patterns of staining with PI and Di-BaC-4(3).
Reproducibility of results
All experiments were performed at least three times with consistent results. SDs are indicated in each figure.
Results and discussion
Tolerance to the gastric environment and gastric constituents
Survival of probiotic microorganisms is dependent upon their capacity to withstand passage through the digestive tract. For this reason, tolerances to low gastric pH and bile salts have been used as a selection criteria of microorganisms
with probiotic potential (Ouwehand et al., 1999). Our previous studies with S. boulardii in simulated gastric, pancreatic and intestinal environmental conditions, revealed that this yeast had high tolerance to different stress condi-tions, primarily gastric stress (Fietto et al., 2004). In the current study, this analysis was extended to different wild-type strains and specific mutants ofS. cerevisiae, adequate for unraveling the physiology of this tolerance.
Saccharomyces boulardiitolerance to a simulated gastric environment (an aqueous solution containing 86 mM NaCl, 3 g L1pepsin at pH 2.0) was determined by measuring yeast viability over time in comparison toS. cerevisiaewild-type strains W303 (a laboratory strain), UFMG20 and UFMG24. The UFMG20 and UFMG24 strains were selected from a yeast collection based on their high tolerance to mild heat shock and high trehalose accumulation following stress treatments (Martinset al., 2008). The rationale underlying this selection was that strains isolated from nature are usually more resistant to stress and that trehalose accumula-tion is generally used as an general indicator of stress resistance (Voit, 2003; Martinset al., 2008).
All strains remained viable for 1 h poststress exposure withS. boulardiihaving the highest tolerance (Fig. 1a). Cell viability was evaluated upon separated exposures to the constituents of the simulated gastric environment, i.e. 85 mM NaCl, 3 g L1pepsin, pH 2.0. The results showed that neither NaCl nor pepsin significantly affected cell viability (Fig. 1b). In contrast, cellular survival decreased dramati-cally at pH 2.0, with the exception ofS. boulardiithat had previously been shown to resist low pH levels (Fiettoet al., 2004; van der Aa Kuhleet al., 2005; Edwards-Ingramet al., 2007). Additionally, the results obtained at pH 2.0 in the presence of NaCl (Fig. 1b) revealed that the addition of NaCl protected both S. cerevisiae and S. boulardii cells from deleterious low pH effects. Nevertheless, this protective effect (after a 1-h exposure) appeared higher inS.boulardii (84% cell survival) than in S. cerevisiae W303 (33% cell survival). The protective effect of NaCl was negatively influenced by the presence of cycloheximide (5mg mL1), suggesting a partial role for protein synthesis in the NaCl-mediated protective effect (Fig. 2a and b).
Ion protection during acid stress and the role of Na1
could be related to the intrinsic toxicity of this ion (Ruiz et al., 2006).
The chloride ion was common to all the salts examined, however, this ion was likely not responsible for the protec-tive effects observed because Clhas been reported to be extremely toxic to yeast cells, which take up very limited amounts of this anion, maintaining low intracellular Cl levels (Conway & Downey, 1950; Couryet al., 1999; Kuroda et al., 2004).
In view of the absence of chemical specificity, the mode of action underlying the positive effects of salt on cells’ survival at low pH is likely to involve global intracellular ion homeostasis. This is maintained as a delicate balance by the interplay of a large panoply of primary and secondary transporters at the plasma and vacuole mem-branes.Saccharomyces cerevisiae strains maintain cytoplas-mic Na1and K1concentrations within specific ranges using
systems that include plasma membrane H1-ATPase
(Pma1p), Na1-ATPases (Ena 1-4p) (Benito et al., 1997),
Na1/H1 antiporters (Nha1p and Nhx1p) (Nass & Rao,
1998) and K1(Na1) transporters (Trk1/2p) (Ko & Gaber,
1991). Na1efflux inS. cerevisiaeis primarily mediated by
the plasma membrane P2-type Na1-ATPase encoded by the PMR2/ENAlocus, containing a cluster of up to five (ENA1-5) tandemly-arranged and highly similar genes (Garciade-blas et al., 1993). Therefore, and in order to gain a better understanding of the protection conferred by sodium upon acid stress, we evaluated the tolerance of yeast mutants defective in the primary Na1transporters, i.e.ena1-4,nha1
andnhx1(Table 2).
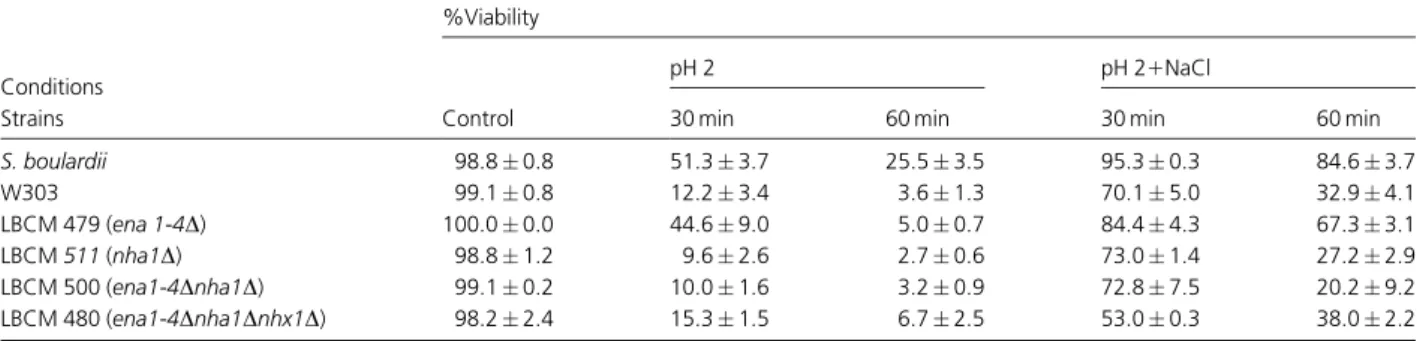
The viability of the mutant strainena1-4at pH 2.0 in the absence or presence of sodium ions was higher than that of S. cerevisiae W303 parental strain and similar to that of S. boulardii (Table 2). These results suggested that Na1 -Fig. 1.Yeast cell viability. (a) Yeast cell tolerance
to a simulated gastric environment.
Saccharomyces boulardii(m), W303 (
), UFMG 20 (’) and UFMG 24 (~). (b) Isolated effects of gastric environment constituents and the protective effect of NaCl on yeast cell viability.Saccharomyces boulardii(closed symbols) and
Saccharomyces cerevisiaeW303 cells (open symbols) were exposed to isolated constituents of the gastric environment. Viability was evaluated during a 60-min time course; pH 2.0 (m,n); pepsin 3 g L1(
’,&); NaCl 86 mM (~,}); NaCl1pH 2.0 (
,).Fig. 2.Effect of cycloheximide on sodium protect effect. (a)Saccharomyces boulardii
and (b) W303 were incubated at pH 2.0 (m), pH 2.0186 mM NaCl (
), pH 2.01NaCl1CH () and H2O (n) and percent viability determinedATPase silencing was not only important to improved survival in acidic conditions but also in the presence of NaCl. Our hypothesis was that a minimal intracellular ion concentration was needed to resist low pH as well as to achieve the salt protection effect and that low ion levels, probably higher than the one found under regular environmental circumstances (20–25 mM), must be maintained independent of the mole-cular mechanism mediating protection.
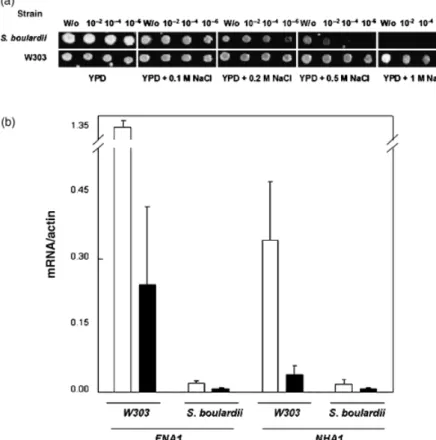
Taking into account thatS. boulardiipresents a pheno-type very similar to that of the ena1-4D strain (high resistance to low pH levels in the presence of sodium ions, Table 2) it seems plausible that S. boulardii could express constitutively low ENA gene products resulting in higher sensitivities to high sodium environments. In fact, as shown in Fig. 4a, S. boulardiidisplayed higher sensitivity to Na1
ions compared with the W303 wild-type strain. Consis-tently, an increase in NaCl concentrations (up to 0.2 M) had a negative effect on acid tolerance byS. boulardii(data not shown). Also, analysis of ENA1 expression showed that S.boulardiihad lowerENAtranscript levels compared with
S. cerevisiaeW303 and that transcription ofENAwas affected by low pH/NaCl, in both yeast strains (Fig. 4b). ENA1 transcription has been reported previously to be stimulated by alkaline but not by acidic conditions (Garciadeblaset al., 1993; Ba˜nuelos et al., 1998). Additionally, these authors mention a salt-mediated induction, which is unlikely in the present case, due to the very low amounts of salt mandatory to obtain protection against low pH-induced death.
Additionally Nha1p Na1/H1 antiporter was investi-gated. Nha1p mediates both Na1 and K1 efflux while
Nhx1p, localized to the prevacuolar compartment, mediates Na1compartmentalization (Nass & Rao, 1998). The tran-scription ofNHA1is important to sodium extrusion at low pH (Ba˜nueloset al., 1998). We found thatNHA1transcripts at pH 2.0 in the presence of NaCl were lower inS. boulardii than inS. cerevisiaeW303 (Fig. 4b). Unlike observed with ENA mutants above, the expression of NHA1 did not correlate with viability results (Table 2). Thenha1mutant presents a viability phenotype identical to S. cerevisiae parental strain, but different from that ofS. boulardii. One
Fig. 3.Effect of salts (86 mM) on yeast cell viability at pH 2.0.Saccharomyces boulardii(a) and W303 (b) were incubated at pH 2.0 (m), pH 2.0, NaCl (
), pH2.0, KCl (’), pH 2.0, CaCl2(~), pH 2.0, MgCl2(n) and pH 2.0, LiCl (&) and
percent viability determined over time.
Table 2. Effect of pH 2 and Na1on strain viability
Conditions
%Viability
Control
pH 2 pH 21NaCl
Strains 30 min 60 min 30 min 60 min
S. boulardii 98.80.8 51.33.7 25.53.5 95.30.3 84.63.7
W303 99.10.8 12.23.4 3.61.3 70.15.0 32.94.1
LBCM 479 (ena 1-4D) 100.00.0 44.69.0 5.00.7 84.44.3 67.33.1
LBCM511(nha1D) 98.81.2 9.62.6 2.70.6 73.01.4 27.22.9
LBCM 500 (ena1-4Dnha1D) 99.10.2 10.01.6 3.20.9 72.87.5 20.29.2
LBCM 480 (ena1-4Dnha1Dnhx1D) 98.22.4 15.31.5 6.72.5 53.00.3 38.02.2
can thus reason that NHA1 is not a major player in this process.
Intracellular pH
Following the lead of intracellular ion homeostasis, we measured the intracellular pH of the several strains at external pH 2.0 and 86 mM NaCl.Saccharomyces boulardii, theS. cerevisiaewild type and theena1-4mutant, presented very similar internal pH of 6.080.01, 6.040.09 and 6.040.03, respectively. Under similar conditions, the nha1D mutant showed a lower intracellular pH (4.980.20) than the double and triple mutants (respec-tively, 6.580.11 and 6.780.11). The pH values observed for thenha1mutants were quite different from the 6.08–6.09 found in the other strains (including theenamutants).
Under regular circumstances, the low viability of yeast cells at low pH could be linked to changes in intracellular pH (Sychrova et al., 1999; Kinclova-Zimmermannova et al., 2006). For this reason, the lower pH values observed for thenha1mutants could likely be deleterious for vital cellular functions (Imai & Ohno, 1995; Fernandes & S´a-Correia, 2001). Yet, the viability of this strain did not suffer accord-ingly (Table 2), neither did any of the other mutants. Therefore, it follows that the pH variations observed cannot
account for either the low pH/low salt stress response or protective effects.
Because the Nha1p is a Na1/H1antiporter, its activity should be higher in cells with higher proton motive forces for example, the intracellular pH of thenhpa1D strain was higher compared with the wild-type strain (Sychrovaet al., 1999). In our study, thenha1mutant grown in YPD showed a higher internal pH (6.720.04). The internal pH value found for thenha1mutant grown at pH 2.0, 86 mM NaCl was pH 4.98, suggesting that in this mutant the passive influx of protons could affect ion efflux and influx systems that contribute to internal pH stability. In addition, no information has been published relative to the effect of external pH levels as low as pH 2.0 on the internal pH and on yeast viability.
Participation of P-type ATPases in the gastric stress response
The yeast viability data suggested the participation of P-type ATPases in gastric stress tolerance (Table 2 and Fig. 4b). Screening of the S. cerevisiae genome identified nine P2
-ATPases, including the Pma1p, Pma2p and the Ena1-5p Na1-ATPases (Morsommeet al., 2000). In low-pH
environ-ments, yeast cells need an effective H1-efflux system. It is
also well known that Pma1p generates the electrogenic Fig. 4.Salt tolerance and transcript levels of
ENA1andNHA1. (a) Exponentially grown cells were diluted and spotted onto YPD media sup-plemented with different NaCl concentrations. Results photographed after 3 days of growth. (b) Transcript levels ofENA1andNHA1in
proton gradient that drives secondary transport, contribut-ing to the intracellular pH regulation that consequently affects cell viability. For this reason, the activity of the PMA1-encoded H1-ATPase is fine-tuned at different levels
to match its physiologic function. Therefore, we investigated the involvement of the H1-ATPase in acid tolerance in the
presence of low-Na1concentrations by measuring the H1
-ATPase activity in S. boulardii, W303 and ena1-4 cells exposed to pH 2.0 plus NaCl (Fig. 5). The results showed that there is clear H1-ATPase activation inS. boulardiiand ena1-4D cells; however, this enzyme seems not to be activated by pH 2.0 inS. cerevisiaeW303. Activation of the H1-ATPasein vivois essential to counteract several types of
stress, including a decrease in internal pH (Carmeloet al., 1996). Accordingly, acidic pH levels have been reported to regulate H1-ATPase activityin vivoboth positively (Eraso &
Gancedo, 1987) or negatively (Carmelo et al., 1996). This apparent contradiction could be a function of the acid used to lower pH, i.e. succinic or hydrochloric acids, respectively. Our results suggested that the most pronounced tolerance to extreme acidic stress condition in the probiotic strain and ena1-4 mutant was due partly to a higher H1-ATPase
activity under such condition. Nevertheless, the results of H1-ATPase activity did not reflect any differences on the
maintenance of internal pH inS. boulardiiand W303 cells. The acid-resistant green algaDunaliella acidophilagrown in a medium at pH 1.0 shows a cytoplasmic pH close to 7 (Gimmleret al., 1989). Below, we briefly discuss adaptations
necessary in order to maintain a large transmembrane H1 -gradient.
Na1and K1content
Taking into consideration all the above it became mandatory to measure the intracellular concentrations of the main ionic players, Na1 and K1. Figure 6 shows the Na1 and K1
contents of different yeast cells grown in YPD media (control) and after exposure to pH 2.0, 86 mM NaCl. Saccharomyces boulardiiand all ENA1-4mutants accumu-lated more Na1and K1when grown in YPD medium than
the parentalS. cerevisiaeW303 strain. On the other hand, all the strains lost Na1to the external medium when exposed
to pH 2.0, 86 mM NaCl until equilibrium was reached (internal concentration = external concentration, i.e. 85 mM). Because Na1 efflux was still observed in the ena1-4D nha1D double mutant, it is possible that in S. cerevisiae another permease may be involved in Na1/K1extrusion in
addition to Nha1p and Ena1-4p. It appeared that sodium protected cells against acidic stress indirectly, because although we detected low viability at pH 2.0 plus NaCl, there was still a considerable intracellular Na1accumulation
(e.g. see viability data and Na1levels in the double mutant).
More importantly, it appears that, regardless to the amounts/combinations of transport proteins expressed, the end result is the equilibrium between the inner and outer faces of plasma membrane, thus affectingDc. On the other hand,DpH is less affected, as can be seen from results above. Considering that plasma membrane potential depends on these two parameters, it is conceivable that it must be very different inS. boulardiiin comparison withS. cerevisiae.
Membrane potential
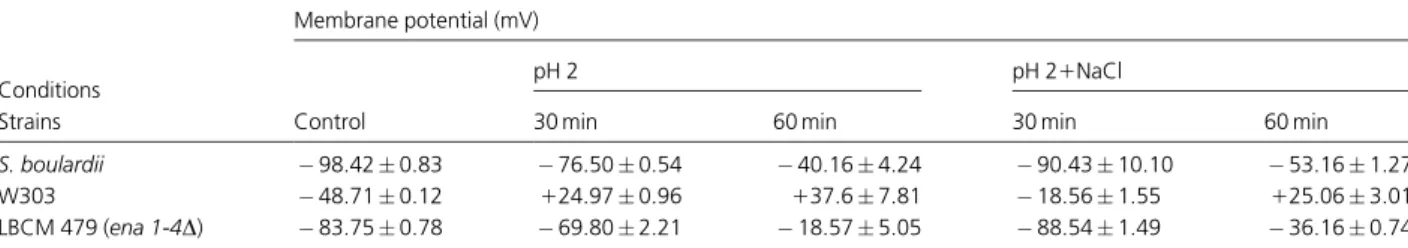
In view of all the above results, a major picture emerges, pointing to a putative major contribution of m.p. to the salt-mediated low pH response. In order to evaluate this hypothesis, we compared the m.p. of different strains using the Nernstian distribution of the monovalent dye Di-BaC-4(3). The m.p. in S. cerevisiae has been reported to be between50 and 130 mV (Borst-Pauwels, 1981). Results show thatS. boulardiinaturally presents a more polarized m.p. thanS. cerevisiae(Table 3). Upon 1-h transference to pH 2.0, S. boulardii m.p. depolarized c. 60%, while S. cerevisiaethough polarity was inverted from negative to positive, changing from48 to137 mV (Table 3). Hofer & Kunemund (1984) used the distribution of TPP1
(tetra-phenyphosphonium ion) and SCN (thiocyanate ion) as indicators of m.p. in the yeast Rhodotorula glutinis and showed continuous transition from TPP1 accumulation
(Dcnegative) at pH values above 4.5 to SCNaccumulation (indicating positive Dc) at pH values o4.5, due to increasing diffusion of H1into the cells at low pH. Gimmler Fig. 5. H1-ATPase activity. Plasma membrane H1-ATPase activation in
et al. (1989) showed that the alga D. acidophila grown in medium at pH 1.0 exhibited a positive m.p. of about pH170 mV. Such positive potential has been postulated for acidophilic bacteria (Krulwich & Guffanti, 1983). Although a positive m.p. would be useful to decrease the influx of H1
from the medium into the cell, it would be more difficult to maintain a proper Na and K balance (Gimmleret al., 1989). Saccharomyces boulardiihas low levels of ENA1 expres-sion, and ena1-4Dmutants behaved similarly toS. boulardii. For this reason we compared the above results with this mutant. Again it accompanied closely the results and their variations observed withS. boulardii(Table 3). The effect of transferring the cells to pH 2.0 and salt yielded, at 30 min, a return to the control values of all strains. Yet, at 1-h incubation time,S. boulardiihad again depolarized, though less intensively (40%) and S. cerevisiae parental strain again inverted polarization this time presenting a lower m.p. than at pH 2.0 alone. Taken together, the results show that addition of 86 mM sodium delayed the pH 2.0-induced depolarization in all the strains studied. The positive m.p. seems to suppress the uptake of cations (Gimmler et al., 1989). In addition, it appeared thatENA1-4deletions in the parental strain (W303) or low expression of Ena proteins
(S. boulardii) had visible effects on the plasma membrane potential of yeast cells. Deletions ofENAgenes increased the plasma membrane potential (Table 3). The higher polariza-tion observed in S. boulardii and ENA mutants relates to these strains’ higher sensitivity to salt as described above (Fig. 4). The relationship between membrane hyperpolar-ization and salt sensitivity was described before (Navarre & Goffeau, 2000). These authors suggested that the hyperpo-larization of the plasma membrane potential due to the PMP3deletion promoted a nonspecific influx of monova-lent cations.
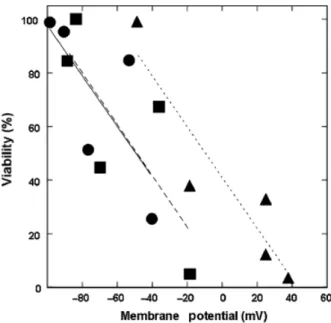
Figure 7 shows the relationship between cell viability (Table 2) and plasma membrane potential (Table 3). The figure includes data from both conditions (absence and presence of 86 mM NaCl). The slope of the three curves was not significantly different (P= 0.9995), suggesting that the effect of NaCl on m.p. was the same for the three strains examined. Based on these data we conclude that the increased proton influx induced by HCl (pH 2.0) resulted in depolarization of the plasma membrane and decreased cell viability. It is likely that the increased resistance of S. boulardiiand theena1-4mutant to acidic stress (presence or absence NaCl) was due to the already high basal plasma m.p. Fig. 6.Intracellular ions levels. Levels of (a) Na1
and (b) K1inSaccharomycesstrains grown
in YPD medium and submitted to pH 2.0 (HCl)186 mM NaCl.Saccharomyces boulardii
(
),Saccharomyces cerevisiaeW303 (m),ena 1-4mutant (’),nha1mutant (),ena1-4 nha1
mutant (D) andena1-4 nha1 nhx1mutant (&).
Table 3.Membrane potential analysis
Conditions
Membrane potential (mV)
Control
pH 2 pH 21NaCl
Strains 30 min 60 min 30 min 60 min
S. boulardii 98.420.83 76.500.54 40.164.24 90.4310.10 53.161.27
W303 48.710.12 124.970.96 137.67.81 18.561.55 125.063.01
LBCM 479 (ena 1-4D) 83.750.78 69.802.21 18.575.05 88.541.49 36.160.74
of nonstressed cells, product of the relative activity of the Pma1p H1-ATPase (Fig. 5) together with secondary
trans-porters. The sensitivity of fluorescent dye distribution to membrane potential was used to assess yeast cell viability and predict fermentation activity of yeasts cells (Attfield et al., 2000).
Final remarks
In the present work, we demonstrate that yeast resistance to an acidic environment is improved by the presence of very low salt concentrations in the medium. According to the present results, the salts protective ability over extreme acidic pH relates with the unspecific effects of a mono or divalent cation on membrane potential achieved by the activity of the Pma1p H1-ATPase together with secondary
transporters. The mechanism behind these observations is yet undefined, although it is plausible that the indirect ion effects on homeostasis were related to signaling events that might have triggered specific responses to acidic stress consistent with the dependence of this process onde novo protein synthesis. On the other hand, the mechanisms that allow the yeast to survive to a large transmembrane H1 -gradient involve a low permeability for H1, high H1-export
capacity (which is energy dependent) and a high buffer capacity. Future work will focus on these aspects.
Acknowledgements
The authors thank Drs Jose Ramos, Carlos A. Rosa and Hana Sychrova for providing yeast strains. This work was
supported by grants from Fundac¸a˜o de Amparo a` Pesquisa do Estado de Minas Gerais (FAPEMIG) – G. dos Santos Sant’Ana Contract no. CBB 900-6 and CBB APQ-4615-4.01/ 07. G.d.S.S. is supported by a fellowship from FAPEMIG.
References
Attfield PV, Kletsas S, Veal DA, van Rooijen R & Bell PJL (2000) Use of flow cytometry to monitor cell damage and predict fermentation activity of dried yeasts.J Appl Microbiol89:
207–214.
Ba˜nuelos MA, Sychova H, Bleykasten-Groshans C, Souciet J-L & Potier S (1998) The Nha1 antiporter ofSaccharomyces cerevisiaemediates sodium and potassium efflux.Microbiol
144: 2479–2758.
Becher dos Passos J, Vanhalewyn M, Branda˜o RL, Castro IM, Nicoli JR & Thevelein JM (1992) Glucose-induced activation of plasma membrane H1-ATPase in mutants of the yeast Saccharomyces cerevisiaeaffected in cAMP metabolism, cAMP-dependent protein phosphorylation and the initiation of glycolysis.Biochim Biophys Acta1136: 57–67.
Benito B, Quintero FJ & Rodr´ıguez-Navarro A (1997) Overexpression of the sodium ATPase ofSaccharomyces cerevisiae: conditions for phosphorylation from ATP and Pi.
Biochim Biophys Acta1328: 214–225.
Borst-Pauwels GW (1981) Ion transport in yeast.Biochim Biophys Acta650: 88–127.
Branda˜o RL, Castro IM, Bambirra EA, Amaral SC, Fietto LG, Tropia MJ, Neves MJ, Dos Santos RG, Gomes NCM & Nicoli JR (1998) Intracellular signal triggered by cholera toxin in
Saccharomyces boulardiiandSaccharomyces cerevisiae.Appl Environ Microb64: 564–568.
Carmelo V, Bogaerts P & S´a-Correia I (1996) Activity of plasma membrane H1-ATPase and expression of PMA1 and PMA2
genes inSaccharomyces cerevisiaecells grown at optimal and low pH.Arch Microbiol166: 315–320.
Castagliuolo I, LaMont JT, Nikulasson ST & Pothoulakis C (1996)
Saccharomyces boulardiiprotease inhibitsClostridium difficile
toxin A effects in the rat ileum.Infect Immun64: 5225–5232.
Castagliuolo I, Riegler MF, Valenick L, LaMont JT & Pothoulakis C (1999)Saccharomyces boulardiiprotease inhibits the effects ofClostridium difficiletoxin A and B in human colonic mucosa.Infect Immun67: 302–307.
Charteris WP, Kelly PM, Morelli L & Collins JK (1998) Development and application of anin vitromethodology to determine the transit tolerance of potentially probiotic
LactobacillusandBifidobacteriumspecies in the upper human gastrointestinal tract.J Appl Microbiol84: 759–768.
Conway EJ & Downey M (1950) An outer metabolic region of the yeas cell.Biochem J47: 347–355.
Coury LA, McGeoch JEM, Guidotti G & Brodsky JL (1999) The yeastSaccharomyces cerevisiaedoes not sequester chloride but can express a functional mammalian chloride channel.FEMS Microbiol Lett179: 327–332.
Czerucka D & Rampal P (2002) Experimental effects of
Saccharomyces boulardiion diarrheal pathogens.Microb Infect
4: 733–739.
Czerucka D, Nano JL, Bernasconi P & Rampal P (1991) R´eponse aux toxines A et B deClostridium difficiled’une lign´ee de cellules ´epith´eliales intestinales de rat: IRD 98 Effect de
Saccharomyces boulardii.Gastroenterol Clin Biol15: 22–27.
Czerucka D, Piche T & Rampal P (2007) Review article: yeasts as probiotics –Saccharomyces boulardii.Aliment Pharm Therap
26: 767–778.
Dias RS, Bambirra EA, Silva ME & Nicoli JR (1995) Protective effect ofSaccharomyces boulardiiagainst the cholera in rats.
Braz J Med Biol Res28: 323–335.
Edwards-Ingram L, Gitsham P, Burton N, Warhurst G, Clarke I, Hoyle D, Oliver SG & Stateva L (2007) Genotypic and physiological characterization ofSaccharomyces boulardii, the probiotic strain ofSaccharomyces cerevisiae.Appl Environ Microb73: 2458–2467.
Eraso P & Gancedo P (1987) Activation of yeast plasma membrane ATPase by acid pH during growth.FEBS Lett224:
187–192.
Fernandes AR & S´a-Correia I (2001) The activity of plasma-membrane H1-ATPase is strongly stimulated during Saccharomyces cerevisiaeadaptation to growth under high copper stress, accompanying intracellular acidification.Yeast
18: 511–521.
Fietto JLR, Arau´jo RS, Valada˜o FN, Fietto LG, Branda˜o RL, Gomes FCO, Nicoli JR & Castro IM (2004) Molecular and physiological comparisons betweenSaccharomyces cerevisiae
andSaccharomyces boulardii.Can J Microb50: 615–621.
Gaber R (1992) Molecular genetics of yeast ion transport.Int Rev Cytol137: 299–353.
Garciadeblas B, Rubio F, Quintero FJ, Ba˜nuelos MA, Haro R & Rodr´ıguez-Navarro A (1993) Differential expression of two genes encoding isoforms of the ATPase involved in sodium efflux inSaccharomyces cerevisiae.Mol Gen Genet236:
363–368.
Gimmler H, Weis U, Weiss C, Kugel H & Treffny B (1989)
Dunaliella acidophila(kalina) Masyuk – an alga with a positive membrane potential.New Phytol113: 175–184.
Hofer M & Kunemund A (1984) Tetraphenylphosphonium ion is a true indicator of negative plasma-membrane potential in the yeastRhodotorula glutinis. Experiments under osmotic stress and at low pH values.Biochem J225: 815–819.
Imai T & Ohno T (1995) Measurement of yeast intracellular pH by image processing and the change in undergoes during growth phase.J Biotechnol38: 165–172.
Kinclova-Zimmermannova O, Gaskova D & Sychrova H (2006) The Na1, K1/H1-antiporter Nha1 influences the plasma
membrane potential ofSaccharomyces cerevisiae.FEMS Yeast Res6: 792–800.
Ko CH & Gaber RF (1991) TRK1 and TRK2 encode structurally related K1transporters inSaccharomyces cerevisiae.Mol Cell Biol11: 4266–4273.
Kohrer K & Domdey H (1991) Preparation of high molecular weight RNA.Meth Enzymol194: 398–405.
Krasznai Z, M´arian T, Balkay L, Emri M & Tr ´on L (1995) Flow cytometric determination of absolute membrane potential of cells.J Photoch Photobio B28: 93–99.
Krulwich TA & Guffanti AA (1983) Physiology of acidophilic and alkalophilic bacteria.Adv Microb Phys24: 173–214.
Kuroda T, Bihler H, Bashi E, Slayman CL & Rivetta A (2004) Chloride channel function in the yeast TRK-potassium transporters.J Membrane Biol198: 177–192.
Lowry OH, Rosebrough NJ, Farr AL & Randall RJ (1951) Protein measurement with the Folin phenol reagent.J Biol Chem193:
265–275.
Martins FS, Castro IM, Rosa CA, Nicoli JR & Neves MJ (2008) Effect of the trehalose levels on the screening of yeast as probiotic byin vivoandin vitroassays.Braz J Microbiol39:
50–55.
Mills DR (1941) Differential staining of living and dead yeast cells.Food Res6: 367–371.
Mitterdorfer G, Mayer HK, Kneifel W & Viernstein H (2002a) Clustering ofSaccharomyces boulardiistrains within the speciesSaccharomyces cerevisiaeusing molecular typing techniques.J Appl Microbiol93: 521–530.
Mitterdorfer G, Mayer HK, Kneifel W & Viernstein H (2002b) Protein fingerprinting ofSaccharomycesisolates with therapeutic relevance using one- and two-dimensional electrophoresis.Proteomics2: 1532–1538.
Morsomme P, Slayman CW & Goffeau A (2000) Mutagenic study of the structure, function and biogenesis of the yeast plasma membrane H1-ATPase.Biochim Biophys Acta1469: 133–157.
Nader-de-Macias ME, Romer NC, Apella MC, Gonzalez SN & Oliver G (1993) Prevention of infections produced by
Escherichia coliandListeria monocytogenesby feeding fermented milk with lactobacilli.J Food Protect56: 401–405.
Nass R & Rao R (1998) Novel localization of a Na1/H1exchanger
in a late endosomal compartment of yeast. Implications for vacuole biogenesis.J Biol Chem273: 21054–21060.
Navarre C & Goffeau G (2000) Membrane hyperpolarization and salt sensitivity induced by deletion ofPMP3, a highly conserved small protein of yeast plasma membrane.EMBO J
19: 2515–2524.
Ouwehand AC, Kirjavainen PV, Shortt C & Salminen S (1999) Probiotics: mechanisms and established effects.Int Dairy J9:
43–52.
Qamar A, Aboudola S, Warny M, Michetti P, Pothoulakis C, LaMont JT & Kelly CP (2001)Saccharomyces boulardii
stimulates intestinal immunoglobulin A immune response to
Clostridium difficiletoxin A in mice.Infect Immun69:
2762–2765.
Rodrigues AC, Cara DC, Fretez SHGG, Cunha FQ, Vieira EC, Nicoli JR & Vieira LQ (2000)Saccharomyces boulardii
Rodr´ıguez-Navarro A & Ramos R (1984) Dual system for potassium transport inSaccharomyces cerevisiae.J Bacteriol
159: 940–945.
Rottenberg H (1979) The measurement of membrane potential and pH in cells organelles and vesicles.Meth Enzymol55:
547–569.
Ruiz A, Gonz´alez A, Garcia-Salced R, Ramos J & Ari˜no J (2006) Role of protein phosphatases 2C on tolerance to lithium toxicity in the yeastSaccharomyces cerevisiae.Mol Microbiol62:
263–277.
Serrano R, Kielland-Brandt MC & Fink GR (1986) Yeast plasma membrane ATPase is essential for growth and has homology with (Na1
1K1), K1- and Ca21-ATPases.Nature319: 689–693.
Sychrova H, Ram´ırez J & Pe˜na A (1999) Involvement of Nha1 antiporter in regulation of intracellular pH inSaccharomyces cerevisiae.FEMS Microbiol Lett171: 167–172.
Toothaker RD & Elmer GW (1984) Prevention of clindamycin induced mortality in hamster bySaccharomyces boulardii.
Antimicrob Agents Ch26: 552–556.
van der Aa Kuhle A, Skovgaard K & Jespersen L (2005)In vivo
screening of probiotic properties ofSaccharomycesvar.
boulardiiand food-borneSaccharomyces cerevisiaestrains.Int J Food Microb101: 29–39.
Viegas AC & S´a-Correia I (1991) Activation of plasma membrane ATPase ofSaccharomyces cerevisiaeby octanoic acid.J Gen Microbiol137: 645–661.
Viegas AC & S´a-Correia I (1995) Toxicity of octanoic acid in
Saccharomyces cerevisiaeat temperatures between 8.5 and 301C.Enz Microb Technol17: 826–831.