A Work Project, presented as part of the requirements for the Award of a Masters Degree in Economics from the NOVA – School of Business and Economics.
Marine Protected Areas (MPAs): Methodologies
for assessment
Francisca Pereira dos Santos
Student Number: 21543
A Project carried out under the supervision of:
Antonieta Cunha e Sá
Marine Protected Areas (MPA): Methodologies for
assessment
ABSTRACT
Marine Protected Areas are an effective way of protecting biodiversity, with potential socio-economic benefits including the enhancement of local fisheries and maintenance of ecosystem services. However, local fishing communities often fear short-term revenue losses and thus may oppose marine protected areas creation. This work includes a review of the need of having management effectiveness evaluation and its importance in providing useful information for stakeholders. Therefore, evaluation methodologies are presented and assessed in order to suggest possible approaches to the Berlengas MPA. In this case, an indicator-based approach can be relevant as a starting point, providing already some insights about the management effectiveness of Berlengas MPA. It also supports the development of a more ambitious approach such as a bio-economic model.
1
1
Introduction
It is recognized that marine biodiversity plays a fundamental role in supporting a wide
range of ecosystem goods and services. Many marine areas accommodate key habitats for
the functioning of marine populations that in turn provide humans with productive
fisheries, recreation and other services.
The increase of human pressures on the marine environment with intensive and destructive
fishing has caused the depletion of stocks and has severely damaged habitats (Russ and
Alcala 1996; Guard and Masaiganah 1997; Edinger et al. 1998). That said, concern has
increased about the necessity of management plans for nature conservation that could
guarantee the provision of marine goods and services required for human well-being.
This work aims to provide an overview of Marine Protected Areas (MPAs) and the role of
economic analysis and modeling on the impact evaluation of such protected areas.
Moreover, it suggests possible methodologies to evaluate the impact of a particular MPA:
The Berlengas. The Berlengas are an archipelago located few kilometers from Cabo
Carvoeiro, in Peniche (Portugal), and it consists of a group of three rocket islets: the
Berlenga, the Estelas and the Farilhões and Forcadas.
The remainder of the report is organized as follows: the introduction of the MPA’s concept
including the evolution of its definition as well as its constraints and benefits. In this regard,
the need of having a proper management evaluation of a MPA is also discussed before
turning to an overview of economic analysis and modeling cases. Based on these cases
2
2 Marine Protected Areas
“A clearly defined geographical space, recognized, dedicated and managed, through legal
or other effective means, to achieve long term conservation of nature with associated
ecosystem services and cultural values” (Day et al. 2012).
Role of MPA
The creation of MPAs is recognized as one tool for managing large and diverse marine
ecosystems. The term MPA refers to protected areas in the ocean within which human
activities are limited, by regulation, in order to protect cultural, historical and/or
environmental values thus achieving certain conservation goals.
The definition of a MPA has progressed over recent years from specific protected areas
with strong regulations and focused on conservation targets, to protected areas where
human activities, such as fisheries and tourism, are allowed, under the assumption that there
will be no conflict with long term conservation targets (Kelleher 1999). It is this broader
concept of a MPA that accounts for the ecosystem development as a whole (Sala et al.
2002).
To have protected areas for study and observation is not new (e.g., Sala and Knowlton
2006; Craig 2007; Allison et al. 1998). What is new is the interest of environmental groups,
NGOs, and conservation biologists in significantly increase the amount of protected marine
habitat (Sanchirico and Wilen 2001). Since the 1960s, the conservation science and
principles for establishing and managing protected areas have developed significantly.
3
development, but the growth of protected areas’ knowledge has primarily resulted from the
work initiated by the International Union for the Conservation of Nature (IUCN) and the
original National Parks Commission (NPC) in the late 1950s. More recently, an agreement
was reached on an objective-based management category system (Table 1). Six categories
for MPAs are identified ranging from small village-level community-managed areas to
large, zoned national parks. These six categories provide a mechanism for assessing the
status of protected areas internationally. A number of countries have now formally adopted
the IUCN management categories as the basis for planning and managing their national
protected area systems.
Ia
Strict Nature Reserve managed mainly for science
The objective in these MPAs is preservation of the biodiversity and other values in a strictly protected area.
No-take areas are the specific type of MPA that achieves this outcome.
They have become an important tool for both marine biodiversity protection and fisheries management.
Ib
Wilderness Area managed mainly to protect wilderness qualities
Category Ib areas in the marine environment should be sites of relatively undisturbed seascape, significantly free of human disturbance, works or facilities and capable of remaining so through effective management.
II
National Park managed mainly for ecosystem protection and recreation
Category II areas present a particular challenge in the marine environment, as they are
managed for “ecosystem protection”, with provision for visitation, recreational activities and nature tourism.
III
Natural Monument managed mainly for conservation of specific natural features
Localized protection of features such as seamounts has an important conservation value, while other marine features may have cultural or recreational value to particular groups, including flooded historical/archaeological landscapes. Category III is likely to be a relatively uncommon designation in marine ecosystems.
IV
4 V
Protected Landscape/Seascape managed mainly for landscape/seascape conservation and recreation
Category V protected areas stress the importance of the “interaction of people and nature over time” and in a marine situation. Category V might most typically be expected to occur in coastal areas.
VI
Managed Resource Protected Area
Managed mainly for the sustainable use of natural ecosystems and resources
MPAs that maintain predominantly natural habitats but allow the sustainable collection of particular elements, such as particular food species or small amounts of coral or shells for the tourist trade, could be identified as category VI.
Table 1 - Application of categories in Marine Protected Areas (IUCN Duddley 2008)
The primary focus of a MPA is on the conservation of marine living organisms and their
habitats, as well as ecological systems, through the regulation of human extractive uses
such as fishery harvests, waste disposal, among others (Hoagland et al. 2001). To
accommodate the different uses inside a MPA and to support the development of the
ecosystem, regulations of human uses range from prohibition of human activities (No-take
area) to areas in which different type of human uses are permitted and controlled (Partially
Protected Area). This zoning tool allows the balance between protections of natural and/or
cultural qualities of the MPA with a spectrum of reasonable human uses.
Benefits and limitations of MPA
MPAs are of great interest both as a tool for (A) “integrated ocean management” and as (B)
fishery management tool (Charles 2001).
(A) On the one hand, biological benefits from MPAs as an “integrated ocean management”
tool include the protection of key species and habitats in a closed area (including threatened
species and habitats) and the increase in size of organisms and in the biomass density when
compared to unprotected areas nearby (Lester et al. 2009).These benefits are likely to be
5
be captured in intangible values such as the existence or heritage values associated with
particular unique marine ecosystems.
(B) On the other hand, a MPA has been recognized as beneficial for fishery management
(e.g., Hall and Mainprize 2004; Pitchford et al. 2007) such as restricting the fishing to
protect an ocean area where certain fish population spawns (Soufrière Regional
Development Foundation 1994). The protection of marine ecosystems does contribute to an
increase in the provision of ecosystem services (Fletcher et al. 2011). Ecosystem services
can be classified as: 1) provisioning services such as the fish abundance; 2) regulating
services such as the biological control and climate regulation; 3) supporting services such
as the habitats formation and water cycling; and 4) cultural services such as socially valued
seascapes. These ecosystem services provided by MPAs are shown to contribute to
social-economic welfare (Pomeroy et al. 2005), namely by increasing the benefits from fishing
and tourism enhanced by the benefits of increased biodiversity (Carter 2003).
Nevertheless, the impacts of combining human activities with conservation are still poorly
understood (Johnson et al. 2008)1. For example, cultural and socio-economic impacts of a
MPA creation are not yet clear, often imposing constraints on current and future users,
namely the loss of fishing revenues for current users. Benefits and costs are incurred at
different time periods (Sumaila and Charles 2002), possibly preventing that everybody
supports the creation of MPAs. Benefits and costs are not uniformly shared across the
population, as those that benefit do not typically coincide with those that lose. The question
1
6
is whether MPAs enhance nearby fisheries and produce economic returns with local
communities’ consensus (Badalamenti et al. 2000).
In this context, Toropova et al. (2010) and Agardy et al. (2011) identified additional
concerns with MPAs are such that some 1) are too small to achieve their goals, 2) are
inappropriately planned or managed, 3) fail due to degradation of the surrounding
unprotected area, 4) do more harm than good due to displacement and unintended
consequences of management, and finally 5) may create a dangerous illusion of protection
when in fact no protection is occurring. That said, once established, the MPA should be
effectively managed with enforcement of the regulations and consistent monitoring to keep
track of the objectives proposed. Evaluation information is useful for local communities,
funding bodies, policy makers and others directly involved in management of a protected
area. In fact, this information can be used by local communities to see how their interests
are being accounted for, as well as by policy makers to improve resource allocation.
3 Management effectiveness of MPAs
“The assessment of how well the protected area is being managed – primarily the extent to
which it is protecting values and achieving goals and opportunities. The term management
effectiveness reflects three main themes: 1) design issues relating to both individual sites
and protected area systems; 2) adequacy and appropriateness of management systems and
processes; and 3) delivery of protected area objectives including conservation of values”
7
The total number of protected areas is increasing (Ballantine 1994) and so is the need to
evaluate their management, namely having proper accountability, good business practices
and transparency in reporting. Nevertheless, the increasing number of MPAs has not been
consistently accompanied by policies of management and enforcement (Hockings et al.
2006). In the case of the Mediterranean MPAs, some were reported to be inadequately
managed and, therefore, not meeting the proposed goals. In fact, Abdulla et al. (2008)
reported that approximately half of Mediterranean MPAs studied were in that category. The
Pelagos Sanctuary for marine mammals in the Mediterranean Sea is an example where
MPAs’ management lacks resources and authority. This MPA has failed to establish a
coherent set of MPA management measures, such as particular regulations to reduce the
impacts on local mammals’ populations by human activities, and therefore failed to achieve
its conservation goals (Notarbartolo di Sciara 2009). Creating a zoning scheme to optimize
mammals’ conservation, channelling the area’s intense maritime traffic along established
corridors, ensuring that no high‐intensity noise is produced, ensuring the orderly and
respectful development of the whale-watching industry are a few management measures
that could be considered to evaluate the impact of an MPA creation and therefore to keep
track of its goals (Notarbartolo di Sciara et al. 2008). Effectiveness management evaluation
of protected areas means gathering available information, measuring it and communicating
8
Attempts to address poor management effectiveness have been developed by dedicated
ecological regional collaborative projects and initiatives. These focus on the development
of management tools and practices, monitoring and assessment, stakeholders’ involvement
and managers’ networks. For European waters, EMPAFISH2 is an example of these
initiatives and projects. Worldwide the IUCN’s World Commission on Protected Areas has
created the Management Effectiveness Task Force Framework for that purpose. This
Framework presents an interactive protected area management cycle of design, adequacy
and delivery (Figure 1). Following the Framework, MPAs’ managers customize a set of
appropriate methodologies including economic models to determine which are most
appropriated to deliver the proposed goals. This Framework works as a common language
helping to explain variations in the
context, available resources,
evaluative purpose and specific
management objectives across
protected areas. Also, it is not imposed
as a standardized methodology in all
countries (Hockings et al. 2000). For
example, some African countries have
tailored the range of methodologies
available for their needs and have
produced slightly different models
2
9
(Dudley et al. 2005). This includes different economic models, measures and data system
collection to access the delivery of the proposed goals.
4 Overview of economic analysis and modeling cases
From the discussion above, evaluating the impacts of a MPA depends on the goals
established for the MPA, the main stresses experienced by the ecosystem and the
institutions in place. Proper methodologies are needed to address the balance between the
various goals involved within a MPA creation, namely between costs and benefits, and to
understand and analyse the human decision-making dynamics. This section provides a
literature review on economic analyses in the last 20 years including bio-economic models.
The section is focused on the delivery phase of IUCN’s Framework and the measures
needed to be studied in order to deliver the proposed goals.
Habitats’ loss is the leading cause of declining biodiversity (Wilcove and Wilson 2000) and
therefore a threat to accomplish MPA’s goals. Since MPAs were originally created for
ecosystem protection, the biological element has to be included.
As discussed before, MPAs can protect and restore habitats that are critical for living
marine resources as habitats offer shelter breeding aggregations, provide nursery habitat
and supply food for adults. Habitats’ degradation represents a biomass and biodiversity
reduction, therefore, contributing to declining fish stocks (Rosenberg et al. 2000) and thus a
threat to conservation goals’ accomplishments. Major threats to habitats’ degradation
include agricultural practices, water projects and urbanization. Over-harvesting impacts
10
mud-bottom communities by fishing trawls, dredges, or anchors, and loss of seagrass
habitat from boating activities.
Mitigating habitat loss will require water quality management and consistent monitoring of
population dynamic measures such as fish biomass3 and fish density4. In addition to
studying biological elements, there is also the need to control for extractive and non
extractive activities that cause long-term declines in habitat quality and ecosystem health
(National Research Council 2001).
Theoretically-oriented analyses of both biological elements and extractive and non
extractive activities include the classical bio-economic models, sometimes static but most
often dynamic in nature (e.g., Pollacheck 1990; Holland and Braze 1996; Sanchirico and
Wilen 2001, Sanchirico 2005; Sala et al. 2013). Typically, these bio-economic models
typically maximize the present value of the stream of profits over time subject to the
population dynamics. These studies often provide simulation analysis using representative
parameter values and suitable sensitivity analysis. Applied research differs as it is oriented
toward analyzing specific case studies focusing on particular MPA cases (e.g., Halpern
2002).
Initially, theoretically-oriented analyses showed that MPAs have effects on the spawning
biomass by increasing it within the protected area, and in some conditions increasing the
fishing’s catch (e.g., Pollacheck 1990; Holland and Braze 1996). Applied research
confirmed these findings, emphasizing the increase in spawning biomass within protected
3
Fish biomass is the wet weight of fish in an area
4
11
areas (Halpern 2002). However, more recently, theoretically-oriented analyses have shown
that those biological benefits can provide a net increase on fishing not only inside but also
outside the protected area. Moreover, they also show that this increase needs to be large
enough to offset the losses associated with the closure of an area (e.g., Merino et al. 2009;
Sala et al. 2013).
Holland and Brazee (1996) use a simulation model of an age-structured two-patch
population model. They confirmed Polacheck’s results that spawning stock biomass will
always increase with MPAs creation. In their model they compare density/dependent
stock/recruitment relationship within protected area and nearby unprotected area. They also
include migration adults according to a density-dependent mechanism, and (uniform) larval
dispersal. Holland and Brazee’s model is a fully dynamic model so that it computes the
present values of transition paths. They also find that whether the stock biomass increase
creates conditions to generate a net increase in the present value of economic benefits,
depends significantly on the discount rate and the pre-MPA exploitation level, as well as
bio-economic parameters. In this model, effort5 is fixed both before and after MPA
formation.
This analysis does not account for the fact that economic conditions will, in part, determine
pre-MPA fishing effort and that the MPA will change profitability and hence subsequent
effort decisions by fishermen (Smith and Wilen 2002).
5
12
Sanchirico and Wilen (2001) and Sanchirico (2005), developed a model describing a
discrete number of subpopulations distributed in patches, but interconnected by biological
and economic relations (Alban et al. 2006). In this model they improved Holland and
Brazee’s model (1996) by taking fishing efforts into account. They find that, under open
access, most MPA scenarios produce a biological benefit but that there are very few
combinations of biological and economic parameters that give rise to both a harvest
increase and a biological benefit. In particular, they find that harvest increases are likely
only when the designated MPA patch has been severely overexploited in the pre-MPA
setting (Smith and Wilen 2002).
In contrast, Halpern (2002) analyzed 76 MPAs’ experiences in different locations,
conditions and enforcement levels. Initial experiences on biological MPAs’ effects (Russ
and Alcala 1994; Walls 1998and Castilla and Durán 1985) indicated that two of the most
impressive effects were the rapid buildup in biomass of previously exploited species and
increase in species density. The author studied two measures to assess MPAs’ effect. For
each MPA, he studied the changes in density of key species within the protected area and
compared them with nearby unprotected areas. For the case of Leigh Marine, in New
Zealand, when compared to the density of comparable populations in neighboring areas
open to fishing, the Lobster population was found to increase eight densities’ values in the
15 years in which the area was protected (MacDiarmid and Breen 1992).
In addition to abundance increase, he also studied the average size of individuals of key
13
the average body weight of a specific species increased three-fold in the protected area
when compared to nearby fished waters (Roberts and Polunin 1993b).
One of the most recent bio-economic models is designed by Sala et al. (2013). The authors
designed a bio-economic model to determine the time period for which the species recovery
and economic development of tourism surpass the short term loss in fishing.
By developing a biological model, where the population biomass dynamics of key species
is designed and parameterized, the authors examine the effects of several species with
different characteristics. They track the species biomass in each patch in each year and
account for the growth of average individuals. Sala et al (2013) also include larval
dispersal, recruitment and adult movement in their biological model in a Gaussian fashion.
The bio-economic fishing model is based on profits from harvest, accounting for both
before and after the MPA creation.
For tourism revenues, these authors define it as revenues obtained from of the price per
dive/visit times the additional number of dives/visits due to the MPA. The marginal value
of additional number of dives/visits depends on the number of dives/visits in the MPA and
the biomass changes as well as on location specific parameters affecting these two
variables. They find an optimal fee per dive depending on the number of dives that
maximize tourism revenues.
Finally, Sala et al (2013) simulate the bio-economic model for the Medes Islands in Spain.
This simulation study suggests that even for fisheries alone, the MPA creation will
14
creation, and tourism revenue exceeds the fishing revenues. The total value of the MPA
becomes greater than the pre-MPA value within five years. Such analysis quantifies both
the extractive and non-extractive benefits of the MPA and assesses if such activities
conflict with other goals of protection.
The availability of biological data (e.g. fish density), fisheries data (e.g. catch per boat) and
socio-economic data (e.g. additional number of dives/visits) are crucial to evaluate MPAs
creation impacts. As discussed before, these data can be collected at different time periods
to look for changes over time, for example, at set intervals subsequent to MPA creation
(Mangi and Austen 2008). Data collection may include underwater visual census,
experimental fishing and local questionnaires.
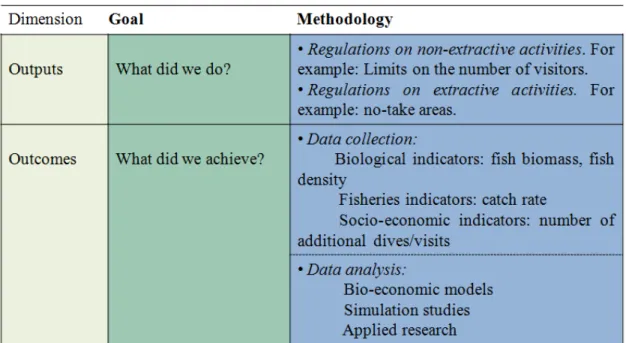
Figure 2 – Summary of possible methodologies and data in evaluating MPAs creation impact. It describes the delivery phase
15
5 The Berlengas MPA
By following IUCN’s Framework delivery phase and previously presented literature review
and findings synthesis of MPAs’ evaluation, this work aims to draw a methodology to
assess the effectiveness of Berlengas MPA creation (in 1998) and its delivery of both
biological and recreational goals. In particular, the work focuses on biological measures
(such as biomass density and diversity of organisms) as well as on fishing and
socio-economic measures (such as the number of catches and the price per species, as well as the
number of dives and the price per dive).
The Berlengas MPA is a type VI from IUCN’s categories (Table 1): “Areas that conserve
ecosystems and habitats, together with associated cultural values and traditional natural
resource management systems”(Day et al. 2012). The Berlengas MPA is not strictly
established for conservation goals of species and habitats. It also allows for economic
activities such as fishing, recreational and diving under specific regulations with respect to
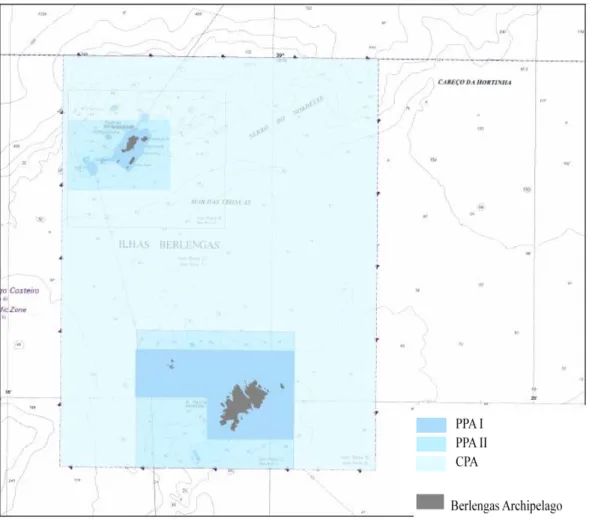
biodiversity conservation (Law Decree 30/98). It includes two Partially Protected Areas
(PPA I and PPA II) as well as a Complementary Protected Area (CPA). Both PPA I and
PPA II are buffer zones where recreational and commercial fishing as well as tourism
activities are allowed under specific regulation (Figure 3). Specific regulation includes a
number of limited tourists by site and number of boats allowed for fishing. The CPA is
open to fishing but not necessarily as an open-access fishery as legislation does not allow
for commercial fishing by vessels not registered in Peniche Port Authority, trawl fishing,
16
Currently this MPA follows a Management Plan established in 2008. This Management
Plan for the marine territory aims to support the decision-making on the use of the territory
(Council of Ministers Resolution nº180/2008). It includes analyses, diagnostics/synthesis
and the management proposal. The proposal is mainly constituted by a zoning map and a
regulation associated with it. The first two phases, Design/Planning and
Adequacy/Appropriateness, of the IUCN’s Framework are very well described in this
Management Plan as it is very detailed on the context, inputs and processes of management.
Since the creation of this MPA in 1998, nothing or very little has been studied in order to
assess the impacts of this MPA creation and the effectiveness of the management plan
17
proposed. Some of recent work has attempted to understand and quantify the biological
impact of Berlengas MPA (e.g., Almeida 1996; Vasco-Rodrigues et al. 2011). However, no
marine scientific studies were done prior to its creation (Vasco-Rodrigues et al. 2011) thus
limiting the analyses of evaluation effectiveness before and after the MPA creation.
Nevertheless, the absence of scientific data is not an excuse to delay or not do the
assessment of MPAs impacts, thus compromising the delivery of MPA’s goals.
Bio-economic model: a possible approach
The impacts of MPA creation can be measured by relating the spillover benefits from inside
the MPA to the unprotected areas nearby (spatial approach) instead of the before and after
the MPA creation analysis. A starting point for this work’s methodology is to adopt an
already existing model and adapt it for the Berlengas MPA. As discussed before, the
bio-economic model simulation from Sala et al. (2013) is a recent example where the biological
effects from the Medes Islands MPA are related to the possible fishing and tourism
activities inside and/or outside the protected area. It represents a possible methodology for
the case of Berlengas MPA as both case studies are located near the shore and support
similar economic activities. After developing the bio-economic model, the next step would
be to select the appropriate measures. Defining the measures includes defining what data to
collect and how to collect them.
For the case of the Berlengas MPA, this work includes the biological, fishing and
socio-economic measures which are studied based on data collection of representative species and
18
Representative species include those that 1) have higher conservation value, 2) have higher
fishing commercial value and 3) species that attract divers. As representative of endangered
species important for conservation, one could use 1) the Dusky Grouper (Epinephelus
marginatus). To represent the species important to fishery, 2) the European pilchard
(Sardina pilchardus), the Atlantic horse mackerel (Trachurus trachurus) or the Common
octopus (Octopusvulgaris) could be used. To represent species that divers are interested in,
3) the Perciform fishes family (Moronidae) including the European seabass species
(Dicentrarchus labrax) could be used. Data collection includes visual census techniques
(Vasco-Rodrigues et al. 2011) and experimental fishing surveys (Stobart et al. 2009). Once
the data is defined and collected, the indicators’ calculation should be the next step,
including the population dynamics (biomass density, growth of average individuals, fish
moving from one area to the other), the fishery catch and fishery profit.
Representative activities include the identification of the most successful non-extractive
and touristic activities allowed in the Berlengas MPA: diving, bird watching and
recreational boating. Data collection on such activities should be obtained, in particular the
annual number of tourists for each activity and the unit price of the activity. Having the
data defined and collected, the tourism revenue estimate should be next step.
Based on the Sala et al. (2013) bio-economic model and its application to the Berlengas
MPA, it would be possible to discuss the biological dynamics and how they affect fishery
profits and tourism value. It is also possible to simulate when the benefits surpass the losses
19
Indicator-based methodology: an alternative approach
An indicator-based methodology is a different approach for the case of management
effectiveness evaluation. This methodology accounts solely for the evaluation of a different
number of possible indicators designed according to MPAs’ goals and objectives. It does
not involve any bio-economic model and therefore does not relate biological effects with
possible socio-economic benefits. Nonetheless, this methodology is not only useful,
balanced, flexible and holistic but also a lot less ambitious than a bio-economic model.
Some countries have adopted this indicator-based methodology following the 2004 IUCN
Guidebook as it is the case of the United Kingdom (Gubbay 2005). This Guidebook
presents different clusters of indicators and each country adapts them according to its
needs.
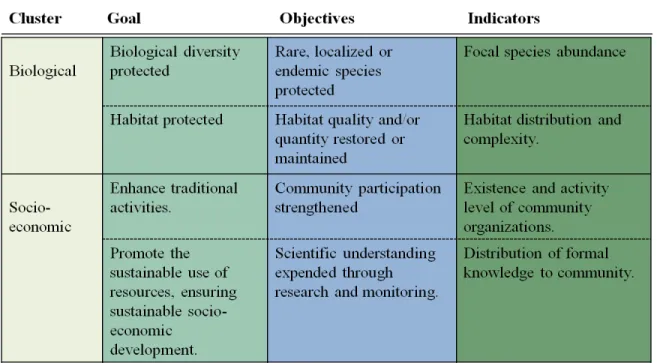
For the case of Berlengas and according to the Management Plan developed (Council of
Ministers Resolution nº180/2008), MPA goals and objectives include the ones described in
figure 4. Also, figure 4 includes examples of biological and socio-economic indicators used
for evaluation. For example, the focal species abundance indicator includes counting the
number of certain individual species during a limited period of time. Hence, one could
monitor the evolution of each species and, if that is relevant, how that evolution affects
20
This indicator-based analysis is useful if one collects data over different periods of time.
Therefore, it is possible to compare data and get useful information on the evolution of each
indicator. Nevertheless, when compared to bio-economic models with simulation analysis,
indicator-based analysis is more limited. It does not balance biological effects with human
activities such as fishery management and tourism.
6 Conclusion
As discussed before, there are MPAs’ impact evaluations with different focuses. On the one
hand, the focus may be on comparative evaluation analysis over time inside the MPA
which relies on quantitative results such as the evolution of species or additional number of
visits. This analysis can be performed before and after the MPA creation, to assess its
impact, or performed during the life of the MPA to assess its maintenance. For the case of
21
Berlengas MPA, a before and after analysis is not possible due to the unavailability of
historical data. However, it is possible to develop an indicator-based methodology that
allows the evaluation of goals achievement from the moment it is implemented.
On the other hand, spatial analysis may also be conducted to evaluate the so called spillover
effects balance between the protected area and unprotected areas nearby accounting for
biological and socio-economic impacts. This type of analysis for the Berlengas case should
rely on a bio-economic model such as the one presented by Sala et al. (2013) for the case of
Medes Islands in Spain.
Both approaches are possible and could complement each other due to their different
focuses. An indicator-based methodology is a starting point for the management
effectiveness evaluation of the Berlengas MPA. This approach requires comprehensive data
collection and thus it is important to start as soon as possible. Moreover, the possible
application of this approach will allow for the creation of a database that can be further
used in a more ambitious approach such as a bio-economic model.
The importance of having methodologies to assess MPAs’ impacts it will be crucial to
evaluate the possibility of creating new ones. In September 2014, Portugal’s Government
has designed a plan that is called “Commitment to Green Growth” which aims to “Promote
in Portugal a green economic growth with national impact and international visibility by
stimulating green economic activities, promoting the efficient use of resources and
22
there is the objective of establishing new MPAs in order to classify approximately 10% of
the Portuguese sea as a protected area by 2020.
References
Abdulla A., M. Gomei, E. Maison, C. Piante 2008. Status of Marine Protected Areas in the Mediterranean Sea. IUCN, Malaga and WWF, France, 152 pp.
Agardy T., G. Notarbartolo di Sciara, P. Christie 2011. Mind the gap: addressing the shortcomings of marine protected areas through large scale marine spatial planning. Marine Policy 35: 226–232
Alban F., G. Appéré G. and J. Boncoeur 2006. Economic Analysis of Marine Protected Areas. A Literature Review. EMPAFISH Project, Booklet nº 3. 51 pp.
Allison G.W., J. Lubchenco, and M.H. Carr. 1998, Marine reserves are necessary but not sufficient for marine conservation. Ecological Applications 8:S79-S92
Almeida A. 1996. Structure and spatial variability of the rocky fish fauna in the protected marine «Reserva Natural de Berlenga» (Portugal). Arquivos do Museu Bocage, Nova Série II, 25: 633-642.
Badalamenti F., A.A. Ramos, E. Voultsiadou, J.L. Sanchez Lizaso, G. D’anna, C. Pipitone, et al. 2000. Cultural and socio-economic impacts of Mediterranean marine protected areas. Environmental Conservation, 27, 110-125.
Ballantine W.J. 1994, The Practicality and Benefits of a Marine Reserve Network, in Limiting Access to Marine Fisheries: Keeping the Focus on Conservation (K.L. Gimbel, ed.), Center for Marine Conservation and World Wildlife Fund, Washington, D.C., 205-223.
Carter D.W. 2003. Protected areas in marine resource management: Another look at the economics and research issues. Ocean and Coastal Management, 46, 439-456.
Castilla J.C., and L.R. Durán. 1985. Human exclusion from the rock interdital zone of central Chile: the effects on Concholepas concholepas (Gastropoda). Oikos 45:391-399.
Charles A.T. 2001, Sustainable Fishery Systems, Blackwell Science, Oxford, UK.
Craig R. 2007. Valuing Coastal and Ocean Ecosystem Services: The Paradox of Scarcity for Marine Resources Commodities and the Potential Role of Lifestyle Value Competition. Journal of Land Use and Environmental Law 22.
Day J., N. Dudley, M. Hockings, G. Holmes, D. Laffoley, S. Stolton and S. Wells, 2012. Guidelines for applying the IUCN Protected Area Management Categories to Marine Protected Areas. Gland, Switzerland: IUCN. 36pp.
23
Dudley N., L. Higgins-Zogib and S. Mansourian, 2005. Beyond Belief, Linking faiths and protected areas to support biodiversity conservation. A research report by WWF, Equilibrium and The Alliance of Religions and Conservation (ARC).
Edinger E.N., J. Jompa, G.V. Limmon, W. Widjatmoko and M.J. Risk 1998. Reef degradation and coral biodiversity in Indonesia: Effects of land-based pollution, destructive fishing practices and changes over time. Marine Pollution Bulletin 36, 617- 630.
Fletcher S., J. Saunders and R.J.H. Herbert, 2011. A review of the ecosystem services provided by broad-scale marine habitats in England’s MPA network. Journal of Coastal Research, SI 64
Guard M. and M. Masaiganah 1997. Dynamite fishing in southern Tanzania, geographical variation, intensity of use and possible solutions. Marine Pollution Bulletin 34, 758-762.
Gubbay, S., 2005. Evaluation the management effectiveness of marine protected areas: Using UK sites and the UK MPA programme to illustrate different approaches, A report for WWF-UK.
Hall S., B. Mainprize 2004. Towards ecosystem-based fisheries management. Fish and Fisheries 5: 1-20.
Halpern B. 2002. The impact of marine reserves: Do reserves work and does reserve size matter? Ecological applications, 13(1) Supplement, pp. S117-S137
Hoagland P., U.R. Sumaila and S. Farrow 2001, Marine Protected Areas, in Encyclopedia of Ocean and Sciences (J.H. Steele, S.A. Thorpe and K.K. Turekian, eds.) Academic Press, London, 1654-1659.
Hockings M., S. Stolton, N. Dudley, F. Leverington, J. Courrau 2006. Evaluating effectiveness: a framework for assessing the management of protected areas. Second edition (IUCN Gland, Switzerland and Cambridge, UK).
Hockings, M., S. Stolton and N. Duddley, 2000. Evaluating Effectiveness: A framework for assessing management of protected areas. Best Practice Protected Area Guidelines Serie No.6, IUCN, Gland, Switzerland in association with Cardiff University, UK.
Holland D.S. and R.J. Brazee 1996, Marine Reserves for Fisheries Management, Marine Resource Econ. 11, 157-171.
Johnson M.P., T.P. Crowe, R. McAllen, A.L. Allcock 2008. Characterising the Marine Natura 2000 Network for the Atlantic Region. Aquatic Conservation and Marine and Freshwater Ecosystems 18: 86-97.
Kelleher G. 1999. Guidelines for Marine Protected Areas. IUCN. Gland, Switzerland.
Lester S.E., B.S. Halpern, K. Grorud-Colvert, J. Lubchenco, B.I. Ruttenberg, et al. 2009. Biological effects within no-take marine reserves: a global synthesis. Marine Ecology Progress Series 384: 33-46.
24
Mangi S. and M. Austen 2008. Guidelines for the Assessment of Marine Protected Areas as tools for fisheries Management and Conservation. EMPAFISH Project nº31. 11 pp.
Martin D. Smith and James E. Wilen, 2002. The Marine Environment: Fencing the Last Frontier, Review of Agricultural Economics, Agricultural and Applied Economics Association, vol. 24(1), pages 31-42.
Merino G., F. Maynou, J. Boncoeur 2009. Bioeconomic model for a three-zone Marine Protected Area: a case study of Medes Islands (northwest Mediterranean). ICES Journal of Marine Science: Journal du Conseil 66: 147-154.
National Research Council 2001, Marine Protected Areas: Tools for Sustaining Ocean Ecosystems, National Academy Press, Washington, D.C.
Notarbartolo di Scaria G. 2009. The Pelagos Sanctuary for the conservation of Mediterranean marine mammals: Iconic High Seas MPA in dire straits. 2nd International Conference on Progress in Marine Conservation in Europe 2009, 2-6 November 2009. OZEANEUM/DMM Straslund, Germany.
Notarbartolo di Scaria G., T. Agardy, D. Hyrenbach, T. Scovazzi, P. Van Klaveren 2008. The Pelagos Sanctuary for Mediterranean marine mammals. Aquatic Conservation: Marine and Freshwater Ecosystems 18: 367-391.
Pitchford J.W., E.A. Coding, D. Psarra 2007. Uncertainty and sustainability in fisheries and the benefit of marine protected areas. Ecological modeling 207:286-292.
Polacheck T. 1990, Year Round Closed Areas as a Management Tool, Natural Res. Modelling 4, 327-354.
Pomeroy R.S., L.M. Watson, J.E. Parks, G.A. Cid 2005. How is your MPA doing? A methodology for evaluating the management effectiveness of marine protected areas. Ocean & Coastal Management 48: 485-502
Queiroga H., F. Leão and M. Coutinho 2009. Nomination of the Berlengas Islands as a UNESCO Biosphere Reserve. Câmara Municipal de Peniche, Portugal.
Roberts, C.M., and N.V.C. Polunin. 1993b. Effects of marine reserve protection on northern Red Sea fish populations. Proceedings of the 7th International Coral Reef Symposium, Guam 2:969-977.
Rosenberg, A., T.E. Bigford, S. Leathery, R.L. Hill, and K. Bickers. 2000. Ecosystem approaches to fishery management through essential fish habitat. Bulletin of Marine Science 66(3):535-542.
Russ G.R. and A.C. Alcala 1996. Do marine reserves export adult fish biomass? Evidence from Apo Island, central Philippines. Marine Ecology Progress Series 132, 1-9.
Russ, G.R., and A.C. Alcala. 1994. Sumilon Island reserve: 20 years of hopes and frustrations. Naga, the ICLARM Quarterly 7:8-12.
25
Sala E., N. Knowlton 2006. Global marine biodiversity trends. Annual Review of Environment and Resources 31: 93–122.
Sala E., O. Aburto-Oropeza, G. Paredes, I. Parra, J. C. Barrera and P. K. Dayton 2002. A General Model for Designing Networks of Marine Reserves. Science 298, 1991–1993.
Sanchirico J.N. 2005. Additivity properties in metapopulation models:implications for the assessment of marine reserves. Journal of Environmental Economics and Management 49: 1–25
Sanchririco J.N., J.E. Wilen, 2001. A bioeconomic model of marine reserve creation. Journal of Environmental Economics and Management, 42: 257-276.
Saterson K.A., N.L. Christensen, R.B. Jackson, R.A. Kramer, S.L. Pimm, M.D. Smith, and J.B. Wiener 2004. Disconnects in evaluating the relative effectiveness of conservation strategies. Conservation Biology, 18, 597–599.
Soufrière Regional Development Foundation 1994, Soufrière Marine Management Area: Agreement on the Use and Management of Marine and Coastal Resources in the Soufreère Region, St. Lucia, Soufrière Regional Development Foundation, Soufrière, St. Lucia.
Stobart B., R. Warwick, C. Gonzalez, S. Mallol, D. Diaz, O. Reñones, 2009. Longterm and spillover effects of a marine protected area on an exploited fish community. Mar. Ecol. Prog. Ser. 384, 47-60.
Sumaila U.R., and A.T. Charles 2002. Economic models of marine protected areas: an introduction. Natural Resource Modeling, 15, 261-271.
Toropova C., I. Meliane, D. Laffoley, E. Matthews, M. Spalding (eds.) 2010. Global Ocean Protection: Present Status and Future Possibilities. IUCN, Gland Switerland. WCS. 96pp.
Vasco-Rodrigues N., S. Mendes, J Franco, M. Castanheira, N. Castro and P. Maranhão 2011. Fish Diversity in the Berlengas Natural Reserve (Portugal), a marine protected area.
Walls, K. 1998. Leigh Marine Reserve, New Zealand. Parks 8:5-10.