Abstract— The purpose of this work is to explore an algorithm based on Technique for Order Preference by Similarity to Ideal Solution (TOPSIS) for non-homogeneous alternatives in group decision making. In this particular case of evaluating a set of decision alternatives, an individual expert expresses hedonic judgments for a subset of decision alternatives depending on his/her knowledge about the alternatives. The structure of the decision making problem generates a local matrix of judgmental responses for each decision alternative. Signal-to-Noise Ratio (SNR) determines the ratio of relevant information to irrelevant information in the local response matrices. The SNR vectors of all decision alternatives are aggregated into a global decision matrix and passed as argument to the TOPSIS algorithm to rank the alternatives. The attractiveness of this algorithm is that we do not have to modify the existing TOPSIS. The algorithm was used to rank 10 different sports that were evaluated by 34 respondents in a survey and the result is practically appealing. This type of non-homogeneous group decision making is particularly useful in selecting an optimal decision alternative among a large set of alternatives where opinions of a large group of stakeholders count. This is for instance in opinion polls, comparison of market products/services and Delphi process where an expert does not necessarily have to possess full knowledge about all decision alternatives or be jack of all trades.
Index Terms— group decision, non-homogeneity, TOPSIS
I. INTRODUCTION
ecision making process remains an interesting area of study to many researchers because human beings are constantly making decisions in their daily activities. The top managers and executive officers of corporate organizations are examples of decision makers who are often confronted with several alternatives to make an optimal selection. As a result, decision makers need tools to help in decision making processes because making the wrong decision can lead to disastrous consequences. The use of Multiple Criteria Decision Making (MCDM) methods for selecting decision alternatives is prominent among decision makers. These methods provide a systematic way to help decision makers in selecting the most desirable and satisfactory alternative in uncertain situations [1]. MCDM methods were
Manuscript received July 17, 2012; revised August 10, 2012.
Oludayo O. Olugbara is a Professor with the Department of Information Technology, Durban University of Technology, Durban, 4001, South Africa. (+27313735591; +27866741023; [email protected] boulder.nist.gov).
Thiruthlall, Nepal is a Professor with Department of Information Technology, Durban University of Technology, Durban, 4001, South Africa. He is the Executive Dean of Faculty of Accounting and Informatics
developed in the lines of Multiple Attributes Utility Theory (MAUT) to improve quality of decisions by making choices more explicit, reasonable and effective [2]. MAUT is based on the hypothesis that in any decision problem, there is a real valued function defined on a set of criteria that a decision maker wishes to maximize [3]. The important components of a MCDM method are decision alternatives, decision criteria, criteria weights and measures of performance of alternatives with respect to criteria.
The principle that we follow is that of assigning different groups to work on the same problem so as to significantly minimize the effects of groupthink [4]. As a result, a decision alternative is evaluated by a group of experts having knowledge of the alternative. This decision task is therefore referred to as a variant of non-homogeneous group decision making because the sources of ratings stream for individual decision alternatives are not necessarily the same. The remainder of this paper is for the sake of lucidity, succinctly summarized as follows. In Section II we discuss a formulation of a non-homogeneous group decision problem. In Section III we briefly review related work. In Section IV we describe the proposed solution methodology. In section V we present empirical experiment to show the effectiveness of the proposed solution to the decision problem. In Section VI we give a brief conclusion and delineate our future work.
II. PROBLEM DESCRIPTION
The efficiency scores in non-homogeneous group decision making units can reflect the underlying differences in environments. The two strategies suggested to overcome this problem are to separate decision making units into several homogeneous groups and to adjust for homogeneity [5]. There are various formulations of non-homogeneous group decision making problems having elements of non-homogeneity in terms of input preferences. One formulation considered the case of missing feature preferences in input and output vectors for selection of vendors. The missing features were estimated using interval arithmetic in a data envelopment analysis process [6]. Another formulation considered choice processes for non-homogeneous group decision making in linguistic settings wherein experts provide preferences as fuzzy relations [7]. The formulation [8] enables individual experts to express preferences using different approaches such as numeric, linguistic and interval values. The TOPSIS method was extended to a non-homogeneous setting in which different experts evaluate each decision alternative relative to a set of decision criteria. The opinions of the experts are aggregated
Exploring TOPSIS Based Algorithm for
Non-Homogeneous Alternatives in Group Decision
Making
Oludayo, O. Olugbara and Thiruthlall, Nepal
through separation measures by taking the geometric or arithmetic mean of the individuals [9].
However, scalability of these methods to a large group of stakeholders is an important issue. Moreover, the methods should also allow for the knowledge of individual experts to be fully utilized for decision making. In order to achieve these, an individual expert is allowed to express preferences for a set of decision alternatives relative to decision criteria. This formulation resulted into a 3-dimensional matrix structure that can be formally expressed as follows.
k IJ k
Ij k
I k I
k iJ k
ij k
i k i
k J k
j k
k
k J k
j k
k
I i k
J j
r
r
r
r
r
r
r
r
r
r
r
r
r
r
r
r
R
R
R
R
D
X
X
X
X
2 1
2 1
2 2
22 21
1 1
12 11
2 1
2 1
(1)
Where
R
i represents theith
response (i
1
,
2
,...,
I
) andX
j represents thejth
criterion (j
1
,
2
,...,
J
). The elementr
ijk
D
k with quantitative and qualitative data is theith
response of thekth
decision alternative(
k
1
,
2
,...,
K
) relative to criterionX
j. It is noted thatthere should be K response matrices for the K decision alternatives with each having
r
k number of responses such thatI
r
k . Eachkth
local response matrixL
k obtained from the 3-dimension matrix is of dimensionj
r
k
and is represented as follows.
J R j
r r
r
iJ ij
i i
J j
J j
r i k
J j
k k
k
k
r
r
r
r
r
r
r
r
r
r
r
r
r
r
r
r
R
R
R
R
L
X
X
X
X
2 1
2 1
2 2
22 21
1 1
12 11
2 1
2 1
(2)
III. RELATED WORK
There are several MCDM methods well developed for evaluating a set of decision alternatives in a homogeneous setting in terms of the nature of the operations perform, measures of efficiency and conditions under which they operate [5]. Examples are Analytic Hierarchical Process (AHP) [10], [11], Data Envelopment Analysis (DEA) [12-14], Alternative Cross-Evaluation (AXE) [15], [16], Area of the Efficiency Score graph (AES) [17], TOPSIS [1], [18], VIKOR [19] and Relative Ratio (RR) [20]. MCDM methods for data processing can be categorized into non-compensatory and non-compensatory [21]. The exchange of criteria is not allowed in non-compensatory methods. In the
model of compensatory, the selection of the optimal decision alternative is by considering the distance of the desired alternatives from the ideal solution. The compromise methods such as TOPSIS, VIKOR and RR belong to the compensatory model. TOPSIS is famous and has been successfully applied to many applications [2], [18], [22-24]. Given a decision matrix and a decision making procedure, TOPSIS finds an optimal decision alternative that is at closest distance to the Positive Ideal Solution (PIS) and at farthest distance to the Negative Ideal Solution (NIS). A PIS is the optimal solution sought and NIS is the worst solution that is not of interest.
In order to take advantage of group dynamics in decision making, researchers are developing MCDM methods to support group decision making [5], [7-9], [25], [26]. Group dynamics is used in organizations of today to make decisions by involving groups, teams and committees to reason on issues and arrive at optimal decisions that can be implemented [27], [28]. Research results have shown that group decision making processes have advantages when compared to individual, majority votes and leader decision [29-31]. The benefits of group decision making include availability of knowledge and expertise for problem solving, a greater number of alternatives are examined, wider acceptance of the final decision by all group members and more commitment by all group members to make the final decision work [27]. However, group decision making can be confronted with a dysfunction of highly cohesive groups called groupthink [4], [32], [33]. Groupthink occurs in group decision making when in-group pressures lead to deterioration in mental efficiency, poor tasting of reality and lax moral judgment. A group that displays symptoms of groupthink is likely to display symptoms of defective decision making [34]. Different group decision making techniques such as Delphi [35], [36], Devil’s advocacy [37] and dialectical inquiry [38] have been proposed to overcome the effect of groupthink and other inherent problems in shared decision making [27].
IV. SOLUTION METHODOLOGY
The proposed TOPSIS based algorithm for non-homogeneous alternatives in group decision making is composed of aggregating SNR vectors of all decision alternatives into a global decision matrix. This decision matrix is passed as an argument to the TOPSIS algorithm to rank the alternatives based on the set of criteria. In a summarized form, the TOPSIS algorithm is first discussed and thereafter the proposed solution algorithm is presented.
A. The TOPSIS Algorithm
The input to the TOPSIS algorithm is
m
n
dimensional decision matrix
D
(
r
ij)
mn wherem
i
1
,
2
,...,
andj
1
,
2
,...,
n
. The valuer
ij
x
j(
a
i)
subjective weights to show their level of importance. Objective weights are automatically estimated from the decision matrix data. This study considers objective weight estimation using the Shannon information entropy method [21], [24], [39], [40]. The entropy measure indicates the amount of decision information that each criterion contains and was formulated using probability theory as a measure of uncertainty in the information. The entropy method for determining the amount of decision information, which is emitted from decision criteria proceeds according to the following calculations.
mi sj ij j
r
r
p
1
(3)
The entropy
e
j where0
e
j
1
ande
j
0
wheneverp
j
0
measures the amount of uncertainty expressed by a probability distribution and is calculated as follows.
mi
j j
j
p
p
m
e
1
)
ln(
)
ln(
1
(4) The degree of divergence
d
j of the average intrinsic information contained by each criterion represents the inherent relative contrast intensity of the criterion and is calculated as follows.j
j
e
d
1
(5) The criteria weights reflect the relative importance that decision makers associate with criteria to prioritize their wants and provide the means to better understand their needs and desires for a decision alternative. The weightw
j of the j criterion is calculated as follows.
m i ij j
d
d
w
1
(6) In the second step of TOPSIS, the elements of the weighted normalized decision matrix
{
ij}
are determined using a normalization scheme. There are various normalization schemes as reported in [9] to make criteria dimensionless. In our case, we have decided to apply vector normalization as follows.
m i ij
ij j ij
ij
r
r
w
r
1 2
)
(
(7)In the third step, PIS (
A
) and NIS (A
) are respectively determined in terms of their normalized criteria value vectors. The sets of output/benefit criteria (Out) and input/cost criteria (In) are respectively maximized and minimized for PIS. Similarly, Out and In criteria are respectively minimized and maximized for NIS. This procedure makes TOPSIS naturally a min-max optimization algorithm. Specifically, PIS and NIS are calculated as follows:
}
|
}
{
max
,
|
}
{
min
{
)
,...,
(
}
|
}
{
min
,
|
}
{
max
{
)
...,
,
(
1 1 1
1 1 1
In
j
Out
j
a
a
A
In
j
Out
j
a
a
A
ij m i
ij m i n
ij m i
ij m i n
(8)
In the fourth step, the differences or separation measures between a decision alternative
A
i and PIS (A
) as well asi
A
and NIS (A
) are respectively calculated using the weighted Minkowski’s Lt metric:
p n
j
p j ij i
p
p n
j
p ij j i
p
a
A
A
d
a
A
A
d
/ 1
1
/ 1
1
)
(
)
,
(
)
(
)
,
(
(9)
where
p
1
is a distance parameter with typical values given asp
1
,p
2
andp
corresponding to Hamming, Euclidean and Chebyshev distances respectively. The Euclidean measure is used in this study because of its popularity for distance calculation.Finally, the relative closeness
0
i(
A
i)
1
, which measures the extent that the decision alternativea
i is closest to the PIS (A
) and farthest from the NIS (A
) is calculated as:)
,
(
)
,
(
)
,
(
)
(
A
A
d
A
A
d
A
A
d
A
i i i
i
i i i
i
(10)The ranking order of a decision alternative is generated according to the decreasing order of
i(
A
i)
. That is, the decision alternative with the highest ranking score
i(
A
i)
is the most preferred and the decision alternative with the lowest ranking score
i(
A
i)
is the least preferred.B. The Solution Algorithm
The process for reaching a solution of the MCDM problem in group decision making is composed of two steps, aggregation and exploitation [8]. The aggregation procedure combines the preferences of experts and the exploitation obtains a solution set of decision alternatives for the decision problem. The aggregation procedure is more suitable for our purpose and is performed in exactly two steps. First, let the 3-dimensional matrix of Equation 1 be an input to the algorithm. For each local response matrix of Equation 2 generated for a decision alternative k, the SNR vector (
s
k1,
s
k2,...,
s
rkJ) for each k decision alternative is calculated as follows:ki ki kj
r
s
SNR vectors of decision alternatives are aggregated into a global decision matrix as follows.
kn kj
k k
in ij
i i
n i
n i
K i
n j
s
s
s
s
s
s
s
s
s
s
s
s
s
s
s
s
A
A
A
A
D
X
X
X
X
2 1
2 1
2 2
22 21
1 1
12 11
2 1
2 1
(12)
Second, it is this global decision matrix that is passed as argument to the TOPSIS algorithm to rank the decision alternatives based on the selected decision criteria. The output of the algorithm is a vector of ranking scores of the decision alternatives. It is important to note that if there are K decision alternatives, there would be K execution calls to the SNR calculation on the K local response matrices and one TOPSIS operation would be performed on the global decision matrix. Consequently, this algorithm is efficient and scalable to a large number of experts.
V. EMPIRICAL EXPERIMENT
The data used to test for the effectiveness of the TOPSIS based algorithm was collected by a survey method. Surveys allow for feedback to be gathered from the perspective of decision makers and when reliable questionnaires are used, the feedback can be considered a trustworthy sample of the population [41]. In the survey experiment, 12 females and 22 males were involved and altogether 34 respondents expressed affinity for at least one sport. There were 97 responses altogether with 54 coming from male and 43 from female respondents. Although the percentage of male respondents (65%) almost doubles the percentage of female respondents (35%), the ratio of respondents to responses for female (28%) is encouraging when compared to that of male (41%). This statistic implies that more female show better knowledge of multiple sports than male.
The purpose of the survey experiment was to perform an evaluation of 10 popular sports in South Africa (SA). In doing so, we decided for the reason of comparison to consult the website of worldsportspoint.com (http://worldsportspoint .com/best-top-ten-most-popular-sports-all-time) for a list of sports. Three of the worldsportspoint.com sports of football, golf and cricket were replaced by wrestling, rugby and swimming, which are more popular in SA. For example, we could not differentiate between soccer and football because both of them mean the same thing to us. Moreover, swimming is preferred in SA as people have swimming pools at home. In addition, people enjoy watching rugby and wrestling sports during the weekends for relaxation.
Table I shows the list of 10 sports that were evaluated, number of responses received for each sport on the basis of gender and number of sport experts that evaluated certain Number of Sports (NoS). It can be seen from this table that not all respondents have complete knowledge of every listed sport. Whilst about 35% (12) of respondents were able to evaluate exactly one sport, about 6% (2) respondents were confident to evaluate all ten sports. In addition, soccer
received the largest number of responses, about 24% (23) whilst baseball received the least responses, about 3% (3). This result indicates that our methodology is in essence practically effective to incorporate a large group of people into group decision making.
TABLEI
LISTOFSPORTSEVALUATED
Sport Response
Code-Name Male (M) Female (F) M+F NoS Expert
A1-Hockey 2 3 5 1 12
A2-Volleyball 3 3 6 2 7
A3-Baseball 1 2 3 3 6
A4-Basketball 4 4 8 4 2
A5-Swimming 7 6 13 5 5
A6-Rugby 5 3 8 6 0
A7-Ping-Pong 4 4 8 7 0
A8-Tennis 7 6 13 8 0
A9-Wresting 5 5 10 9 0
A10-Soccer 16 7 23 10 2
Total 54 43 97 - 34
The evaluation of 10 sports was performed in five dimensions of perceived enjoyment measured by criteria X1-X3, perceived technicality measured by criteria X4-X6, perceived value measured by criteria X7-X9, perceived risk measured by criteria X10-X11 and perceived popularity measured by criteria X12-X14. Perceived enjoyment is a positive affective state that reflects feelings such as pleasure, liking, excitement and fun [42]. We define perceived technicality as the difficulty in playing and understanding the strategies and rules of a sport. Perceived value in this case considers the ratio of outcome/input of spectators to the outcome/input of players [43]. Perceived risk/cost in this case includes nonmonetary sacrifices such as time consumption, energy consumption and stress
experienced [44]. We define perceived popularity as the
extent to which people are aware of a particular sport. The evaluation score was based on a measurement instrument of 7-point semantic differential scale (strongly disagree=1, 2, 3, 4, 5, 6, 7=strongly agree). Table II shows a real life example of evaluation of volleyball, basketball, tennis, wrestling and soccer sports as provided by a male respondent.
TABLEII
EVALUATIONOF10SPORTS
CD A1 A2 A3 A4 A5 A6 A7 A8 A9 A10
X1 7 5 5 7 7
X2 7 1 1 1 7
X3 6 6 6 7 7
X4 1 7 5 7 2
X5 1 5 4 7 1
X6 1 7 3 7 1
X7 6 7 4 6 7
X8 7 4 4 6 7
X9 7 4 3 6 7
X10 2 5 1 7 7
X11 2 3 1 2 1
X12 5 2 3 2 7
X13 4 1 2 1 7
X14 5 2 6 7 7
this sport, X13 = Many people like playing this sport, X14 = Many people are aware of this sport.
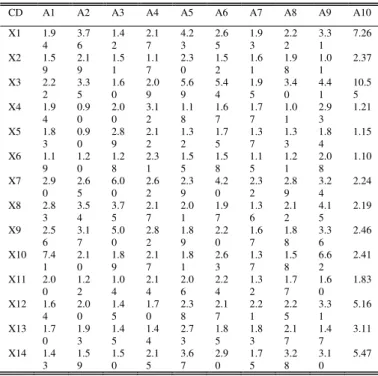
The global decision matrix was obtained for 10 sports and 14 evaluation criteria by calculating SNR vector for each local response matrix. These vectors were then aggregated to form the global decision matrix. Table III shows this result for the 10 sports evaluated by 34 respondents.
TABLE III GLOBAL DECISION MATRIX FOR 10 SPORTS AND 14 DECISION CRITERIA
CD A1 A2 A3 A4 A5 A6 A7 A8 A9 A10
X1 1.9 4 3.7 6 1.4 2 2.1 7 4.2 3 2.6 5 1.9 3 2.2 2 3.3 1 7.26 X2 1.5 9 2.1 9 1.5 1 1.1 7 2.3 0 1.5 2 1.6 1 1.9 8 1.0 1 2.37 X3 2.2 2 3.3 5 1.6 0 2.0 9 5.6 9 5.4 4 1.9 5 3.4 0 4.4 1 10.5 5 X4 1.9 4 0.9 0 2.0 0 3.1 2 1.1 8 1.6 7 1.7 7 1.0 1 2.9 3 1.21 X5 1.8 3 0.9 0 2.8 9 2.1 2 1.3 2 1.7 5 1.3 7 1.3 3 1.8 4 1.15 X6 1.1 9 1.2 0 1.2 8 2.3 1 1.5 5 1.5 8 1.1 5 1.2 1 2.0 8 1.10 X7 2.9 0 2.6 5 6.0 0 2.6 2 2.3 9 4.2 0 2.3 2 2.8 9 3.2 4 2.24 X8 2.8 3 3.5 4 3.7 5 2.1 7 2.0 1 1.9 7 1.3 6 2.1 2 4.1 5 2.19 X9 2.5 6 3.1 7 5.0 0 2.8 2 1.8 9 2.2 0 1.6 7 1.8 8 3.3 6 2.46 X10 7.4 1 2.1 0 1.8 9 2.1 7 1.8 1 2.6 3 1.3 7 1.5 8 6.6 2 2.41 X11 2.0 0 1.2 2 1.0 4 2.1 4 2.0 6 2.2 4 1.3 2 1.7 7 1.6 0 1.83 X12 1.6 4 2.0 0 1.4 5 1.7 0 2.3 8 2.1 7 2.2 1 2.2 5 3.3 1 5.16 X13 1.7 0 1.9 3 1.4 5 1.4 4 2.7 3 1.8 5 1.8 3 2.1 7 1.4 7 3.11 X14 1.4 3 1.5 9 1.5 0 2.1 5 3.6 7 2.9 0 1.7 5 3.2 8 3.1 0 5.47
The Shannon information entropy method was used to calculate objective weights of the decision criteria by applying it to the global decision matrix. The resulting weights were scaled so that they sum to unity. Table IV shows this result wherein, it can be seen that criterion X10 (this sport is associated with high risk of being injured) has the highest weight of 0.17822 as most respondents perceived sports like wrestling and hockey to be risky.
TABLEIV
CRITERIA,DIMENSIONSANDTHEIRWEIGHTS Criterion Weight Dimension Weight
X1 0.11081
Enjoyment 0.30103 X2 0.03133
X3 0.15889
X4 0.07479
Technicality 0.15446 X5 0.04774
X6 0.03193
X7 0.04886
Values 0.14950 X8 0.05024
X9 0.05040
X10 0.17822
Risk 0.20355 X11 0.02533
X12 0.07164
Popularity 0.19144 X13 0.03180
X14 0.08800
This is probably the reason both sports were ranked low as seen in Table V. Similarly, the criteria X11 (this sport requires much time to master) is the least important as most
respondents perceived those sports evaluated as not requiring much time to master. Among the dimensions used for the evaluation, enjoyment received the most important consideration among respondents with a weight of 0.30103. People prefer sports because of the enjoyment and excitement they derive from them. However, the respondents saw value as the least important dimension as they prefer sports for fun and not for monetary gain. Finally, the TOPSIS based algorithm was applied to the global decision matrix to rank the 10 sports relative to the 14 criteria. The effects of criteria measuring enjoyment, value and popularity were maximized whilst the effects of those criteria measuring technicality and risk were minimized in the TOPSIS. This is because enjoyment, value and popularity were considered output dimensions as they provide positive rewards. However, technicality and risk are considered input dimensions as they offered no potential advantage, therefore, their effects were minimized. Table V shows this result, wherein it can be seen that soccer was rated highest and hockey was rated lowest. This result is comparable with that obtained by the worldsportspoint.com and clearly indicates justification for the replacement that we made. This is because swimming and rugby were seen to be popular in SA as they ranked higher. In fact besides the soccer league, rugby is the next well developed sport in SA. Moreover, the result of this study also indicates that the TOPSIS based algorithm is effective as it finds an optimal solution that is closest to PIS and farthest from NIS simultaneously.
TABLEV
RANKINGOF10SPORTSBYTOPSISCOMPAREDTO WORLDSPORTSPOINT.COMTOP10
PIS NIS RANK No SA
Sport
Top 10 0.03043 0.14732 0.82879 1 Soccer Soccer 0.07214 0.10764 0.59872 2 Swimming Cricket 0.08569 0.08977 0.51162 3 Rugby Hockey 0.09954 0.09977 0.50058 4 Tennis Tennis 0.09747 0.09546 0.49481 5 Volleyball Volleyball 0.11792 0.09710 0.45156 6 Ping-Pong Ping-Pong 0.12351 0.09197 0.42683 7 Baseball Baseball 0.11849 0.08284 0.41147 8 Basketball Golf 0.11917 0.04845 0.28903 9 Wrestling Basketball 0.14954 0.02332 0.13492 10 Hockey Football
VI. CONCLUSION
This paper describes a TOPSIS based algorithm for non-homogeneous alternatives in group decision making. The algorithm was tested on the sport dataset. The result of the testing is comparable to that obtained by the worldsportspoint.com with 7 common sports in which 5 (71%) of them (soccer, tennis, volleyball, ping-pong and baseball) gave exactly the same rank orders. However, we are not sure of the criteria and method that worldsportspoint.com used for their evaluation. This result shows that the proposed algorithm is significantly useful for solving decision making problem with non-homogeneous decision alternatives.
ACKNOWLEDGMENT
We would like to thank Nareen Gonsalves of Information Technology Department for perusing this paper and making useful corrections.
REFERENCES
[1] C.L. Hwang and K. Yoon, “Multiple attribute decision making methods and applications.” Springer-Verlag, New York, 1981. [2] S.E. Dinçer, “Multi-criteria analysis of economic activity for
European Union member states and candidate countries: TOPSIS and WSA applications”. European Journal of Social Sciences, vol. 21, no.4, pp. 563-572, 2011.
[3] B. Roy, “Multicriteria analysis: survey and new directions.” European Journal of Operation Research. Vol. 8, pp. 207-218, 1981.
[4] F.C. Lunenburg, “Group decision making: the potential for groupthink.” Int. J. of Management, Business and Administration, vol. 13, no. 1, pp. 1-6, 2010.
[5] D.A. Haas and F.H. Murphy, “Compensating for non-homogeneity in decision-making units in data envelopment analysis.” European Journal of Operational Research, vol. 144, pp. 530–544, 2003. [6] S.R. Farzipoor, “A new approach for selecting slightly
non-homogeneous vendors.” Journal of Advances in Management Research, vol. 6, no. 2, pp. 144-153, 2009.
[7] F. Herrera, E. Herrera and J.L. Verdegay, “Choice processes for non-homogeneous group decision making in linguistic setting.” Fuzzy Sets and Systems, vol. 94, pp. 287-304, 1998.
[8] F. Herrera, L. Martinez and P.J. Sanchez, “Managing non-homogeneous information in group decision making.” European Journal of Operational Research, vol. 166, pp. 115–132, 2005. [9] H. Shih, H. Shyur and E.S. Lee, “An extension of TOPSIS for group
decision making.” Mathematical and Computer Modelling, vol. 45, 801-813, 2007.
[10] T.L. Saaty and L.G. Vargas “Decision making in economic, political, social and technological environments with the analytic hierarchy process Series”. RSW Publications, 1994, pp. 175-184.
[11] N. Ahmad and P. Laplante, “Using the analytical hierarchy process in selecting commercial real-time operating systems.” International Journal of Information Technology & Decision Making, vol. 8, no. 1, pp. 151-168, 2009.
[12] J.R. Doyle and R.H. Green, “Data envelopment analysis and multiple criteria decision making.” Omega, vol. 21, no. 6, pp. 713–715, 1993. [13] T.J, Stewart, “Relationships between data envelopment analysis and
multicriteria decision analysis.” Journal of the Operational Research Society, vol. 47, no.5, pp. 654–665, 1996.
[14] M. Koksalan and E. Tuncer, “A DEA–based approach to ranking multi-criteria alternatives.” International Journal of Information Technology & Decision Making, vol. 8, no. 1, pp.29-54, 2009. [15] E. Takeda and J.A. Satoh,”Data envelopment analysis approach to
multicriteria decision problems with incomplete information.” Computers & Mathematics with Applications, vol. 39, pp. 81-90, 2000.
[16] T.R. Anderson, K. Hollingsworth and L. Inman, “The fixed weighting nature of a cross-evaluation model.” Journal of Productivity Analysis, vol. 17, no.3, pp. 249–255, 2002.
[17] J.R. Doyle, “Multiattribute choice for the lazy decision maker: let the alternatives decide.” Organizational Behavior and Human Decision Processes, vol.62, no. 1, pp. 87-100, 1995.
[18] Z. Iravani, F.H. Lotfi and M.A. Namin, “An algorithm for the calculation of progress or regress via Topsis and Malmquist productivity index.” Applied Mathematical Sciences, vol. 3, no. 52, pp 2553-2562, 2009.
[19] Y.O. Yang, “A VIKOR-based multiple criteria decision method for improving information security risk.” International Journal of Information Technology & Decision Making, vol. 8, no. 2, pp. 267-287, 2009.
[20] D. Li, “Relative ratio method for multiple attribute decision making problems.” Int. J. Inform. Technol. Decision Making, vol. 8, no. 2, pp. 289–311, 2009.
[21] J. Khosravi, M.A. Asoodar, M.R.Alizadeh and M.H. Peyman,”Application of multiple criteria decision making system compensatory (TOPSIS) in selecting of rice milling system.” World Applied Sciences Journal, vol.13, no. 11, pp. 2306-2311, 2011. [22] M. Salehi and R.J. Moghaddam, “Project selection by using a Fuzzy
Topsis technique.” World Academic of Science, Engineering and Technology, vol. 40, pp.85-90, 2008.
[23] C.K. Fan and S.W. Cheng, “Using analytic hierarchy process method and technique for order preference by similarity to ideal solution to evaluate curriculum in department of risk management and insurance.” J. Soc Sci vol. 19, no. 1, pp. 1-8, 2009.
[24] M. Nilashi, K. Bagherifard, O. Ibrahim, N. Janahmadi and H. Alizadeh, “Multi-criteria approach to the evaluation of Malaysian government portal.” Journal of Theoretical and Applied Information Technology, vol. 40, no. 2, pp. 194-201, 2012.
[25] C. Chen, “Extensions of the TOPSIS for group decision-making under fuzzy environment”. Fuzzy Sets and Systems, vol. 1, no. 14, pp. 1-9, 2000.
[26] D. Li, G. Chen and Z. Huang, “Linear programming method for multiple criteria group decision making using IF sets.” Information Science, vol. 180, pp. 1591-1609, 2010.
[27] F.C. Lunenburg, “Decision making in organizations.” International Journal of Management, Business and Administration, vol. 15, no.1, pp. 1-9, 2011.
[28] M.L. Kamberg, “How business decisions are made.” Buffalo, NY: Rosen Publishing Group. 2012.
[29] N. Foote, E. Matson, L. Weiss and E. Wenger, “Leveraging group knowledge for high-performance decision making”. Organizational Dynamics, vol. 31, no. 2, pp. 280-295, 2002.
[30] B.L. Bonner, S.D. Sillito and M.R. Baumann, “Collective estimation: accuracy, expertise and extroversion as sources of intra-group influence.” Organizational Behavior and Human Decision Processes, vol. 103, pp. 121-133, 2007.
[31] D. Gigone and R. Hastie,”Proper analysis of the accuracy of group judgments.” Psychological Bulletin, vol. 121, no. 1, pp. 149-167, 1997.
[32] A.L. Brownstein, “Biased predecision processing.” Psychological Bulletin, vol. 129, pp. 545-591, 2003.
[33] J. Chapman, “Anxiety and defective decision making: an elaboration of the groupthink model.” Management Decision, vol. 44, pp. 1391-1404, 2006.
[34] I.L. Janis, “Groupthink: psychological studies of policy decisions and fiascos.” 2nd ed. Boston, MA: Houghton Mifflin, 1982.
[35] N. Dalkey, The Delphi method: an experimental study of group opinion. Santa Monica, CA: Rand Corporation, 1969.
[36] T. Gordon and A. Pease, “RT Delphi: an efficient, round-less almost real time Delphi method.” Technological Forecasting & Social Change, vol. 73, pp. 321–333, 2006.
[37] C.R. Schwenk, “Devil’s advocacy in managerial decision making”. Journal of Management Studies, vol. 21, no. 2, pp. 153-168, 1984. [38] D.M. Schweiger, W.R. Sandberg and J.W. Ragan, “Group approaches
for improving strategic decision making: a comparative analysis of dialectical inquiry, devil’s advocacy and consensus.” Academy of Management Journal, vol. 29, no. 1, pp. 51-70, 1986.
[39] H. Deng, C. Yeh, C and R.J. Willis, “Inter-company comparison using modified TOPSIS with objective weights”. Computer & Operations Research, vol. 27, no. 10, pp. 963-973, 2000.
[40] C. Chen and M. Chuang, “Integrating the Kano model into a robust design approach to enhance customer satisfaction with product design.” Int. J. Production Economics, vol. 114, pp. 667– 681, 2008. [41] Y. Qiu, P. Yu and P.A. Hyland, “Multi-method approach to assessing
health information systems end users' training needs.” Medinfo 2007: Proceedings of the 12th World Congress on Health (Medical) Informatics; Building Sustainable Health Systems, 2007, pp. 1352-1356.
[42] R.W. Motl, R.K. Dishman, R. Saunders, M. Dowda, G. Felton and R.R. Pate, “Measuring enjoyment of physical activity in adolescent girls.” Am J Prev Med, vol. 21, no. 2, pp. 110-117, 2001.
[43] R.L. Oliver and W.S. DeSarbo, “Response determinants in satisfaction judgments.” Journal of Consumer Research, vol. 14, pp. 495–508, 1988.