www.biogeosciences.net/6/623/2009/
© Author(s) 2009. This work is distributed under the Creative Commons Attribution 3.0 License.
Biogeosciences
Vegetation and proximity to the river control amorphous silica
storage in a riparian wetland (Biebrza National Park, Poland)
E. Struyf1,2, W. Opdekamp2, H. Backx2, S. Jacobs2, D. J. Conley1, and P. Meire2
1Lund University, GeoBiosphere Science Centre, Department of Geology, S¨olvegatan 12, 22362 Lund, Sweden 2University of Antwerp, Department of Biology, Ecosystem Management Research Group, Universiteitsplein 1c,
2610 Wilrijk, Belgium
Received: 17 September 2008 – Published in Biogeosciences Discuss.: 15 January 2009 Revised: 14 April 2009 – Accepted: 16 April 2009 – Published: 23 April 2009
Abstract. Wetlands can modify and control nutrient fluxes between terrestrial and aquatic ecosystems, yet little is known of their potential as biological buffers and sinks in the biogeochemical silica cycle. We investigated the stor-age of amorphous silica (ASi) in a central-European riparian wetland. The variation in storage of ASi in the soil of an undisturbed wetland was significantly controlled by two fac-tors: dominance of sedges and grasses and distance to the river (combinedR2=78%). Highest ASi storage was found near the river and in sites with a dominance of grasses and sedges, plants which are well known to accumulate ASi. The management practice of mowing reduced the amount of vari-ation attributed to both factors (R2=51%). Although ASi concentrations in soils were low (between 0.1 and 1% of soil dry weight), ASi controlled the availability of dissolved sil-ica (DSi) in the porewater, and thus potentially the exchange of DSi with the nearby river system through both diffusive and advective fluxes. A depth gradient in ASi concentra-tions, with lower ASi in the deeper layers, indicates disso-lution. Our results show that storage and recycling of ASi in wetland ecosystems can differ significantly on small spa-tial scales. Human management interferes with the natural control mechanisms. Our study demonstrates that wetlands have the potential to modify the fluxes of both DSi and ASi along the land-ocean continuum and supports the hypothesis that wetlands are important ecosystems in the biogeochemi-cal cycling of silica.
Correspondence to:E. Struyf ([email protected])
1 Introduction
Biologically controlled uptake and storage of silica and its recycling in terrestrial ecosystems is a significant component of the global biogeochemical silica cycle (Conley, 2002). It forms an essential buffer between mineral weathering, the ultimate source of dissolved silica (DSi), and the eventual export to the aquatic environment. Biogenic amorphous sil-ica (ASi) stored in soils as plant phytoliths and diatoms, is several orders of magnitude more soluble than mineral sili-cates (Farmer et al., 2005) and the recycling of ASi exhibits an important control on terrestrial DSi export (e.g. Derry et al., 2005; Fulweiler et al., 2005; Sommer et al., 2006). DSi mobilization in the terrestrial environment is the primary sil-ica source for aquatic and eventually coastal and oceanic en-vironments (Van Cappellen, 2003), where it is an essential nutrient for diatoms (Bacillarophyceae). The availability of DSi relative to other nutrients can influence the occurrence of harmful algal blooms (e.g. Smayda, 1997). In addition, the uptake of DSi and burial of diatoms on the ocean floor is an important sink for atmospheric carbon on biological time scales (Dugdale et al., 1995). Moreover, terrestrial min-eral silicate weathering is an essential controlling mechanism for atmospheric CO2concentrations on geological timescales
(Berner et al., 1983). Understanding the land-based cycling of silica is essential in understanding carbon biogeochem-istry and eutrophication.
for exported DSi (Bartoli, 1983; Farmer et al., 2005). More recently, a literature overview suggested that wetlands have the potential to exhibit a profound influence on terrestrial sil-ica transport and storage (Struyf and Conley, 2009). Wet-lands can modify nutrient fluxes along the aquatic continuum through transformation and storage. Silica rich biomass, to-gether with the frequent occurrence of diatoms and sponges in wetlands, provides the potential for the accumulation of ASi rich soils (Clarke, 2003; Struyf et al., 2005). Struyf and Conley (2009) hypothesized that a trade-off between the stor-age of ASi in wetland soils and the export of DSi from wet-lands depends on hydrological and vegetation characteristics. However, little research has actually focused on the factors controlling accumulation and recycling of ASi in wetlands that could verify this hypothesis. By contrast, the impor-tance of wetlands in other nutrient cycles (N and P) as sinks and processors has been intensively studied (e.g. Gusewell and Koerselman, 2002; Gribsholt et al., 2005), highlighting the role of riparian wetlands in reducing excessive N and P inputs to aquatic ecosystems (e.g. Hattermann et al., 2006; Olde-Venterink et al., 2006). Silica cycling related research in wetlands has focused on tidal marshes (Struyf and Conley 2009), which are characterized by low water residence times and frequent flooding leading to the rapid recycling of buried ASi (Struyf et al., 2006), and with increasing sedimentation resulting in more efficient burial of ASi (Struyf et al., 2007a). The marsh grassPhragmites australisis a key participant in the uptake of DSi, its transformation to ASi and recycling in tidal marshes (Struyf et al., 2007b). Research in tidal wet-lands clearly shows the importance of hydrological connec-tivity and vegetation in wetland silica biogeochemistry.
We have examined the storage of ASi in a central-European riparian wetland in Poland, characterized by a dominance of sedge and grass vegetation. A number of wet-land plants are important accumulators of ASi (e.g. Lanning and Eleuterius, 1985; Struyf et al., 2005), butCyperaceae
(sedges) andPoaceae(grasses) are the most efficient accu-mulators. Wetland grasses and sedges on average contain 0.5–4% of Si in their tissues, while exceptionally high values up to 20% have been recorded (Struyf and Conley, 2009). We sampled for ASi along gradients in distance to the river (as a proxy for hydrology and river connectivity), in the dom-inance of grasses and sedges and at both managed (annual mowing) and unmanaged sites. Porewater DSi concentra-tions were sampled as an indicator of recycling of ASi. Our sampling was aimed to test the hypothesis by Struyf and Con-ley (2009) that silica storage and recycling depends on river connectivity and vegetation. Our data show that river dis-tance and vegetation can explain most of the observed vari-ation in ASi storage, with human management (mowing) in-terfering with and reducing these control mechanisms.
Fig. 1.Biebrza National Park and the position of Rogozynek in the upper basin (right panel). Sampling schedule at Rogozynek (lower panel) with all 17 sampling sites.
2 Materials and methods
2.1 Sampling site
The Biebrza River valley (Fig. 1), located in NE-Poland (22◦30′–23◦60′E, 53◦30′–53◦75′N) harbours one of the best
preserved wetlands in Central Europe with few draining and land reclamation activities. A regular pattern of marsh and fen communities arranged parallel to the river attests to its pristine character. The river drains a catchment area of ca. 7000 km2. The area has a temperate continental climate with a mean annual gross precipitation of 583 mm and a mean annual temperature of 6.8◦C. The Biebrza River valley
Table 1.Dominant vegetation (all genera with higher than 10% dominance in the plot), distance from the river and grass and sedge dominance (P+C dominance, as percentage of the total number of vegetation), summarized for all the sampling spots, as in Figs. 1 and 4.
Managed vegetation
Plot Distance from river (m) P+C Dominance (%) Dominant genera
1 234 83 Carex (66%), Festuca (16%)
2 150 30 Carex (25%), Geum (18%), Filipendula (15%)
3 122 89 Carex (82%)
4 65 54 Carex (45%), Menyanthes (10%)
5 252 60 Carex (29%), Festuca (22%), Ranunculus (18%)
6 191 80 Carex (57%), Festuca 22 (%)
7 108 61 Carex (44%), Geum (13%), Festuca (9%)
8 70 61 Carex (43%), Festuca (16%), Filipendula (9%)
9 35 60 Carex (58%), Potentilla (8%), Menyanthes (8%)
10 262 44 Carex (28%), Festuca (10%), Ranunculus (9%)
11 177 42 Carex (41%), Ranunculus (14%), Filipendula (11%)
12 105 49 Carex (43%), Galium (10%), Ranunculus (10%)
13 48 35 Carex (18%), Ranunculus (15%), Poa (13%)
14 254 53 Carex (41%), Galium (13%), Festuca (8%)
15 160 48 Carex (29%), Galium (15%), Poa (11%)
16 90 53 Carex (39%), Galium (13%), Poa (10%)
17 38 41 Carex (35%), Galium (14%), Trifolium (9%)
Unmanaged vegetation
Plot Distance from river (m) P+C Dominance (%) Dominant genera
1 234 78 Carex (74%)
2 150 62 Carex (49%), Filipendula (16%)
3 122 67 Carex (64%)
4 65 60 Carex (54%), Geum (16%)
5 252 65 Carex (46%), Poa (12%), Equisetum (10%)
6 191 75 Carex (56%), Festuca (19%)
7 108 56 Carex (49%), Galium (8%)
8 70 64 Carex (53), Geum (14%), Festuca (11%)
9 35 73 Carex (53%), Phragmites (14%), Urtica (13%)
10 262 57 Carex (57%), Viola (15%), Thelypteris (15%)
11 177 51 Carex (42%), Viola (9%), Geum (8%)
12 105 50 Carex (50%), Filipendula (17%)
13 48 43 Carex (36%), Geum (23%), Viola (16%)
14 254 49 Carex (49%), Potentilla (29%)
15 160 53 Carex (47%), Ranunculus (15%), Potentilla (13%)
16 90 34 Carex (33%), Geum (22%), Filipendula (13%)
17 38 37 Carex (37%), Geum (17%), Filipendula (15%)
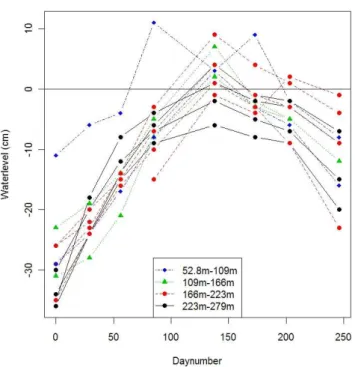
10% or more coverage) at every site is provided in Table 1, as well as the total grass and sedge dominance. The depth of the groundwater table at different distances from the river sampled from September 2007 to June 2008 is provided in Fig. 2.
2.2 ASi concentrations
2 cores (Ø 2 cm) of 30 cm were taken at every site in June 2007 and in total 68 cores were taken. Every core was subdi-vided into three sections of 10 cm (0–10 cm, 10–20 cm and 20–30 cm) and every depth section was analysed for ASi
concentration. ASi was determined by alkaline extraction of 30 mg of freeze-dried sediment in 1% Na2CO3 solution
Fig. 2. Groundwater at the Rogozynek site in function of dis-tance from the river, as sampled at 10 locations. The initial day of sampling was 14 september 2007. Positive numbers indicate that groundwater level was above the soil surface.
2.3 Porewater DSi concentrations
Porewaters were sampled in the upper 10 cm using Ei-jkelkamp polymerous rhizons (diameter 2.5×1.4 mm, 10 cm
length) in June 2007. Porewater was sampled at random with 3 rhizons at every site, and the samples were pooled at each site. The pooled sample was analyzed for DSi concentration on an IRIS® ICP (Inductively Coupled Plasma Spectropho-tometer, Thermo®).
2.4 Vegetation
Vegetation composition at all sampling sites was determined at four randomly chosen plots using a cover pin frame (75 points/frame) in June 2006 (Kent and Coker, 1992). The combined cover of grasses (Poaceae) and sedges ( Cyper-aceae) was expressed as a percentage of total individuals counted, belonging to either of both plant families. Dom-inance was preferred over number of individuals, as it was assumed to better reflect the overall vegetation composition on a longer time scale, rather than current absolute number of individuals counted. A summary of the dominant plant genera (all species with 10% or more coverage) at every site is provided in Table 1, as well as the grass and sedge domi-nance.
2.5 Statistics
Extrapolation of ASi, DSi and vegetation structure over the study site was accomplished using the kriging software FIELDS (Nychka, 2007) in the statistical software packet R (R Development Core Team, 2008, http://www.r-project. org/). All other statistical tests were performed using the sta-tistical software package SPSS® 14.0.
3 Results
3.1 ASi concentrations
The highest ASi concentrations were observed at sites clos-est to the Biebrza River and, in general, in the top 10 cm of the soil profile (Fig. 3). However, at sites near the river the highest ASi concentrations were observed in deeper layers. The areal distribution of ASi in the upper 10 cm of sediment extrapolated over the study area also shows higher ASi concentrations closer to the river (Fig. 4b). Gen-eral depth related trends in ASi concentration were inves-tigated using paired two-tailed Wilcoxon signed rank tests (corrected for multiple testing), comparing depth sections within the 34 cores taken at sites with unmanaged veg-etation and managed vegveg-etation. All depth layers dif-fered significantly for ASi concentration in the unmanaged vegetation (0–10 cm (L1)>10–20 cm (L2)>20–30 cm (L3); L1, L2 p<0.002; L1, L3 p<0.0001; L2, L3 p<0.005). Paired Wilcoxon signed rank tests for sites in the managed vegetation indicated that the two deeper layers were not significantly different (0–10 cm (L1)>10–20 cm (L2)=20– 30 cm (L3); L1, L2 p<0.0004; L1, L3 p<0.002; L2, L3p=0.84). These tests show that the surface layer is sig-nificantly enriched in ASi compared to deeper layers. 3.2 Effect of vegetation and distance from the river
The relationship between vegetation composition, proximity to the Biebrza River and ASi concentration was analysed for the upper 10 cm of soil. A significant logarithmic decrease of ASi concentrations in the top 10 cm of sediment with in-creasing distance perpendicular to the river was found both at managed (R2=0.29; F1,32=13.36; p<0.001) and
unman-aged vegetation sites (R2=0.46; F1,32=27.48; p<0.00001)
A. Unmanaged vegetation
0 0,5 1 1,5
0 50 100 150 200 250 300
Distance from river (m)
A
S
i
(w
t%
)
0-10 cm 10-20 cm 20-30 cm
B. Managed vegetation
0 0,5 1 1,5
0 50 100 150 200 250 300
Distance from river (m)
Fig. 3. ASi concentration (% ASi of sediment weight, wt%) in unmanaged(a)and managed(b)vegetation in relation to perpendicular distance from the river to the sampling site, in three different depth layers.
Fig. 4.Grass and sedge dominance (% of total number of plant in-dividuals, panela), ASi concentration (% ASi of sediment weight, wt%, panelb) and porewater DSi (µm, panelc) as observed over the Rogozynek site. Black dots are unmanaged vegetation sampling spots, open white dots managed vegetation. Red straight lines indi-cate the sampled gradients in distance from the river Biebrza.
ASi – ASi expected from distance). A positive linear rela-tionship between combinedPoaceaeandCyperaceae domi-nance and residual distance corrected ASi is apparent in the top soil (Fig. 5c) in the unmanaged vegetation (R2=0.30; F1,32=14.00; p<0.002). A similar relationship was found
in the managed vegetation (Fig. 5c), but the ASi concentra-tion increase with dominance was less steep, and the relaconcentra-tion- relation-ship was only marginally significant (R2=0.13; F1,32=4.78;
p<0.04). It is important to note that there was no signifi-cant linear relationship between the distance perpendicular to river and the combined grass and sedge dominance both
at managed and unmanaged vegetation sites (Fig. 5d, Man-aged vegetation: R2=0.04;p>0.46, Unmanaged vegetation
R2=0.08;p>0.28).
Combining the grass and sedge dominance and the dis-tance to the Biebrza River in one factor (by dividing the
Poaceae andCyperaceae dominance by perpendicular dis-tance to the river), a significant linear relationship between this new factor and observed ASi concentration was found, both in the managed and unmanaged vegetation. Combining vegetation and distance to the river we account for (R2) 78% (F1,32=115.06;p<10−11,R2for only distance was 46%) of
the observed ASi variation at the unmanaged vegetation sites, and 51% of the variation at the managed vegetation sites (F1,32=33.41; p<0.00001, R2 for only distance was 29%)
(Fig. 6). For both sites containing managed and unmanaged vegetation, the combined factor improves ASi variation ac-counted for by 60 and 70 % compared to distance to the river alone. Both the distance from the river and the vegetation independently account for part of the ASi variation observed over the wetland. The combined effect of vegetation and dis-tance is stronger at unmown sites. The combined influence of vegetation and distance from the river is also apparent in Fig. 4a and b. While the gradient associated with distance from the river is situated along a North-South axis, the grass and sedge dominance primarily increases from West to East. The result is highest ASi concentrations in the SE part and lowest concentrations in the NW part of the Upper Basin. 3.3 Porewater concentrations
0 20 40 60 80 100
0 50 100 150 200 250 300
Distance from river (m)
G r a ss + s e dg e do m ina nc e ( % ) 0 0,2 0,4 0,6 0,8
0 50 100 150 200 250 300
Distance from river (m)
A S i (w t%) i n u p p e r 1 0 c m Managed Unmanaged Unmanaged Managed 0 0,2 0,4 0,6 0,8
0 20 40 60 80 100
Grass and sedge dominance (%)
A S i (w t% ) -0,2 -0,1 0 0,1 0,2
20 40 60 80 100
Grass and se dge dominance (%)
Di st a n ce co rre ct ed A S i ( w t% ) a b c d
Fig. 5.ASi patterns in both the unmanaged and managed vegetation.(a)ASi in the top 10 cm of soil vs. distance from the river.(b)ASi in the top 10 cm of soil vs. grass and sedge dominance in vegetation.(c)distance effect “corrected” ASi in top 10 cm of soil vs. grass and sedge dominance.(d)distance from the river and grass and sedge dominance as independent variables.
0 0,2 0,4 0,6 0,8 1
0 0,5 1 1,5 2 2,5
Grass + sedge dominance / distance to river
A S i (w t% ) Managed Unmanaged Managed Unmanaged
Fig. 6.Relation between a factor combining vegetation and distance (vegetation dominance (%) divided by distance from the river (m)) and the distribution of ASi concentration in the top 10 cm of soil in the unmanaged and managed vegetation.
unmanaged datasets (R2=0.45; F1,32=12.04;p<0.001). The
association between soil ASi and porewater DSi is evident in Fig. 4b and c, where porewater DSi shows the same gradient as ASi concentrations.
0 100 200 300
0 0,2 0,4 0,6 0,8 1
ASi (wt%) DS i (µ M ) Unmanaged Managed
Fig. 7.ASi in soil (averaged per two observations in the same site and the same management type) vs. observed porewater DSi con-centrations. Observations are for both managed and unmanaged vegetation.
4 Discussion
as previously hypothesized by Struyf and Conley (2009). In this review, the authors showed that wetlands can profoundly impact the biogeochemical silica cycle through the activities of silica accumulating organisms such as diatoms, sponges, grasses and sedges, although few studies have documented this role of wetlands in silica cycling. Our data support this new understanding. In addition, we show that ASi storage in wetlands is highly variable on small spatial scales, and that recycling to DSi is directly affected by this variation. Our data suggest a link between vegetation (dominance of grasses and sedges) and ASi storage. Evidence linking vege-tation to storage of ASi in soils has been available from other ecosystems. In forest soils, higher ASi concentrations in soil profiles occur in forests dominated by beech (relatively rich in ASi) as compared to pine, a species poor in Si (Bartoli and Souchier, 1978; Bartoli, 1983; Saccone et al., 2008). The largest accumulation of ASi in soils has been observed at the island of R´eunion from the historical accumulation of phy-toliths contained in bamboo, the most efficient Si accumula-tor among all higher plants (Meunier et al., 1999). Blecker et al. (2006) hypothesized that storage of ASi in grasslands also strongly depends on precipitation, with high precipita-tion and frequent soil water renewal stimulating export of DSi from the system, after dissolution of soil ASi.
4.1 The river distance proxy
In our study, river distance has been used as a proxy for hy-drological characteristics and river connectivity. The proxy accounted for a significant fraction of the variation in ASi concentrations, independently from grass and sedge domi-nance. We hypothesize that the observed variation of ASi with distance from the river can be explained by a mechanism observed previously in tidal wetlands. During winter and spring, the Biebrza River floods the Rogozynek site. During these flooding events, the river imports suspended material into the floodplain, potentially co-importing ASi as both phy-toliths and diatom frustules in suspended particulate matter. Within the wetland, stream velocities quickly drop, causing all but the lightest particles to be deposited near the river. In tidal marshes, it has been shown that most suspended matter is deposited close to the river or creek banks (Temmerman et al., 2003), and a similar process was observed in non-tidal floodplains (Asselman and Middelkoop, 1995). Dense vege-tation, as observed along the Biebrza, further stimulates rapid settling of particulate suspended matter. The highest import of allochtonous ASi is therefore expected near the river. An-other possible mechanism for the enhanced ASi concentra-tions near the river, would be a tendency for more Si rich grasses and/or sedges to occur. The site richest in ASi (site 9) was characterized by a relatively important dominance of
Phragmites australis, well known for its large content of ASi compared to most other grasses (Hodson et al., 2002; Struyf et al., 2005). Unfortunately, we have no data of ASi in above-ground biomass for the Rogozynek site.
Storage of ASi could also be directly related to ground-water hydrology. Frequent oxidation-reduction cycles have been proposed to stimulate the dissolution of ASi (Beck-with and Reeve, 1963; Sommer et al., 2006) (Beck-with the sorp-tion of DSi into sesquioxides under oxygenated condisorp-tions and adsorbed DSi subsequently released after a return to re-duced conditions with dissolution of iron oxides. We have no full hydrological characterization of the site, and cannot confirm if oxidation-reduction is more intense at sites far-ther from the river. However, at least one piezometer near to the river showed persistent reduced conditions. Permanent water-logging could also slow dissolution of ASi for long time-periods through the build-up of DSi concentrations in the soil water. At sites with more frequent flooding and flush-ing of porewater with a greater flow of water, enhanced dis-solution would be expected. Finally, more permanent wet conditions could enhance the growth of diatoms and sponges enhancing the accumulation of ASi. It is clear that the link between ASi storage and recycling in wetlands and hydrol-ogy needs further study to quantify its impact on the small-scale variation observed.
4.2 Vegetation and management
Our results demonstrate that the pre-dominance of ASi rich vegetation can significantly stimulate ASi storage in wetland soils, as previously shown on larger spatial scales in differ-ent ecosystems (e.g. Bartoli, 1983; Jensen et al., 2003). This would imply that Poaceae and Cyperaceae dominance, as frequently observed in wetlands, increases DSi availability in soils available to plants by building a recyclable pool of soil ASi. Increased DSi availability through dissolution of ASi could in turn enhance grasses’ and sedges’ competitive-ness. DSi uptake by plants is well known to enhance their re-sistance to multiple stressors, and thus potentially their com-petitiveness (e.g. Epstein, 1999; Massey et al., 2007). We hypothesize that ASi build-up as a result of biomass burial, and resulting high porewater DSi concentrations, might inforce DSi availability and grasses’ dominant position, re-sulting in a positive feedback loop. A continuous import of DSi from the river or from groundwater is a necessary condi-tion for this hypothesis of surficial ASi build-up and should be fulfilled in a majority of riparian wetland sites, buffering groundwater and surface water fluxes between terrestrial and aquatic environments.
The depth gradient of preservation we observed also indi-cates dissolution of ASi with depth. The results imply that wetland management and its impact on ASi storage in wet-lands, can consequently alter DSi available in the soil water. Export of water from the wetland to the aquatic environment mainly occurs as advective leakage to the river of soil water, especially during rain events, or through vertical leakage to the groundwater. As such, ASi dissolution probably controls export of DSi from the riparian habitat into the river system. In estuaries, wetlands are buffers in the silica cycle, export-ing Si after recyclexport-ing of buried ASi in times of Si-depletion (Struyf et al., 2006; Jacobs et al., 2008). Porewater DSi is the main source for the DSi export (Struyf et al., 2006). We sug-gest that a similar mechanism occurs in non-tidal wetlands.
5 Conclusions
An increasing number of studies now indicate that wetlands can form both sinks and sources for Si in river ecosys-tems (Struyf and Conley 2009). Our results show that rel-atively large variation in wetland ASi storage can occur on local, small spatial scales. We provide the first experimen-tal evidence that distance from the river and vegetation can significantly influence ASi dynamics within wetlands over small spatial scales. The relative importance of local hy-drology vs. allochtonous import of material could not be dis-tinguished in this study, as distance from the river could be directly linked to both (although the presented data suggest that groundwater hydrology is rather uniform over the whole site). Future work should further constrain and identify these factors. Our understanding of the importance of wetlands to riverine Si biogeochemistry and the transport of Si along the land-ocean continuum is growing. To improve our un-derstanding of both the sink and source functions, exchange studies in a variety of wetlands are a necessary prerequisite, as well as enhanced understanding of wetland Si dynamics. Our results indicate that vegetation and hydrology should be included as forcing factors in these studies. The importance of riverine Si transport in coastal productivity, where Si, N and P exhibit important controls on phytoplankton compo-sition and productivity, certainly warrants a scientific effort that would enable our understanding of Si biogeochemistry to increase to the level of understanding achieved for N and P cycling.
Acknowledgements. Eric Struyf and Daniel Conley acknowledge EU Marie Curie Actions (SWAMP MEIF-CT-2006-040534, COM-PACT MEXC-CT-2006-042718) for funding. Wout Opdekamp and Eric Struyf acknowledge FWO (Flemish Research Foundation) for funding their respective Ph.D. and postdoc grants. We would further like to acknowledge Crafoord foundation (Sweden) for funding our research. Fiona Franken was a great help during the vegetation mapping. We would like to thank all referees who commented on the manuscript.
Edited by: P. Van Cappellen
References
Asselman, N. E. M. and Middelkoop, H.: Floodplain Sedimentation – Quantities, Patterns and Processes, Earth Surf. Proc. Land, 20, 481–499, 1995.
Bartoli, F. and Souchier, B.: Cycle et rˆole du silicium d’origine v´eg´etable dans les ´ecosyst`emes forestiers temp´er´es, Ann Sci For 35, 187–202, 1978.
Bartoli F.: The biogeochemical cycle of silicon in two temperate forest ecosystems. Ecol. Bull., 35, 469–476, 1983.
Beckwith, R. S. and Reeve, R.: Studies on soluble silica in soils. The sorption of silicic acid by soils and minerals, Aust. J. Soil. Res., 1, 157–168, 1963.
Berner, R. A., Lasaga, A. C., and Garrels, R. M.: The carbonate-silicate geochemical cycle and its effect on atmospheric carbon dioxide over the past 100 million years, Am. J. Sci., 283, 641– 683, 1983.
Blecker, S. W., McCulley, R. L., Chadwick, O. A., and Kelly, E. F.: Biologic cycling of silica across a grassland bioclimosequence. Global Biogeochem Cycles, 20, GB3023, doi:10.1029/2006GB002690, 2006.
Clarke J.: The occurrence and significance of biogenic opal in the regolith. Earth Sci Rev, 60, 175–194, 2003.
Conley, D. J. and Schelske, C. L.: Biogenic silica, in: Tracking En-vironmental Change Using Lake Sediments: Biological Methods and Indicators, Smol, edited by: J. P., Birks, H. J. B., and Last, W. M., Kluwer Academic Press, 281–293, 2001.
Conley, D. J.: Terrestrial ecosystems and the global biogeo-chemical silica cycle, Global Biogeochem Cy., 16, GB1121, doi:10.1029/2002GB001894, 2002.
Derry, L. A., Kurtz, A. C., Ziegler, K., and Chadwick, O. A.: Bi-ological control of terrestrial silica cycling and export fluxes to watersheds, Nature, 433, 728–731, 2005.
Dugdale, R. C., Wilkerson, F. P., and Minas, H. J.: The role of a silicate pump in driving new production, Deep-Sea Res. Pt. I, 42, 697–719, 1995.
Epstein, E.: Silicon, Annual Rev. Plant Phys., 50, 641–664, 1999. Farmer, V. C., Delbos, E., and Miller, J. D.: The role of phytolith
formation and dissolution in controlling concentrations of silica in soil solutions and streams, Geoderma, 127, 71–79, 2005. Fulweiler R. W. and Nixon, S.: Terrestrial vegetation and the
sea-sonal cycle of dissolved silica in a southern New England coastal river, Biogeochemistry, 74, 115–130, 2005.
Gribsholt, B., Boschker, H. T. S, Struyf, E., Andersson, M., Tram-per, A., De Brabandere, L., Van Damme, S., Brion, N., Meire, P., Dehairs, F., Middelburg, J. J. and Heip, C.: Nitrogen process-ing in a tidal freshwater marsh: a whole ecosystem 15N labelprocess-ing study. Limnol Oceanogr, 50(6), 1945–1959, 2005
Gusewell, S. and Koerselman, M.: Variation in nitrogen and phos-phorus concentrations of wetland plants, Perspect Plant. Ecol., 5, 37–61, 2002.
Hattermann, F. F., Krysanova, V., Habeck, A., and Bronstert, A.: Integrating wetlands and riparian zones in river basin modelling. Ecol. Model., 199, 379–392, 2006.
Hodson, M. J., White, P. J., Mead, A., and Broadley, M. R.: Phylo-genetic variation in the silicon composition of plants, Ann. Bot.-London, 96, 1027–1046, 2005.
Jensen, J. E., Cooper, S. R., and Richardson, C. J. : Calibration of modern pollen along a nutrient gradient in Everglades Water Conservation Area-2A, Wetlands, 19, 675–688, 1999.
Kent, M. and Coker, P.: Vegetation Description and Analysis: a practical approach, Chichester, John Wiley & Sons Ltd, 363 pp., 1992.
Lanning, F. C. and Eleuterius, L. N.: Silica and ash in tissues of some plants growing in the coastal area of Mississippi, USA, Ann. Bot.-London, 56, 157–172, 1983.
Massey, F. P., Ennos, A. R., and Hartley, S. E.: Grasses and the resource availability hypothesis: the importance of silica-based defences, J. Ecol., 95, 414–424, 2007
Meunier, J.-D.: Biogenic silica storage in soils. Geology, 27, 835– 838, 1999.
Nychka, D.: FIELDS: Tools for spatial data, R package version 4.1, 2007.
Olde Venterink, H., Vermaat, J. E., Pronk, M., Wiegman, F., van der Lee, G. E. M., van den Hoorn, M. W., Higler, L., and Verhoeven, J. T. A.: Importance of sediment deposition and denitrification for nutrient retention in floodplain wetlands, Appl. Veg. Sci., 9, 163–174, 2006
R Development Core Team: R: A language and environment for statistical computing, R Foundation for Statistical Computing, Vienna, Austria, http://www.R-project.org, 2008.
Smayda, T. J.: Harmful algal blooms: Their ecophysiology and general relevance to phytoplankton blooms in the sea. Limnol Oceanogr, 42, 1137–1153, 1997.
Sommer, M., Kaczorek, D., Kuzyakov, Y., and Breuer, J.: Silicon pools and fluxes in soils and landscapes – a review (169, 310 pp., 2005), J. Plant. Nutr. Soil Sci., 169, 582–582, 2006.
Struyf, E., Van Damme, S., Gribsholt, B., Middelburg, J. J., and Meire, P.: Biogenic silica in freshwater marsh sediments and vegetation, Mar. Ecol. Prog. Ser., 303, 51–60, 2005
Struyf, E., Dausse, A., Van Damme, S., Bal, K., Gribsholt, B., Boschker, H. T. S., Middelburg, J. J., and Meire, P.: Tidal marshes and biogenic silica recycling at the land-sea interface, Limnol. Oceanogr., 51(2), 838–846, 2006.
Struyf, E., Temmerman, S., and Meire, P.: Dynamics of biogenic Si in freshwater tidal marshes: Si regeneration and retention in marsh sediments (Scheldt estuary), Biogeochemistry, 82, 41–53, 2007a.
Struyf E., Van Damme S., Gribsholt B., Bal K., Beauchard O., Mid-delburg J. J. and Meire P.:Phragmites australisand Si cycling in tidal wetlands, Aquat. Bot., 87, 134–140, 2007b.
Struyf, E. and Conley, D. J.: Silica, an essential nutrient in wetland biogeochemistry, Front. Ecol. Environ., 7(2), 88–94, 2009. Temmerman, S., Govers, G., Wartel, S., and Meire P.: Spatial and
temporal factors controlling short-term sedimentation in a salt and freshwateter tidal marsh, Scheldt estuary, Belgium, South-West Netherlands, Earth Surf. Proc. Land, 28, 739–755, 2003. Van Cappellen, P.: Biomineralization and global biogeochemical
cycles, Rev. Mineral Geochem., 54, 357–381, 2003.