Security Metrics and Software Development Progression
Smriti Jain*, Maya Ingle**
*(Department of Computer Science, SJHSGICCS, Indore, India)
** (School of Computer Science and IT, Devi Ahilya Vishwavidhyala, Indore, India)
ABSTRACT
The quantitative assessment of security can help to analyze security qualitatively. The phase-wise discussion of security metrics provides a roadmap to the developers to estimate software security during various stages of software development. In this paper, we suggest metrics based on security issues of software development process. Further, we provide effectiveness factors for the security consideration during the development process. Case studies illustrate the use and importance of suggested metrics and effectiveness factors. The metrics developed may help the developers to understand and analyze security efforts throughout the software development process.
Keywords
–
effectiveness factor, security metrics, software development processI.
INTRODUCTION
Measuring security plays an important role in order to mitigate vulnerabilities thereby producing more secured end product. Primary goal of metrics is to quantify data that facilitates insight towards some quality parameter of the software product [1]. Security metrics can be used for assessing security related (im)perfections introduced during software development process [2]. Metrics serve as a basis for software project planning and are also beneficial for organizing, controlling and improving the software development activities [3]. It can be used for decision support, especially in assessment and prediction regarding the quality of the software [4]. Thus, security metrics helps to monitor the performance and identify the failure points or anomalies in a software system. It supports effective decision making regarding securing a system. It serves as a basis to state the degree of safety to avoid imminent danger.
Most of the security metrics may act as a support for assessing security at the system level. Some of the metrics are incident management, vulnerability management, patch management, application security, configuration management, and financial management [5]. The defect rate metrics for the software product is calculated over a time period. It shall help improve the code quality during the next release of the software product [6]. NISTIR-7502 describes the Common Configuration Scoring System (CCSS), a set of standardized measures for the characteristics and impacts of software security configuration issues [8]. Some of these metrics either require full system implementation before assessing the security of the system while others can assess security during later stages of system development.
Metrics may assist in evaluating the software artifacts and promote security
considerations during early stages of Software Development Process (SDP). A number of security metrics have been defined for development process of a Web application that fall in the category of design time metrics, run time metrics, and deployment time metrics [9]. Security metrics for testing phase of Web based applications include Test Plan Coverage, Test Case Defect Density, Requirement Volatility, Defect Removal Effectiveness, Testing efficiency, etc. [7]. A set of metrics have been defined that address security risks throughout SDP such as Ratio of Security requirements, Ratio of design decisions using Goal/ Question/ Metric method [10]. Various available security metrics have been discussed and analyzed for secured SDP as well as product security [12]. Literature review reveals that most of the metrics either describes the security aspect of the software, assess only security risks, or focus on some stage of SDP. The current practice of security metrics is a very diverse field and hence widely accepted metrics are still missing. Moreover, the metrics do not address the security issues of the various stages of SDP. In this regard, we propose some proactive metrics to address all the stages of SDP. To judge the security efforts of the development team, we have suggested effectiveness factors for some of the SDP stages.
II.
P
ROPOSEDS
ECURITYM
ETRICSA
NDE
FFECTIVENESSF
ACTORIn this section, we propose security metrics that focus on security issues of the software development stages. Based on the security metrics, we also attempt to develop Effectiveness Factor (EF) for the software development phases. EF can help judge the security efforts during development. On the basis of security metrics, we collected data for fifteen live software projects using self designed questionnaire. These projects have been developed using platforms such as Java, PHP, .NET, MySQL, C#, AJAX, Jquery, Microsoft SSRS, Unix shell script etc. The implementation relate to various network designs such as client/ server system, web technology, web sites, mobile and desktop based systems. The size of projects may vary from small to very large.
2.1 Requirements Gathering and Analysis (Phase I)
This phase focuses on gathering security requirements along with the functional requirements. The security requirements can be gathered from the stakeholders by the help of misuse cases, attack trees etc. [14]. In this section we discuss security metrics of requirements gathering stage and the effectiveness factor.
2.1.1 Phase I Metrics
The metrics of this phase measures the impact of security considerations on software development. The metrics defined are direct measures and are internal performance indicators.
Number of Security Requirements Gathered (NSRG) – It measures the number of security requirements gathered during Phase I. It consists of security requirements that may be gathered using tools such as SQUARE as well as from the stakeholders using Software Security Requirements Gathering Instrument (SSRGI) [13]. If SR and TR denote security requirements from stakeholders and tools respectively, then
TR SR NSRG
Security Requirements Recorded Deviations (SRRD) – It describes the number of deviations from security requirements. The deviations can be measured on the basis of requirements specifications considered during design.
Security Requirements stage Security Errors (SRSE) – The metric SRSE indicates the number of security errors that are result of incorrect or incomplete security requirements.
Security Requirements Gathering Indicators (SRI) – Indicators on Requirements gathering and analysis stage explain the impact of security requirements on number of security breaches.
2.1.2 Phase I EF
The security efforts of the development team of requirements gathering stage can be evaluated by identifying and establishing the relationship between the metrics.
Let there exists one independent metrics X and n number of dependent metrics as y1, y2,… ,yn. Y be
the sum of all n metrics representing total effect by independent metric X. Applying Least Square Method to identify the relationship, we get
Y = C - α·X --- (1) where, C is constant and is calculated as sum of intercepts generated for each pair of metric. α is the EF of X on Y and can be computed from Equation 1.
α = (C-Y)/X --- (2) The domain of Phase I metrics consists of independent and dependent metrics. Based on practicality, the dependent metrics may consist of SRRD, SRSE and SRI while NSRG may be considered as independent metric.
The value of constant C is obtained using Equation 1 for the metrics pair NSRG and SRRD, NSRD and SRSE, NSRG and SRI. The combined effect of independent variable X (NSRG) on dependent variable Y (sum of SRRD, SRSE and SRI) can be expressed as
α = (5.β4β1 – Y)/ NSRG --- (3) where NSRG≠ 0
EF of -1 may reveal that the entire SDP may not have considered security. Zero EF may entail the sum of dependent metrics Y equals C while X can take any value. It shows that the security deviations from requirements and errors are recorded even though security requirements are not gathered,
leading to trivial situation. α as one may occur when
Y=C-X. This may also lead to trivial case when the numbers of security requirements gathered are high as Y may acquire negative value. The value of EF greater than 1 implies that X is very less and thus the effectiveness of the metrics cannot be judged.
2.2 Software Design (Phase II)
To enhance security in the design , the design stage should consider Non-functional Security Requirements (NFSR), security aspects, exceptions handling and error messages as well as identification and authorization of users [13][14]. The following subsections demonstrate the metrics and effectiveness factor of software design stage.
2.2.1 Phase II Metrics
Requirements and design are indispensable phases of SDP. Hence, requirements specifications shall be considered for design proposal and analysis of design generates the need for further requirements [15].
Security Requirements Statistics (SRS) – The
requirements gathered reflected in the design stage. If NSRD is Number of Security Requirements considered for Design, SRS can be
defined as the ratio of NSRD and NSRG expressed as percentage.
Design Tools and Test Effectiveness (DTTE) – The design can be analyzed for security using tools such as misuse cases, threat analysis, attack patterns etc. These tools can also be used to consider security requirements. This can be represented by Secure Analysis of Design by Tools (SADT). Further, the use of test cases to analyze secured design aspects is indicated by Number of Test Cases for Secured System Design (NTSSD). The Number of Aspects for Secured Design (NASD) represents the security driven aspects. It designates the design aspects considered from architectural design requirements and implicit requirements such as exception handling, input validation, authenticity checks etc. Thus, NASD can be expressed as sum of Number of Aspects using architectural Design Standards (NADStd), Number of Implicit Security Design Aspects (NISDA) and NSRD. Here, NISDA consists of implicit security requirements such as exception handling, input validations, check for authentication etc. The metric DTTE is represented as ratio of the sum of tools to analyze security and NASD i.e. DTTE = (SADT+NTSSD)/NASD where NASD ≠ 0. or,
) (
)
(SADT NTSSD NADStd NISDA NSRD
DTTE
Number of Design stage Security Errors (NDSE)
– It is indicated by measuring the number of security errors due to design stage. The metric specifies the design flaws that owe to the negligence of security by the software development team.
2.2.2 Phase II EF
On the basis of paired t-test, relationship has been has been indicated among the metrics DTTE is NDSE. The metrics pair is further evaluated resulting in negative correlation. Thus, the metrics DTTE and NDSE are inversely proportional i.e. NDSE α 1/DTTE. Then, NDSE= /DTTE
or =NDSE · DTTE --- (4)
here is the effectiveness of design stage where
>= 0. = 0 implies that the testing is highly effective
and there are no security errors due to design stage.
As evident from Equation 4, the value for shall lie
between 0 and 1. It can be interpreted as highly effective (0-0.25), moderately effective (0.26-0.50), effective (0.51-0.75), ineffective (0.75-1.00) and very ineffective (>1.00) security considerations during design stage.
2.3 Coding (Phase III)
During coding phase, security can be implemented by validating input, output, reused code, following good programming practices and coding standards. The metrics and effectiveness factor of this stage are discussed in the following subsections.
2.3.1 Phase III Metrics
Coding phase metrics can help judge the secure coding efforts of the developers. It shall indicate the use of secure coding aspects and standards thereby identify the security errors.
Percent of Secure Coding Aspects (PSCA) – The metric identifies the percentage of security aspects considered during coding as per the design. The security coding aspects can be derived from Secure Development Requirements (SDR) [13]. PSCA can be represented as the ratio of Number of Security Coding Aspects (NSCA) and NASD expressed in percentage.
Percent use of Coding Standards (PCS) – The metric indicates the use of coding standards for secured development. It may act as an estimate for the metric Number of Security Errors (NSE). It shall support in identifying the consideration of security standards during code implementation.
Numbers of Security Errors (NSE) – The coding errors are the result of the use of unsafe functions, illogical access control, typographical errors etc. Errors are also due to code used from other libraries [14]. NSE represents the flaws that can be expressed as the sum of coding errors and errors due to code from other libraries thereby identifying the trustworthiness of the code.
2.3.2 Phase III EF
By applying paired t-test, it has been established that NSE is the result of considering PSCA and NSE. Variable X (sum of PSCA and PCS) is an independent variable while dependent variable Y is NSE. Thus, applying Least Square Method on X and Y to establish relation between X and Y, we get Y = C - ·X where, C is constant and is effectiveness of PSCA and PCS on NSE. can be calculated as
= (C-Y)/X --- (5) where, X>0
Using Equation 5, the combined effect of PSCA and PCS on NSE is given by
metrics PACS and PCS. EF as one may signify that Y = C-X, i.e. number of independent metrics should be less that 8.4. It also tells that if X increases, then Y decreases. Lower value of Y may indicate that security is considered from design aspects as well as security coding standards.
2.4 System Integration and Testing (Phase IV) Testing the software for security is aimed to check if the software meets the specified security requirements, and the left security vulnerabilities.
2.4.1 Phase IV Metrics
The metrics of this phase shall help in determining the effectiveness of security testing as well as consideration of security requirements considered during testing
Security Requirements Considered for Testing (SRT) – It shows the development of software system as per the security requirements being gathered. The metric SRT can be represented by the ratio of the security requirements tested and
NSRG, where NSRG ≠ 0. If all the security requirements have been tested, it may be indicated by one.
Process Effectiveness (PE) – The metric may reveal the security concerns during SDP. It can be evaluated as the ratio between the Numbers of security vulnerabilities discovered (NVD) and
Count of Modules undergone security testing (MST) i.e. PE = NVD / MST , where MST ≠ 0.
Security Testing Ratio (STR) – It can be expressed as the ratio of modules undergone security testing to the total number of modules. STR may support in judging the modules subject to security testing.
2.4.2 Phase IV EF
The paired t-test indicates that the metric PE is not determined by STR and SRT thus, EF cannot be judged.
2.5 Operations and Maintenance (Phase V) During operations and maintenance phase, a number of security flaws can creep in due to the changes in the system or environment. Periodic risk review and vulnerability assessments, security awareness programs, performing auditing, logging, monitoring, archiving can reduce security related flaws.
2.5.1 Phase V Metrics
The proposed metrics of this phase may help to ensure that the changes are completed within time; the threats found are taken care of, and help in the awareness of new vulnerabilities.
Mean Time to Complete Security Changes (MTCSC) - The metric MTCSC can be
estimated by the number of security failures and mean time taken to repair the flaws. Thus, it provides an indication regarding failure of system due to security flaws. MTTSF and MTTR are obtained as average of all security related failure of a system and time taken to repair the failure [16]. The metric is recorded over certain time period and may support in risk assessment.
MTCSC = MTTSF + MTTR
where MTTSF is Mean Time to Security Failure MTTR is Mean time to Repair
Percent of Changes with Security Exceptions (PCSE) – The metric PCSE indicates the percentage of configuration or system changes that received an exception to existing security policy [17]. The metric can be calculated as the ratio of counts of completed changes with security exceptions and completed changes multiplied by 100. It depicts security concerns during the maintenance phase.
Rate of Vulnerability Assessments (RVA) – RVA can be expressed as the number of vulnerability assessments during one quarter. It indicates the number of security reviews performed by the development team in a specific time period.
Ratio of changes due to security consideration (Rsc) - It measures the number of changes in the system requirements due to new set of security requirements including the need for system patches [10]. It has been defined as the number of changes triggered by new security requirements / The number of changes of the entire system.
2.5.2 Phase V EF
The effectiveness factor cannot be judged among the metrics. It has been indicated by applying paired t-test between PCSE and Rsc.
2.6 Documentation (Phase VI)
The document must state the security controls implemented in the software system for its proper functioning. It must also state the responsibilities of the various users along with the functional and non-functional security features.
Number of Security Controls Mentioned (NSCM) – The metric NSCM indicates the number of security controls implemented in the software such as access control, disable inactive accounts automatically, account recovery method, etc. The value of NSCM helps to identify the security controls being implemented.
III.
C
ASES
TUDIEShelp of the metrics and effectiveness factors developed in Section 2. The case studies are based on web, client/ server, and single user desktop system.
Case I - Web-based System
Journal Publishing System (JPS) is a Web-based publishing system designed for scholarly researchers worldwide. The system is intended for the researchers, scholars, institutions and other interested users. It is designed to assist editors by automating the article submission by contributors, article review and publishing process thereby maximizing efficiency. It facilitates communication between editors, authors and reviewers via E-mail and preformatted reply forms. The system maintains database of the subscribers, editors, reviewers, article submitted, accepted, rejected and published. JPS accepts the article online and forward it to the reviewers according to the area of interest. Based on the feedback from the reviewers, the contributor is informed regarding acceptance or rejection of the article. If accepted, JPS accepts camera ready copy of the article along with the publication fee and publishes the article in next issue. The publication fee can be accepted through Visa/ Master card using online system, swift transfer or DD/ Cheque. JPS is a Red Hat Linux EL4 based system developed using PHP 5.x and above with database MySQL 5.x on
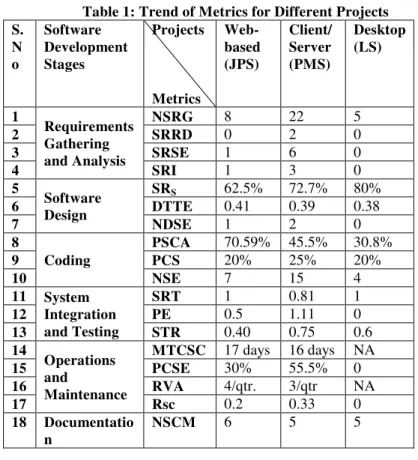
Apache 2.x server. The measures and metrics of SDP stages for JPS are depicted in Table 1.
Case 2 - Client/ Server based System
Patient Management System (PMS) is a client/ server based system implemented on LAN that allows the hospitals to keep track of the patient’s data. It aids in the management of personalized patient record, physicians, and other hospital staff. The system registers patients, doctors, nurses, social workers, and dieticians. It supports internal messaging among various users. It allows generating the list of patients with their ailments, medications and test reports (if suggested), and the doctor and nurses in-charge of the same. The system also permits to view the case history of the patients and fix appointment with the doctor. JPS generates reports on birth and death records, diagnosis of patients with medicines, billing and payment. The system is developed using .NET Framework with SQL Server 2008 Express as database software. The metrics for PMS are presented in Table 1.
Case 3 - Desktop based System
Learning System (LS) is a desktop based system having a set of innovative educational applications for students, teachers and educators.
Table 1: Trend of Metrics for Different Projects S.
N o
Software Development Stages
Projects
Metrics
Web- based (JPS)
Client/ Server (PMS)
Desktop (LS)
1
Requirements Gathering and Analysis
NSRG 8 22 5
2 SRRD 0 2 0
3 SRSE 1 6 0
4 SRI 1 3 0
5
Software Design
SRS 62.5% 72.7% 80%
6 DTTE 0.41 0.39 0.38
7 NDSE 1 2 0
8
Coding
PSCA 70.59% 45.5% 30.8%
9 PCS 20% 25% 20%
10 NSE 7 15 4
11 System Integration and Testing
SRT 1 0.81 1
12 PE 0.5 1.11 0
13 STR 0.40 0.75 0.6
14
Operations and
Maintenance
MTCSC 17 days 16 days NA
15 PCSE 30% 55.5% 0
16 RVA 4/qtr. 3/qtr NA
17 Rsc 0.2 0.33 0
18 Documentatio n
These applications are classified into various categories such as Create, Collaborate, Teach, Research etc. The application can be used in different languages. LS is developed using .NET platform. The metrics for Learning System are illustrated in Table 1.
IV.
R
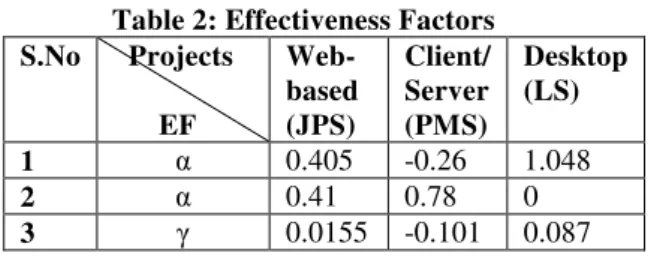
ESULTSThe trend of metrics for the various case studies is depicted in Table 1 while the effectiveness factors are illustrated in Table2. On the basis of the case studies following observations can be made: The α value shows moderate security
considerations during the development of web-based software. This is inline with the fact that security is a major issue in web-based systems. The value for desktop based system signifies
that no security errors have been detected in its design.
In a web-based, client/ server and desktop based
systems, the values indicate that the coding
errors are low in these systems as compared to client/ server based system. The values may be the result of the coding errors. This might be due to low experienced software professionals in the area of secured coding.
Operations and maintenance phase metric PCSE implies that the out of all changes expected in a web-based system, only 30% have been related to security policies. It shows moderately high security concerns during earlier stages of software development resulting in less security exceptions.
Low documentation of security related issues have been depicted for all types of systems (refer Table 1).
Although NSRG is high for PMS, security is not given enough consideration during the other stages of software development.
V.
C
ONCLUSIONRapid advancements in security related issues have facilitated the development of security metrics. Security metrics have become the foundation for secured development process of software. Right metrics serve to diagnose problems easily and locate the vulnerable points. In this paper, we presented a set of metrics and effectiveness factors for the software development stages. The metrics aims to evaluate the efforts of the various software development stages regarding security consideration. The metrics can help the development team to judge its performance for security. It may facilitate to focus on gathering more security requirements, consider more of implicit security aspects, provide security training to the development team to help reduce design and coding flaws etc. Metrics may also act as a checklist for increasing security aspect of the software product, i.e. what variables should be
Table 2: Effectiveness Factors S.No Projects
EF
Web- based (JPS)
Client/ Server (PMS)
Desktop (LS) 1 α 0.405 -0.26 1.048
2 α 0.41 0.78 0
3 0.0155 -0.101 0.087 focused to enhance security. It shall support the developers to improve SDP and may help to predict vulnerability of the software. Thus, the developed metrics and effectiveness factors may provide a way to assess and visualize security during software development process.
R
EFERENCES[1] A. Jaquith, Security metrics: Replacing fear, uncertainty, and doubt (Upper Saddle River, NJ, Pearson Education, Inc., 2007).
[2] I. Chawdhury, B. Chan, and M. Zulkernine, Security metrics for source code structures, SESS’08, ACM, May 17-18, 2008, 57-64. [3] Software metrics guide,
http://sunset.usc.edu/classes/cs577b_2001/m etricsguide/metrics.html#p1.
[4] R. Savola, A novel security metrics taxonomy for R&D organizations, ISSA ’08, Johannesburg, South Africa, Jul. 7-9, 2008, 379-390.
[5] Clare E. Nelson, Security metrics – An
overview, ISSA Journal, Aug. 2010, 12-18. [6] S. H. Kan, Software quality metrics
overview Metrics and models in software quality Engineering (Addison-Wesley Professional, Second Ed., 2002).
[7] Software test metrics (QCon – Train, Consult, Improve), www.qcon.in/simple% 20metrics.ppt.
[8] K. Scarfone and P.Mell, The common scoring configuration system: Metrics for software security configuration vulnerabilities (National Institute of Standards and Technology, NISTIR-7502). [9] E. A. Nichols, G. Peterson, A metrics
framework to drive application security improvement, Building Security In, IEEE Security and Privacy, 2007, 88-91. [10] K. Sultan, A. En-Nouaary, A.H. Lhadj,
Catalog of metrics for assessing security risks of software throughout the software development life cycle, In the Proc. of International Conference on Information Security and Assurance, IEEE Computer Society, 2008, 461-465.
[12] S. Jain and M. Ingle, A review of security metrics in software development process, International Journal of Computer Science and Information Technologies, 2(6), 2011, 2627-2631.
[13] S. Jain and M. Ingle, Software security requirements gathering instrument, International Journal of Advanced Computer Science and Applications, 2(7), 2011, 116-121.
[14] S. Jain and M. Ingle, Involving security in software development process – A suggestive view, In theProc. of theNational Conference on Emerging Technologies Electronics, Mechanical and Computer Engineering, Indore, India, 2010.
[15] B.A. Nuseibeh, Weaving together requirements and architectures, IEEE Computer, 34(3), 2001, 115-117.
[16] R. S. Pressman, Software engineering: A practitioner’s approach, (McGraw Hill, 5th Ed., 2001).
[17] The CIS Security Metrics, (Center for Internet Security, 2009), http://www.letu.Ed