Are assortment variety and stock-failures management in Hypermarkets
and Supermarkets an important factor for consumers to develop a
store-type preference, willing to come back and continue to buy?
Faria, Sílvia
Universidade Lusíada - Norte, Portugal
Ferreira, Pedro
Universidade Lusíada - Norte, Portugal
Carvalho, Vitor
IPAM - The Marketing School,
Portugal
Abstract
The purpose of this paper is to examine the customer experience towards the two main retail types of point of sale in Portugal and what leads them to choose between Hypermarkets and Supermarkets.
A model was developed through the formulation of some hypotheses, as a result of the literature review on related concepts; the data mentioned in this paper was obtained by a questionnaire applied online to 116 individuals.
The data collected allow us to say that people that prefer to have a huge variety of products and brands tend to go to Hypermarkets and that the higher the positive perception about layout (capacity to avoid breaks (failures of products on shelves) and good products and brands’ exhibition)) the higher the preference for Hypermarkets; the more people prefer variety, the less they go to Supermarkets and, if there is a lot of information about products and brands, associated to an also careless presentation and exaggeration of products / brands on shelves, it leads consumers to feel confused… and then they will prefer to go to supermarkets.
Considering the results obtained with our sample we may say that both hypermarkets and supermarkets’ clients do not want to come across products failures on shelves (BREAKS); however, according to our sample, it seems that consumers associate a better category management to hypermarkets (since this has a positive impact in choosing this type of store).
Keywords: Consumer behaviour, Commitment, Retail, Merchandising
assortment, Category management, Breaks, Layout
Resumo
O objetivo deste artigo é examinar a experiência do consumidor nos dois principais tipos de ponto de venda de bens de conveniência em Portugal e o que os leva a escolher entre o formato Hipermercado e Supermercado? Foi desenvolvido um modelo e procedeu-se à criação de algumas hipóteses, em resultado da revisão bibliográfica efetuada a vários termos e diferentes expressões relacionados com o setor em análise; os dados obtidos neste artigo foram conseguidos através da aplicação de um questionário online para um total de 116 indivíduos.
Os elementos recolhidos permitem-nos dizer que os indivíduos que preferem ter uma grande variedade de produtos e marcas, tendem a fazer as suas compras em Hipermercados e, ainda, que quanto maior for a perceção positiva sobre o layout (capacidade de evitar ruturas (falhas de produtos nas prateleiras) e uma boa exposição dos produtos e marcas), maior a preferência por Hipermercados; quanto mais os indivíduos preferem variedade, menos irão aos Supermercados e, se existir demasiada informação sobre produtos e marcas, a par de uma apresentação pouco cuidada e de um exagero de produtos/marcas nas prateleiras, o consumidor sente-se confuso… pelo que irá preferir fazer as suas compras em Supermercados.
Considerando os resultados obtidos com a nossa amostra podemos dizer que, tanto os clientes dos Hipermercados, quanto os dos supermercados, não pretendem deparar-se com falhas de produto em linear (BREAKS); de acordo com a nossa amostra, parece-nos que o consumidor associa uma maior capacidade de gestão de categoria às lojas de formato Hipermercado (uma vez que isto tem um impacto positivo na escolha pelo tipo de ponto de venda.
Palavras-chave: Comportamento do consumidor, Compromisso, Retalho,
1. Introduction
Consumer behavior has changed significantly in regard to the choice of what is purchased, where, when and how; the evolution and changes in consumer habits are closely related to the appearance of new technologies and the way the consumer chooses to purchase.
Nowadays, consumer goods are not only products made available in the marketplace to attract attention, to be purchased, to be used and consumed in order to satisfy a need or desire (Kotler & Armstrong, 2006), but companies’ goal is to exceed expectations and to create (positive) emotions in the consumer (Kotler et al., 2011).
The present study focuses on the two main types of point of sale in the Portuguese modern distribution - hypermarkets and supermarkets- and the different ways they use to communicate with customers as far as showing products and brands is concerned; this appears to have a considerable influence in the capacity to attract customers who, very often, end up adopting behaviors that are unconsciously affected by these techniques (picking situations).
Communication is essential in retail, inside and outside the store; the store location, combined with the variety of products and brands and their exposure are factors that overwhelmingly influences the consumer’s decision to visit and willing to come back (Rousseau, 2008). Retailers should always bear in mind that their customers’ satisfaction and commitment are keywords to their own success, therefore, these two concepts must always be considered in management politics and decisions (Kumar et al., 2016; Messaoud & Deboki, 2016); the current crisis environment highly influences consumer choices and sets very clear rules regarding their consumption habits and restrictions (Diallo & Kaswengi, 2016) and, as a consequence, International and/or Portuguese companies must adapt to new realities and trends.
After a qualitative research, we decided to develop a questionnaire to directly ask the final consumers their intentions towards shopping in the future; in a precise way, how product exposure and categories’ management contributes to positive or negative perceptions and, consequently, to their commitment to the point of sale and decision towards the type of store (eventually becoming loyal to the point of sale).
2. Literature Review 2.1. Category Management
It seems that consumers tend to evaluate in a positive way the existence of an adequate portfolio of products and brands inside an hypermarket or supermarket, according to the store’s positioning and its actual and potential clients (Manolis et al., 1994; Fox et al., 2002; Chernev, 2003; Daskalopoulou & Petro, 2005; Cachon & Kök, 2007; Briesch et al., 2009; Chernev & Hamilton, 2009; Coghan & Shaffer, 2009; Hamilton & Richards, 2009; Sela et al., 2009; Faria et al., 2012); this category management shall not be considered as a static process, but it must be constantly adapted to the clients’ needs and desires (Kotler & Armstrong, 2006; Rousseau, 2008; Faria et al., 2012). Despite considering this general and well accepted idea, it is also important to admit the unquestionable positive contribution of a careful merchandising assortment to the store ‘success and competitiveness through time (Cachon & Kök, 2007; Mantrala et al., 2009; Faria et al., 2012; Kumar et al., 2017); we may consider seasonable promotional actions (ex.: Coffee Fair) and its direct repercussion on the assortment itself (Beirão, 2004; Zezone & Buairide, 2005; Rousseau, 2016; Silva, 2009; Faria et al., 2012) and also the need to constantly surprise the consumer (ex.: Headers; Chimneys; Palettes; Islands; Loyalty Card Actions), giving more visual impact and buying conditions to products that didn’t have that before (Beirão, 2004; Zezone & Buairide, 2005; Rousseau, 2008; Silva, 2009; Faria, 2012).
When a store chooses to offer a considerable variety of products and brands, it must help consumers to choose the most suitable ones (Theodoras & Moschuris, 2005; Faria et al., 2012). In other words, when a client finds the time required to search for reduced
information he/she also feels less doubtful about the benefits regarding a particular product or brand and, consequently, feels less risk associated to buying in that point of sale, developing positive perceptions (Cachon & Kök, 2007).
The main concern of a store’s manager, according to some authors (Huffman & Kahn, 1998; Simonson, 1999; Cachon & Kök, 2007), is to decide between a higher or smaller variety of products and brands (Faria et al., 2012). Kök & Fisher, 2004 in Cachon & Kök (2007) found that the stores may decide to use management models to organize the merchandising assortment (eg.: CM, ACNielsen, 1999), believing that the variety of products and brands, as well as the variety of prices, influences in a certain way the number of visitors (people influx) but it may not influence in the choice for a certain point of sale.
Having this in mind, distributors choose to offer an “efficient product range”, meaning, to have on shelves those products/brands that give them the higher profit margins (Cachon & Kök, 2007); we’re considering a financial management criterion that leads the departments’ responsible to decrease the number of facings of less profitable or sold products in order to get the maximum profitability of the available space. This management strategy may provoke a considerable reduction on the variety of products/brands per category and, consequently, the store may become a less attractive place for the clients, that may decide to go to another one (Huffman & Kahn, 1998; Simonson, 1999; Cachon & Kök, 2007; Faria, 2012). This has higher probabilities of happening at the type of stores we are considering in this work: hyper and supermarkets, places where to buy mass consumption goods (Cachon & Kök, 2007; Faria et al., 2012).
2.2. The Shelves Break through Time
“At the retail level, the principal difficulty in measuring the cost of a stock out is that it differs as a function of the consumer’s response to the stock out. Consumers may decide to (1) substitute the item they sought; (2) delay the purchase or (3) leave the store and either forgot the purchase or search for the item elsewhere. In the long run, stock outs may also affect future patronage of the store, either by the same consumer or by others influenced by negative word-of-mouth. Understanding the consumers’ reaction to retail stock outs will ultimately lead to better merchandising and inventory management policies” (Zinn & Liu, 2001, p. 49).
The shelf is the scope or boundary formed by the front faces of gondolas, furniture and product display in a store (Rousseau, 2008). To each product a certain space is allocated, which can be measured in centimeters or number of facings, that are nothing more and nothing else than the products’ units visible to the consumer at the forefront of the rack exposure (Rousseau, 2008). The Shelf’s function is to show the products and attract the consumers’ attention, leading them to buy and, somehow, “talking” with the client through a pleasant disposition and ordered products, with proper lighting, visibility and easy access (Faria et al., 2012).
“… we only buy what we see” (Rousseau, 2008, p. 220) and, therefore, a minimum of faces on shelves are needed in order to cause sales (or the product will become invisible to the clients); in other words, there is a minimum number of faces for the products to be noticed – three, per product – and/or racks with 20 inches (Rousseau, 2008). All these procedures and rules, already tested in different stores, make it easier to understand the need for adopting an assertive POS management, avoiding any situation of ruptures/failures (Zinn & Liu, 2001; Cachon & Kök, 2007; Rousseau, 2008; Faria et al., 2012).
This careful planning is a shared responsibility of the Distributor and the Producer/Supplier; the latter must visit in a periodic way all the stores where the products are exposed and always inform the Store’s manager in case of failures (BREAKS). A product disruption at a store (OOS) may lead the consumer to feel uncomfortable and bored for not being able to satisfy a need or desire (Zinn & Liu, 2001; Cachon & Kök, 2007; Silva, 2009; Yu, 2009); therefore, the consumer may decide to go and buy in another store (Bell & Latin, 1998 in Cachon & Kök, 2007; Zin & Liu, 2001; Silva, 2009; Faria et al., 2012). In a study developed by Yu (2009), it was possible to see that: a significant number of clients may stop going to a certain store, when facing a product failure, deciding to start
shopping in another one; an also considerable number of clients may decide to come back later on and, if the failure continues, end up developing negative perceptions and feelings toward the store; some consumers may decide to buy other products or brands (ex.: less profitable for the store) or even, substitute products (less profit and negative perceptions, both to the store and to the supplier); consumers better informed may ask the store’s responsibility for product replacement, creating a negative evaluation of its efficiency (Silva, 2009).
Zinn and Liu (2001), therefore, argue that estimating the real cost of a product failure on shelves should consider both tangible and intangible consequences (in Faria et al., 2012). If the tangible aspects are very easy to calculate – fewer margins per article, less sells-, the intangible aspects creates more doubts and, therefore, demands for a hard and complex task; as already mentioned, disruptions may create different decisions and thoughts in the consumers’ minds and provoke negative comments - word of mouth. Richins (1995) proved that each negative experience, at a (physical) point of sale, creates 11 more comments than a positive one. The negative impact will be higher if a second or more situations of disruptions occur and are noticed by the client, regardless of being with the same product/brand or not; this will certainly increase the probability of clients ‘changing store (Zinn & Liu, 2001). For a long period of time, some studies were developed in order to verify the real consequences of product failures on retail; despite the first studies pointing out just to a decrease on profit (margins), as a result of a non-sell (Zinn & Liu, 2001), already in 1976 Charlton and Ehrenberg decided to apply a qualitative research intending to understand the real effects of product failures in the consumers’ minds (in Faria et al., 2012). For app. 25 weeks a total of 158 consumers were asked to authorize a group of researchers to film and analyze their regular shopping trips for detergents and tea; the participants were asked by the researchers to consider buying just one of three pre-established brands (detergent and tea), in order to reduce options and consequent data interpretation (brands previously defined by the research conductors, in order to allow homogenous options and possible extrapolation). Disruption situations were created in the visited stores and the reactions were measured; most of the clients decided to choose another brand and, in a future buying situation, once the stock was ok, they went back to buy the initial brand/choice. Possible conclusion: facing a failure on a certain product/brand, consumers try to satisfy their need by choosing another similar product. This study, however, did not consider changing the point of sale (Faria et al., 2012).
Schary and Cristopher (1979) also developed a study in England, this time using beers and creating the conditions for consumers to consider changing store. They’ve concluded that there were some behavior differences among individuals according to their age and job occupation; for example, families with the householder having management or direction functions at a company revealed a high willingness to change store and, by acting this way, to be able to satisfy the initial need and get the product and brand they were wishing to buy.
No matter the behavior itself, we may sat that, according to a considerable number of studies developed and investigated by authors, a product failure (no stock despite having a space on the shelve) is always a negative experience with a negative impact for all (suppliers, distributors and final clients) and, therefore, must be avoided by any point of sale (Zinn & Liu, 2001; Cachon & Kök, 2007; Yu, 2009, among others).
2.3. The Importance of Offer Variety
“Consumers rank variety of assortment right behind location and price when naming reasons they patronize their favorite stores. Consumers care about variety because they are more likely to find what they want when going to a store that offers more varied assortments” (Hoch et al., 1999, p. 527).
For a significant number of consumers, stock variety is a very important factor and a perceived element of differentiation when they decide for a certain point of sale (Bronigrezyk et al., 1998; Rojo, 1998). It seems to be consensual that consumers like to find at the
stores they decided to visit a certain number of brands they recognize and trust and that this acts as a crucial condition to make them wish to return (Manolis et al., 1994; Balakrishnan, 2008; Mantrala et al., 2009).
Main issue to bear in mind: no consumer buys if he/she doesn’t feel motivated. Felisoli (1999) and Parente (2000), in Magalhães and Borges (2008), state that distributors have to carefully manage their product mix if they want to have their market segment satisfied and capable to find the products and brands they were expecting to; that’s the only way to avoid negative feelings and make them wish to return (Kumar et al., 2016; Messaoud & Deboki, 2016). However, to manage the product assortment is the result of a careful observation of the clients’ behavior, the products’ turnover on shelves and the profit they grant towards the category and to the store itself (Zinn & Liu, 2001; Balakrishnan et al., 2008; Simpson et al., 2008; Gupta et al., 2009). Kahn (2016) highlights the need to carefully think through the spatial positioning of merchandise and guarantee that each item presented relates to the assortment context: everything to make it easier for the consumer to buy and decide.
Any time the products’ offer strategy is defined, based on the variety of brands and products per category, the Distributor knows, on the one hand, that introducing novelties, in a periodic way, demands for the right evaluation about the real benefits they will bring to clients. On the other hand, also taking off some products with fewer sales must be considered, so that assortment management leads to more profit and to the proper use of the physical space available, while satisfying the clients’ expectations. Decisions concerning increasing the variety of offer must be supported by carefully studying the consumers’ behavior – the store’ clients – and, also, the competitors’ attitudes (Messaoud & Deboki, 2016).
As far as products’ assortment is concerned, literature on marketing states that offering a considerable variety has a positive and unquestionable benefit on the final consumer (Chernev, 2003; Messaoud & Deboki, 2016), since it reduces monotony in the buying process and allows the individual to feel that he is in control of the process itself: no matter the criterions chosen, the client has the final decision on what to buy in order to satisfy a need or desire (Faria, 2012).
A lot of studies were developed in the last years, trying to understand if, in fact, brands and products variety induces more positive or negative feelings. Some authors concluded that a higher variety of brands and products may lead the client to negative feelings, due to some confusion and difficulty to choose (Manolis et al., 1994); other studies seem to prove that the majority of consumers base their buying decision upon a maximum of 3 or 4 brands per category (Ehrenberg et al., 1990; Uncless et al., 1995).
Foxall and Schrezenmaier (2004) developed a study on the English consumers and concluded that the process of choosing a product or service is based on the two products’ dimensions – symbolic and functional-; as a consequence, one may state that there are consumers that buy only premium brands (over evaluating the symbolic aspect) and others that exclusively buy cheaper brands (preferring the functional aspects). The majority of persons, however, end up choosing a mix of brands and products – Premium and Low Cost – and, therefore, if a store wants to be an interesting an competitive place where to shop, must have a considerable variety of products and brands, with different price ranges (Berkowitz & Walton, 1980; Ehrenberg et al., 1990; Uncles et al., 1995; Rojo, 1998; Zin & Liu, 2001; Daskalopoulou & Petro, 2005; Balakrisnan et al., 2008; Mittal et al., 2008; Simpson et al., 2008; Gupta et al., 2009; Langer & Rolim, 2009).
Despite the apparent confusion and/or difficulty to determine the right and magic formula, it seems to be consensual among investigators that the answer relies upon the clients, those persons that are, in fact, the wanted market segment of the store itself (Zinn & Liu, 2001; Daskalopoulou & Petro, 2005; Kotler & Armstrong, 2006; Mittal et al., 2008; Nagle & Hogan, 2008; Gupta et al., 2009). It seems to be generally accepted that any Product or Category manager must carefully plan the products’ mix, because only by doing this can the store guarantee that it is offering wanted products and brands that are understood as capable to answer properly to the clients’ demands, needs and desires (Zin & Liu, 2001; Daskalopoulou & Petro, 2005; Silva, 2009). This assortment management must be developed in an integrated way with all the various elements of the marketing mix and always coincident
with the competitive argument – Differentiation item(s) – that the brand decided to use (ex.: aggressive promotional actions using loyalty cards, coupons, special exposure along the store, brands and products variety, gifts’ offering, conquests, competitive price and so on).
It seems to be crucial for stores’ responsible to be able to understand how people perceive assortment variety and how do those perceptions about variety and non-failures influence the degree of satisfaction and make clients want to come back and establish a relationship through time with the point of sale (Hoch et al., 1999, in Faria et al., 2012). In fact, there is a significant number of authors that developed specific studies on consumer behavior that indicated that perceptions about variety of offer are important determinants for developing on clients positive attitudes and behaviors, meaning, making them choose a certain store based on those criterions (Arnold et al., 1983; Craig et al., 1984 in Hoch et al., 1999; Gupta et al., 2009; Silva, 2009).
2.4. Consumers reaction to variety
As consumers, certain persons may prefer stores with more variety of products and brands (Baumonl & Ide, 1956 in Faria et al., 2012; Berkowitz & Walton, 1980; Ehrenberg et al., 1990; Uncles et al., 1995; Rojo, 1998; Hoch et al., 1999; Zin & Liu, 2001; Kotler & Armstrong, 2006; Balakrisnan, 2008; Mittal et al., 2008; Simpson et al., 2008; Nagle & Hogan, 2008; Gruta et al., 2009; Langer & Rolim, 2009; Silva, 2009) because (1) they enjoy going to a store and finding everything they want, (2) they like to be able to choose among a considerable number of products and brands, without being restricted to the stores’ offer (3) they prefer to diversify their shops, from time to time, especially if they recognize a good quality-price relationship (some promotions, for instance); on the other side, as already mentioned, there are also some persons that find it hard to decide when they face a huge variety of products and brands, per category (Sproles & Kendall, 1986; Sproles & Sproles, 1990; Manolis et al., 1994; Iyengar & Lepper, 2000; Chernev, 2003; Iyengar et al., 2004; Schwartz, 2004; Berger et al., 2007; Chernev & Hamilton, 2009).
2.5. Consumers’ buying behavior – Commitment and Loyalty to the Point of Sale
After buying a product or service any consumer will establish a comparison between the final result (benefit) and what he/she was expecting to have in return. If the product or service matches expectations, the consumer gets predisposition to re-purchase and/or return to the point of sale – commitment. In other words, the client develops the wish to establish a habit – keep coming back and buying available products or services (Oliver, 1993; Gotlieb et al., 1994; Richins, 1995; Hill, 1996; Garbarino & Johnson, 1999; Seth et al., 1999; Shir & Huber, 2000; Soscia, 2002; Mittal et al., 2008) which, in fact, is the antecedent to the so wanted loyalty. On the other side, if consumers feel disappointed, because the real benefit falls short of the expected benefit, this feeling makes them think that the decision procedure was incorrect; as a result, their confidence in the point of sale and in the brands available will decrease and, in the future, will tend to consider other alternatives - products, services or stores (Oliver, 1993; Shir & Huber, 2000; Faria et al., 2012; Kumar et al., 2016).
“Commitment matches the emotional and psychological connection with a brand before the consumer is able to determine that his repeated buying behavior derives from a sense of loyalty” (Vieira, 2011, p. 15). In this study, when we consider commitment to the store we’ve followed the affective and/or Emotional commitment, as mentioned by Geyskens et al., 1996: the person wishes to have a relationship over time and, consequently, chooses a certain store where to go most of the time (Bon & Tissier-Desbordes, 2000; Alturas, 2003; Ponzoa, 2007; Ferreira et al., 2011).
For some authors, more than just commitment is the possibility to have loyalty clients; in other words, when a brand or a point of sale is capable to satisfy customers, they are likely to become faithful, meaning a satisfactory turn leads to repeated purchases and may result in purchases by habit or trust which, in turn, can be a synonym of customer loyalty (Assael, 1992; Oliver, 1993; Bloemer & Kasper, 1995; East, 1997; Castro & Cabinet, 1999 in Molinero, 2010; Neal, 1999 in Molinero, 2010; Tissier-Desbordes Bon,
2000; Ponzoa, 2002 in Molinero, 2010; Alturas, 2003; Liang & Wang, 2008 in Molinero, 2010; Ashley & Varky, 2009 in Molinero, 2010; Kumar et al., 2017).
In order to be able to talk about loyalty clients we need to see, at the same time, an attitude - they come back, they buy again -, commitment – desire to keep coming back and buy and the capacity to recommend to others their experience (Bloemer & Ruyter, 1997; Chaudhuri & Holbrook, 2001; Fullerton, 2005; Mattei et al., 2006; Mittal et al., 2008; Faria et al., 2012; Kumar, 2016; Mallika, 2015; Messaoud & Deboki, 2016).
3. Conceptual Model
This work is about the process of choosing a point of sale in the Portuguese retail area; we’ve decided to analyze this business area because, due to the strong economic crisis that we are living today, in Europe and abroad, we think it is crucial to clearly understand where do consumers decide to buy the essential goods – commodities – for their daily life. This question was derived from the literature review (Diallo & Kaswengi, 2016; Costa, 2017).
Moreover, it is also a market area that implies a significant number of transactions per day, a considerable number of brands and available products in order to satisfy the needs of an also considerable number of persons and, of course, a very competitive sector that uses different marketing and communication strategies so that they are able to catch and keep the individuals’ attention.
3.1. Methodology used and Hypothesis for research
The bibliographic review and actual information about the Portuguese market – retail -, lead us to create the following hypothesis: Some studies seem to show that the variety of options can influence the consumer’s process of choosing a point of sale in two ways. In fact, a considerable number of research suggest that, having the possibility to choose among a group of various alternatives increases the individual’ satisfaction and, consequently, those stores with a wide assortment of products and brands leverage the probability of consumers finding options to their preferences and needs (Berkowitz & Walton, 1980; Ehrenberg et al., 1990; Rojo, 1998; Hoch et al., 1999; Zin & Liu, 2001; Kotler & Armstrong, 2006; Balakrisnan, 2008; Mittal et al., 2008; Simpson et al., 2008, Nagle & Hogan, 2008; Gruta et al., 2009; Silva, 2009; Messaoud & Deboki, 2016):
H1: Given several alternative retail outlets, people that prefer to be exposed to a huge variety of products and brands available prefer to go to hypermarkets.
Despite the considerable number of studies concluding that the variety of products inside a store seems to be the best alternative for the consumer, some studies also showed that he/she my feel a certain difficulty to choose in front of too many options (Sproles & Kendall, 1986; Sproles & Sproles, 1990; Manolis et al., 1994; Dhar, 1997; Iyengar & Lepper, 2000; Chernev, 2003; Cherney & Hamilton, 2009; Khan, 2016). If so, it is possible to expect that:
H2: Given several alternative retail outlets, people that prefer to be exposed to a limited variety of products and brands available prefer to go to supermarkets.
Manolis et al. (1994) decided to analyze the influence of the store’s image in the intention to come back, giving special attention to a good product selection and to the inexistence of product failures. Some other studies (Zinn & Liu, 2001; Zezone & Buairide, 2005; Cachon & Köh, 2007; Rosseau, 2008; Felisoli, 1999; Parente, 2000 in Magalhães & Borges, 2008; Silva, 2009; Yu, 2009) seem to prove that distributors decide to offer a certain variety of products and to avoid failures because they want to satisfy clients and promote loyalty, knowing that each person considers the cost of having to look for a certain product in another point of sale. A product failure on shelves may create a sense of frustration on clients and lead them to buy in another store (Cachon & Kök, 2007; Silva, 2009; Yu, 2009):
H3: Consumers with a positive perception about stock management and that give a considerable importance to this aspect of store management tend to buy at Hypermarkets.
H4: Consumers with a less positive perception about stock management and that don’t give a considerable importance to this aspect of store management tend to buy at Supermarkets.
3.2. Model for Research – Scheme
3.3. Objective(s)
Since we are living a national and international economic crisis, we think it is very important to understand the factors that consumers consider when choosing where to buy the daily products they need to survive/exist – commodities. If price, by itself, seems to be a very important issue nowadays (notice the constant and aggressive promotions between competitors), what else matters?
We want to understand if the assortment and general layout have an influence on the consumers’ decision process towards a point of sale, in the retail area.
We also try to understand how can the different players show themselves as the right choice, specifically which differentiation aspects, as far as assortment and layout, shall they enhance (or not)?
4. Methodology, Data founded and Discussion
4.1. Methodology, Measures used, Scales and Necessary Adjustments
The research followed a quantitative, descriptive and casual approach; hypotheses were created after gathering some secondary information and doing a bibliography research. Questionnaires applied to a sample of final consumers. Data processing was done using the SPSS 2000.
Since the research is based on mass consumption goods available in retail stores, the population was defined as everyone who made at least one purchase in a supermarket or hypermarket in the last month. The sampling method was convenience.
• STOCKS – Shelves’ management, variety of offer and general store image and information about products and services; the stores’ layout and the variety of brands and products seem to strongly influence the consumer’s mind and, consequently, the intention to keep coming back to a certain store. In this research we’ve decided to adapt the Dickson and Albaum scale (1977) – factors related to the creation of a clear image of the store and the choosing decision by the individual – and the Sproles and Kendall Scale (1986)/Sproles and Sproles (1990) – the relationship between product and brands variety and a pleasant and easy shopping experience for consumers and consequent intention to return.
• BREAKS – With this expression we intend to refer to failures on shelves (the consumer does not find the products he/she was looking for - OOS). We need to understand the importance given by the final consumer to a proper assortment
H1 & H2 Brands
Variety
H3 & H4 Fail Hypermarkets
management adopted by the store’s responsible. In a direct way: what is the real reaction of a client when he/she faces a break on one or more of the products he/she was looking for? And does the reaction cause a certain behavior (preference for the store) and or commitment? In the present study we’ve decided to base our questions on the Manolis et al. (1994) previous research, since it is easy to adapt to the modern distribution.
4.2. Summary of Hypothesis, Variables and Scales
Table 1 - Hypotheses vs Variables vs Scales
Hypothesis Description Variables Scale
It is expected that, in front of different assortment politics, individuals tend to show different preferences as far as the type of store in concerned.
It is expected that, when facing product’s failures (Breaks) and less efficient stock
Stocks/Variety of Assortment
Dickson & Albaun, 1977 Sproles & Kendall, 1968 Sproles & Kendall, 1990
3 and 4 management policies individuals tend to show different preferences as far as the Breaks Manollis et al., 1994 type of store concerned.
4.2.1. Our Sample
The Questionnaire was applied on Facebook, and resulted on a sample of 116 valid answers. The sample mainly consisted of female individuals (79,8%), showing a cohabitation between 2-4 members (77,8%). A small percentage of individuals reported a monthly income higher than 2500 € (only 4,9%) and a considerable percentage of households identified a monthly income between 500 and 1000 € (26, 4%); 19,0% of the individuals have chosen not to answer.
Data considering cohabitation seems to corroborate our previous reading of a current trend of the Portuguese society and that lies in the late abandonment of parents' house by the young and young-adults (Moreira, 2016).
4.3. Variables and Statistic Analysis
• STOCKS (VO: Variety of Offer)
A Factor Analysis, using the principal components method with varimax rotation was performed including the items of Variety of Offer. The values for KMO (0,760) and Bartlett’s Test of Sphericity (df=15; p=0,000) revealed that data were adequate for this procedure. The Factor Analysis revealed two components, with a total variance explained of 69,187% (see Table 2). Component 1 groups the variables that reveal a sentiment of confusion and difficulty to choose when exposed to a lot of products, brands and information (Risky). Component 2 shows the opposite, i.e., consumers’ preference for stores with many products and brands from where to choose (Riskless). The reliability analysis revealed that component 1 has a strong reliability, while component 2, although lower, is within acceptable limits (Hair et al., 2006).
Table 2 - Component Matrix (VO Factor Analysis)
Rotated Component Matrixa
Component
1 2
There are stores with so many brands to choose that I get confused. ,823
The more information I find about products the more difficult it seems to choose the right one. ,833
I don’t identify myself with stores with few products on shelves. ,828
I prefer stores with less products to choose from. ,574
A lot of information about products and brands make me feel confused. ,910
I prefer stores with huge variety of products and services because I feel that I can always find what I want. ,763
Cronbach Alpha ,832 ,516
Variance Accounted For 49,719% 19,469%
Extraction Method: Principal Component Analysis. Rotation Method: Varimax with Kaiser Normalization. a. Rotation converged in 3 iterations.
• BREAKS (STOCK-OUT)
As a dichotomous scale, we used a generically analysis referred to as Optimal Scaling procedure, that assigns numeric values to each of the categories of qualitative variables, making possible the use of the standard methods of an ACP.
The first procedure showed that the item number 5 had a Discrimination Measure less than 0,5 (0,395) so, we proceeded to a 2nd procedure, excluding this variable.
The result reveals two dimensions (or factors) with a eighenvalue > 1; the first dimension has 51,9% of the total variance and the second one has 27,5%.
Tabel 3 - Variance (OC – Breaks/Stock Out)
Dimension Variance Accounted For
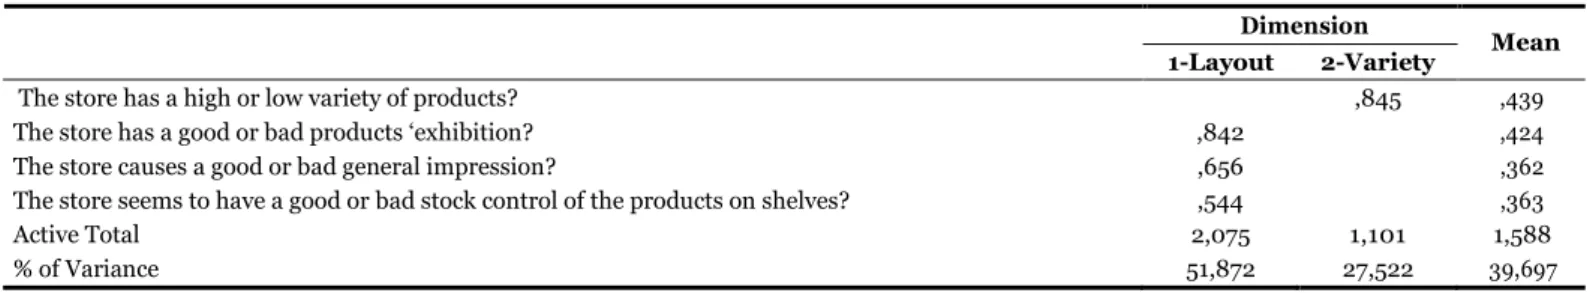
First Dimension (Layout) groups together items 2 (the store has a good or bad product exhibition), 3 (the store causes a good or bad general impression) and 4 (the store seems to do a good or bad stock control of the products on shelve) and the Second Dimension groups item 1 (the store has huge or small variety of products. The first component is about product exhibition and presence on shelves and was named “Layout”. The second component is variety perception and was named “Variety”.
Table 4 - Discrimination Measures
Dimension
Mean
The factor scores were saved as transformed variables for later use in the Regression Analysis.
Total (Eigenvalue) Inertia % of Variance
1 2,075 ,519 51,872
2 1,101 ,275 27,522
Total 3,176 ,794
Mean 1,588 ,397 39,697
1-Layout 2-Variety
The store has a high or low variety of products? ,845 ,439
The store has a good or bad products ‘exhibition? ,842 ,424
The store causes a good or bad general impression? ,656 ,362
The store seems to have a good or bad stock control of the products on shelves? ,544 ,363
Active Total 2,075 1,101 1,588
• REGRESSION ANALYSIS – Hypermarket
A regression analysis was performed using as dependent variable the Preference for Hypermarkets and as independent variables the two dimensions of the variety of offer (Excess of Products – Risky- and Brands and Deficit of Products and Brands - Riskless) and the two dimensions of the Optimal Scaling (Layout and Variety). The conceptual model presents a direct influence of two independent variables on a dependent variable. Also, there are no mediating variables considered. This is the reason why the regression analysis was suited for the present analysis.
ANOVA reveals that the Model is statistically significant (Sig. p<0,000). Overall, the explanatory power of the model is 21,6%.
Table 5 - Model Summaryb
Model R R Square Adjusted R Square Std. Error of the Estimate Durbin-Watson
1 ,497a ,247 ,216 ,907 1,573
a. Predictors: (Constant), Variety, Deficit of brands and products, Excess of brands and products, Layout b. Dependent Variable: I prefer to shop in Hypermarkets.
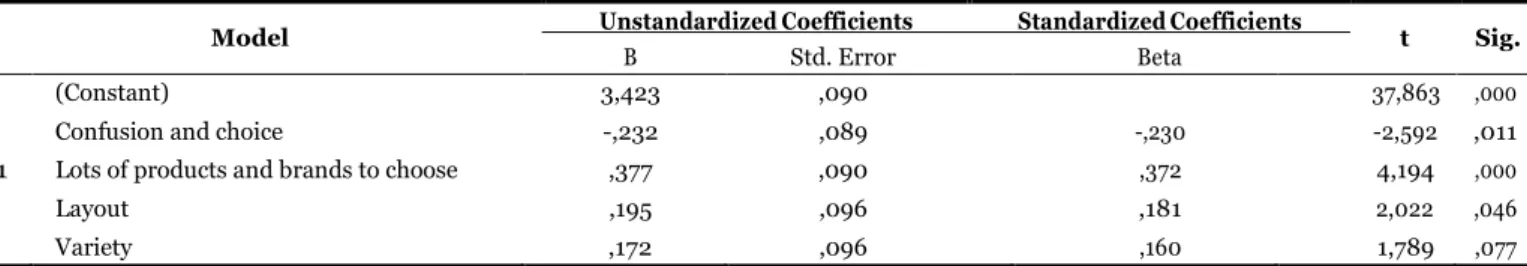
On one hand, lots of products and brands has a positive impact in the preference for Hypermarkets (β =372; p=0,000). In other words, consumers preferring a huge variety of products and brands tend to go to Hypermarkets. On the other hand, the confusion and choice present a negative impact (β =-0,230; p=0,011): despite preferring to have more variety, if the store does not present clear information and visibility clients may feel confused. Layout has a positive impact, that is, the higher the positive perception about layout, the higher the preference for Hypermarkets (β =0,181 and p=0,046). Variety does not have a statistically significant influence in preference for Hypermarkets.
Table 6 – Coefficientsa
Model Unstandardized Coefficients Standardized Coefficients t Sig.
a. Dependent Variable: I prefer to go shopping to Hypermarkets.
• REGRESSION ANALYSIS – Supermarket
The second regression analysis model looked specifically for perceptions about supermarkets. ANOVA reveals that the model is statistically significant (Sig.=0,000). The model has an explanatory power of 15,3% (the reduction on the preference for Supermarkets is explained in 15,3% by these variables).
Table 7 - Model Summaryb
Model R R Square Adjusted R Square Std. Error of the Durbin-Watson
Estimate
1 ,432a ,187 ,153 ,954 1,849
a. Predictors: (Constant), Variety, Layout, Deficit of brands and products, Excess of brands and products b. Dependent Variable: I prefer to shop in Supermarkets.
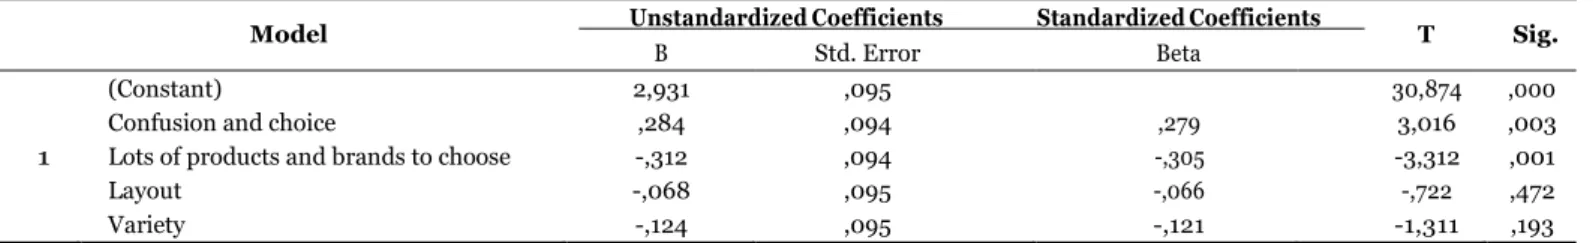
The excess of products and brands has a negative impact on the preference for supermarkets (β =-0,305; p=,001). Variety of products and brands has also a negative impact (β =-0,305; p=0,001). In other words, the more people prefer variety, the less they go to Supermarkets and the less they want to be exposed to a lot of alternatives, the more they will decide to go to this type of stores.
B Std. Error Beta
(Constant) 3,423 ,090 37,863 ,000
Confusion and choice -,232 ,089 -,230 -2,592 ,011
1 Lots of products and brands to choose ,377 ,090 ,372 4,194 ,000
Layout ,195 ,096 ,181 2,022 ,046
Tabel 8 – Coefficientsa
Model Unstandardized Coefficients Standardized Coefficients T Sig.
a. Dependent Variable: 12. I prefer to go shopping at Supermarkets.
4.4. Conclusions
There are differences between consumers that prefer Hypermarkets and those that prefer Supermarkets.
Consumers that prefer to have a huge quantity of products and brands tend to go to Hypermarkets and the higher the positive perception about layout (capacity to avoid breaks and good products and brands ‘exhibition) the higher the preference for Hypermarkets.
Oppositely, the more consumers prefer variety, the less they go to Supermarkets.
The regression analysis revealed that consumers perceive differently the two types of retail stores, hypermarkets and supermarkets: it is a fact that Hypermarkets have a huge capacity to offer a high variety of products and brands (stores with a sales area superior to 2.500 m2, according to Rousseau, 2014) and, therefore, they also developed a better stocking management, having a clear product presentation that makes it easy for consumers to choose, allowing them to feel that, in such stores, they can always find what they are looking for – or, at least, some product that can momentarily replace the first choice, without having to go to other stores. Hypermarkets, therefore, put on the individual the final decision (he/she has the right to choose, to decide among a considerable number of alternatives, not having to being restricted to what the store has to offer).
Some authors refer to this variety of products and brands as “one-stop shopping” (Zameer & Mukherjee, 2011; Faria et al., 2012), meaning fewer visits to retail outlets and, consequently, less costs associated (Faria et al., 2012). Lower available income and a willingness to quickly realize the act of purchase lead consumers to this position, namely to prefer stores where the probability to find everything they need (or, at least, a possible replace for) is high. Moreover, consumers develop trust and attention to the point of sale where they recognize the professionals’ (marketers, product managers, store directors in general) capacity to fulfill the promises they make, being variety one of the possible promises (Darke et al., 2010).
There are also a considerable number of consumers that prefer to be exposed to a small number of products and brands, so that their range of choice is reduced which makes them feel less confused and less prone for picking purchases situations and risk. In this context, supermarkets are the favorite stores for this type of consumer (stores with a sales dimension between 400 and 2.400 m2).
Another important issue to be considered is the absence of ruptures (generally referred to as Breaks or OOS). Many studies reveal that product availability in stores derives from a correct stock management policy and an efficient shelve management with a consequent product spare capacity (Van Nierop et al., 2008; Chopra & Meindl, 2007 in Aastrup & Kotzab, 2009; Trautrims et al., 2009; Dark et al., 2010). It is consensual that not being able to find a certain product at a store results in a negative experience that can lead to less suitable perceptions in the consumer’s mind and may imply a non-sale, both for the supplier and the distributor: “…by the third time a product is found to be OOS, less than one-third of all consumers are still willing to substitute; the remainder prefer to change the store or do not purchase” (Trautrims et al., 2009, p. 240).
B Std. Error Beta
(Constant) 2,931 ,095 30,874 ,000
Confusion and choice ,284 ,094 ,279 3,016 ,003
1 Lots of products and brands to choose -,312 ,094 -,305 -3,312 ,001
Layout -,068 ,095 -,066 -,722 ,472
Considering the results obtained with our sample, we may say that both hypermarkets and supermarkets clients do not want to come across products failures on shelves. However, according to our sample, it seems that consumers associate a better category management to hypermarkets (since this has a positive impact in choosing this type of store).
Another important issue to have in mind is the clear exhibition and information about brands, products and prices, since confusion is something that the consumer wants to avoid, regardless shopping at Hypermarkets and/or Supermarkets.
4.5. Practical Implications
All these findings offer important insights for modern distribution players (retailers) and their suppliers: the need to avoid breaks (OOS) and, also, the need to understand that our actual clients are very active, well informed and with a growing consciousness of the need to save money (avoiding the expenses associated to go to another store to find a certain product they weren’t able to find at the usual point of sale).
Despite the differences between hypermarkets’ clients (prefer variety of products and brands) and supermarkets’ clients (considerable variety leads to confusion), the capacity to offer what they initially promised is essential to make clients wish to come back – commitment – and even become loyal: “… retailers can streamline back and end operations to improve efficiency (e.g., by streamlining sourcing, or managing inventory levels for optimal turnaround)… retailers have also sought to enhance the store environment in a manner that reduces costs and increases profit” (Sorescu et al., 2011, p. 7), as well as to manage variety of offer avoiding confusion and the perception of risk must be achieved: sinaletic and merchandising materials must be used, both in Hyper and Supermarkets, so that to avoid any sense of confusion in the clients’ minds.
4.6. Limitations and Recommendations for future work
The most important limitation one may say is the sample used, due to time constraints; a larger sample, representing the national consumer, will allow solid conclusions.
We recommend a study just analyzing that the best practices do reduce confusion and risk in the buying process, and to verify store preference including other variables related to, for instance, Sensorial Marketing in the point of sale (and not just the variety, layout and stock’s management, which lead us to very low R2). The importance nowadays is to create positive experiences in the consumer.
Bibliographic References
Alturas, B. (2003). Venda directa: determinantes da aceitação do consumidor (Tese de Doutoramento, ISCTE). Arnould, E., Price, L., & Zinkhan, G. (2003). Consumers. New York: McGraw-Hill.
Assael, H. (1992). Consumer Behavior & Marketing Action (4th Edition). PWS-Kent Publishing Company.
Balakrishnan, A., Pangburn, M. S., & Stavrulaki, E. (2008). Integrating the Promotional and Service Roles of Retail Inventories.
Manufacturing and Service Operations Management, 10(2), 218-235.
Beirão, A. F. C. R. (2004). Impacto das Promoções de vendas no valor da Marca. Porto: Edições IPAM.
Berger, J., Drogansk, M., & Simonson, I. (2007). The Influence of Product Variety on Brand perception and choice. Marketing Science,
26(4), 460-472.
Berkowitz, E. N., & Walton, J. R. (1980). Contextual influences on consumer price responses: an experimental analysis. Journal of
Marketing Research, 17(3), 349-358.
Blomer, J., & Kasper, H. (1993). Brand loyalty and brand satisfaction: the case of buying audio cassettes a new in the Netherlands. In J. Chías & J. Sureda (Eds.), EMAC Proceedings, Annual Conference (pp. 183–201). Barcelona: European Marketing Academy.
Blomer, J., & Ruyter, K. (1998). On the relationship between store image, store satisfaction and store loyalty. European Journal of
Marketing, 32(5/6), 499-513.
Bon, J., & Tissier-Desbordes, É. (2000). Fidéliser les Clients? Oui, mais... . Revue Française de Gestion, 127, 52-60. Booking (2011). Booking Online hotel reservations. Retrieved December 3, 2011, from www.vidagopalace.com
Briesh, A. R., Chintagunta, P. K., & Foz, E.J. (2009). How does assortment affect grocery store choice. Journal of Marketing Research,
XLVI, 176-189.
Bronigrezyk, S. M., Hoyer, W. D., & McAliester, L. (1998). Consumers’ Perceptions of the Assortment offered in a Gorcery Category: the Impact of Item Reduction. Journal of Marketing Research, 35(2), 166-176.
Cachon, G. P., & Kök, A. G. (2007). Category Management and Coordination in Retail Assortment Planning in the Presence of Basket Shopping Consumers. Journal of Management Science, 53(6), 934-951.
Canal Luxe (2011). Luxury Brands Reinvent Their Way Of Communication!. Retrieved December 3, 2011, from http://www.canal- luxe.org/?p=1004
Charlton, P., & Ehrenberg, A. S. C. (1976). An Experiment in Brand Choice. Journal of Marketing Research, 13, 152-160. Chaudhuri, A., & Holbrook, M.B. (2001). The Chain of Effects from Brand Trust and Brand Affect to Brand Performance: the Role of
Brand Loyalty. Journal of Marketing, 65(2), 81-93.
Chernev, A. (2003). When more is less and less is more: the role of ideal point availability and assortment in consumer choice.
Journal of Consumer Research, 30(2), 170-183.
Chernev, A., & Hamilton, R. (2009). Assortment Size and Option Attractiveness in Consumer choice among Retailers. Journal of
Marketing Research, XVLI, 410-420.
Costa, A. R. (2017). Wallmart prepara-se para despedir centenas de pessoas. Revista Distribuição Hoje, 11 de Janeiro de 2017, acedido em 27/07/2017.
Coughlan, A. T., & Shaffer, G. (2009). Price Matching Garantees, Retail Competition, and Product line Assortment. Marketing Science,
28(3), 580-588.
Cushman & Wakefield (2009). Business Briefing – Retalho de Luxo Em Portugal. Retrieved December 3, 2011, from http://biaxial.files.wordpress.com/2009/11/cwbusinessbriefingretalholuxoportugal_nov09.pdf
Daskalopoulou, I., & Petrou, A. (2005). Service Quality and Store Performance: some evidence from Greece. Managing Service Quality,
15(1), 24-40.
Diallo, M. F., & Kaswengi, J. (2016). What Drives Store Brand Purchases during Crisis Periods? Evidence from Panel Data in Four Product Categories. International Journal of Retail & Distribution Management, 44(3), 301-319.
Dickson, J., & Albaum, G. (1977). A Method for Developing Tailor-made Semantic Differentials for Specific Marketing Content Areas.
Journal of Marketing Research, 14, 87-91.
East, R. (1997). Consumer Behavior Advances and Applications in Marketing. Prentice Hall Europe.
Ehrenberg, A. S. C., Goodhart, G. J., & Barwise, T. P. (1990). Double jeopardy revisited. Journal of Marketing, 54, 82-91. Ernst & Young (2005). China: the new lap of luxury. Retrieved September, 2011, from http://www.ey.com/global/download.
nsf/China:E/050914_RCP_PP_E/$file/Presentation
Faria, S., Reinares, E. L., Magalhães, C., & Costa, P. (2012). Análisis de los principales determinantes en el proceso de selección de un
punto de venta de retail por el consumidor – el caso del mercado português (Tesis Doctoral, Universidad Rey Juan Carlos).
Ferreira, B., Marques, H., Caetano, J., Rasquilha, L., & Rodrigues, M. (2011). Fundamentos de Marketing. Lisboa: Edições Sílabo. Fox, E. J., Montgomery, A. L., & Lodish, L. M. (2002). An Empirical Investigation (written in 2001 and reviewed in 2002). 2nd Edition. Fullerton, G. (2005). Impact of Brand Commitment on Loyalty to Retail Service Brands. Canadian Journal of Administrative Sciences,
22(2), 55-62.
Garbarino, E. & Johnson, M. S. (1999). The different roles of satisfaction, trust and commitment in customer relationships. Journal
Geyskens, I., Steenkamp, J.-B., & Kumar, N. (1998). Generalizations about Trust in Marketing Channel Relationships using Meta- analysis. International Journal of Research in Marketing, 15(3), 223-248.
Gotlieb J. B., Grewal, D., & Brown S. W. (1994). Consumer Satisfaction and Perceived quality: complementary or divergent constructs? Journal of Applied Psychology, 79(6), 875.
Gupta, S., Heng, X., & Sahu, V. (2009). Impact of Store Size on Impulse Purchase. The IUP Journal of Marketing Management, VII(1), 7-22.
Hamilton, S. F., & Richards, T. J. (2009). Product Differentiation, Store Differentiation and Assortment Depth. Management Science,
55(8), 1368-1376.
Hill, N. (1996). Handbook of Customer Satisfaction Measurement. Aldershot, Hampshire: Gower Publishing, Hoch, S. J., Bradlow, E. T., & Wansink, B. (1999). The Variety of an Assortment. Marketing Science, 18(4), 527-546.
Huffman, C., & Kahn, B. E. (1998). Variety for Sale: Mass Customization or Mass Confusion?. Journal of Retailing, 74(4), 491-513. Iyengar, S. S., & Lepper, M. R. (2000). When Choice is Demotivating: can one desire too much of a good thing?. Journal of Personality
and Social Psychology, 79(6), 995-1006.
Iyengar, S. S., Huberman, G., & Jiang, W. (2004). How much choice is too much? Contributions to 401 (K) retirement Plans. In Olivia S. Mitchel & Stephen P. (Eds.), Pension Design and Structure: New lessons from Behavioral Finance (pp. 83-95). Oxford: Oxford University Press,.
Kahn, B. (2016). Using Visual Design to Improve Customer Perceptions of Online Assortments. Journal of Retailing, 93(1), 29-42. Kotler, P., & Armstrong, G. (2006). Princípios de Marketing (12ª Ed.). Prentice Hall.
Kotler, P., Jaya, H. K., & Setiwan, I. (2011). Marketing 3.0 - Do Produto e do Consumidor Até ao Espírito Humano. Lisboa: Actual Editora. Kumar, A., Gupta, S. L., & Kisher, N. (2016). The Antecedents of Customer Loyalty: Attitudinal and Behavioral Perspectives Based on
Oliver’s Loyalty Program. Indian Journal of Marketing, 46(3), 31-53.
Langer, E. J., & Rodin, J. (2009). The effects of choice and Enhanced personal responsibility for the aged: a field experiment in an Institutional Setting. Journal of Personality and Social Psychology, 34(2), 191-198.
Magalhães, L. F., & Borges, A. (2008). As Estratégias de Marketing no Varejo e a Importância do Sortimento e Suprimentos de Produtos. Centro Universitário de Belo Horizonte, Pró-Reitoria de Pós-Graduação, Pesquisa e Extensão.
Mallika, S. S. (2015). Influencers and Consequences of Brand Loyalty – a study based on select newspapers in Hyderabad. The Indian
Journal of Commerce, 68(1), 22-31.
Manolis, C. W., Keep, W. W., Joyce, M. L., & Lambert, D. R. (1994). Testing the Underlying Structure of a Store Image Scale. Educational
and Psychological Measurement, 54(3), 628-645.
Mantrala, M. C., Levy, M., Kahn, B. E., Fox, E. J., Gaidarev, P., Dankworth, B., & Shah, D. (2009). Why is Assortment Planning so Difficult for Retailers? A Framework and Research Agenda. Journal of Retailing, 85(1), 71-83.
Mattei, D., Machado, M., & Oliveira, P. A. (2006). Comportamento do Consumidor: factores que influenciam no processo de decisão de compra dos consumidores finais. Maringá Management: Revista de Ciências Empresariais, 3(2), 177-186.
Messaoud, A. B., & Deboki, M. (2016). The Role of Physical Environment in Consumers’ Relationship with a retail Outlet Offering a Regional Product. International Business and Management, 13(1), 22-28.
Mittal, B., Halbrook, M., Beaty, S., Raghubir, P., & Woodside, A. (2008). Consumer Behavior How Humans Think, Feel and Act in the
Marketplace. Open Mentis.
Molinero, M. T. V. (2010). Los Programas de Fidelizacion multisponsor: Un Estudio de su Influencia en la Lealtad Comportamental de
sus Asociados (Tesis Doctoral, Universidad Rey Juan Carlos).
Nagle, T. T., & Hogan, J. E. (2008). Estratégias Tácticas de preço um guia para crescer com lucratividade (4.ª Edição). Pearson Prentice- Hall.
Observador (2016). A população portuguesa está a diminuir: 10 gráficos para entender como. Retrieved January 21, 2017, from http://observador.pt/2016/06/16/ine-a-populacao-esta-a-diminuir-em-portugal
Oliver, R. L. (1993). Cognitive, Affective and Attribute Bases of the Satisfaction Response. Journal of Consumer Research, 20(3), 418- 430.
Ponzoa, C. J. M. (2007). Programas de fidelización de clientes: Un estúdio empírico sobre la efectividad de los canales de comunicación
directa e interactiva en la dinamización de ventas y relaciones (Tesis Doctoral, Universidad Complutense de Madrid).
Richins, M. L. (1983). Negative Word-of-Mouth by Dissastified Consumers: A Pilot Study. Journal of Marketing, 47, 68-78. Richins, M. L. (1995). Social Comparison, advertising and consumer discontent. The American Behavioral Scientist, 38(4), 593. Rojo, F. J. G. (1998). Pesquisa: o comportamento do consumidor nos supermercados. Revista de Administração de Empresas, 38(3),
16-24.
Rousseau, J. A. (2008). Manual de Distribuição (2.ª Edição). Lisboa: Principia.
Schary, P. B., & Christopher, M. (1979). The Anatomy of a Stock-out. Journal of Retailing, 55(2), 59-70. Schwartz, B. (2004). The Paradox of Choice: Why more is less. New York: Ecco.
Sela, A., Berger, J., & Liu, W., Variety (2009). Vice and Virtue: how Assortment size influences Option Choice. Journal of Consumer
Research, 35(6), 941-951.
Seth, J., Mittal, B., & Newman, B. (1999). Customer Behavior: consumer behavior and beyond. Dryden Press.
Shir, B., & Huber, J. (2000). The Impact of anticipating satisfaction on consumer choice. Journal of Consumer Research, 27(2), 202- 216.
Silva, L. (2009). A Sedução das compras. As melhores estratégias de Marketing no Ponto de Venda. Gestão Plus. Simonson, I. (1999). Vice and Virtue: how Assortment size influences Option Choice. Journal of Retailing, 75, 343-370.
Simpson, P. M., Siguaw, J. A., & Cadogan, J. W. (2008). Understanding the consumer propensity to observe. European Journal of
Marketing, 42(1/2), 196-221.
Soscia, I. (2002). The influence of emotion of surprise on consumers satisfaction: a pilot experiment. In M. Farhangmehr (Ed.),
Marketing in a changing world. 31st EMAC Conference Proceedings. Braga.
Sproles, E. K., & Sproles, G. B. (1990). Consumer Decision-Making Styles as a Function of Individual Learning Styles. Journal of
Consumer Affairs, 24(1), 134-147.
Sproles, G. B., & Kendall, E. (1986). A Methodology for Profiling Consumers’ Decision-Making Styles. Journal of Consumer Affairs,
20(2), 267-279.
Theodoras, D., Laios, L., & Moschuris, S. (2005). Improving Customer Service performance within a food supplier-retailers context.
International Journal of Retail & Distribution Management, 33(5), 353-370.
Trendswatching. Retrieved October, 2016, from www.trendswatching.com
Uncless, M., Ehrenberg, A. S. C., & Hammoud, K. (1995). Patterns of buyer behavior: regularities, models and extensions. Marketing
Science, 14(3), 671-678.
Vieira, V. A. (2011). Escalas em Marketing Métricas de Resposta do Consumidor e de Desempenho Empresarial. São Paulo: Editora Atlas.
Yu, X. (2009). Optimal Price and Product Quality decisions in a Distribution Channel. Management Science, 55(8), 1347-1352. Zezone, L. C., & Buairide, A. M. C. (2005). Marketing da Promoção e Merchandising, Conceitos e estratégias para acções bem sucedidas.
Thomson Ed.