i
Understanding Students’ Academic Achievement
in Public High School
Ana Filipa Rosa Louro
Evidence for Portugal
Dissertation as partial requirement for obtaining the
Master’s degree in Information Management
i
MEGI
201
ii
NOVA Information Management School
Instituto Superior de Estatística e Gestão de Informação
Universidade Nova de LisboaUNDERSTANDING STUDENTS’ ACADEMIC ACHIEVEMENT IN PUBLIC
HIGH SCHOOL: EVIDENCE FOR PORTUGAL
by
Ana Filipa Rosa Louro
Dissertation presented as partial requirement for obtaining the Master’s degree in Information Management, with a specialization in Knowledge Management and Business Intelligence
Advisor: Frederico Miguel Campos Cruz Ribeiro de Jesus Co Advisor: Jorge Nelson Gouveia de Sousa Neves
iii
ACKNOWLEDGEMENTS
This thesis would not be possible without the help of all that are dear to me and also those that worked beside me.
To my parents, my brother and my boyfriend, I’m especially grateful for all the patience and support during the accomplishment of this thesis.
To my friends that always encouraged me to do my best.
To my advisor, Professor Frederico Cruz Jesus, for all the help, support and wise words. Thank you for your advices, contributions and constructive feedback.
To Professor Jorge Neves for all the advices and availability.
To Direção-Geral de Estatísticas da Educação e Ciência, in particular, to Dra. Joana Duarte and Dra. Catarina Afflalo for all the availability and specially for creating the conditions to develop this work and provide me the access to the data, crucial to my work.
iv
ABSTRACT
Several papers and studies have been conducted to better understand what are the main factors that influence students’ academic achievement and what measures should be taken to improve it. Therefore, based on 383.560 students’ observations, evaluated on secondary Portuguese public schools in 2014/2015 academic year, the purpose of this study is to provide a new approach to the collected data by using Data Mining predictive models. The results show differences on the academic achievement among females and male students, where females got better academic results. Access to computer and Internet found to be powerful tools in education that students can explore to their benefit and show to have a positive influence on academic results. Students benefiting from financial social support prove to have a lower performance in academic achievement. Results also point to the fact that the number of reproves still has a great negative impact on students’ academic achievement. This is one of the first studies to the best of the authors knowledge to employ analytic techniques on such a large dataset on the context of academic achievement.
KEYWORDS
v
INDEX
1.
Introduction ... 1
2.
Theoretical background ... 2
2.1.
The concept of academic achievement ... 2
2.2.
Prior research on academic achievement ... 2
3.
Conceptual Model for understanding academic achievement ... 9
4.
Methodology and results ... 12
4.1.
Data ... 12
4.2.
Descriptive Statistics and non-parametric tests ... 12
4.3.
Decision Trees... 18
5.
Discussion ... 26
5.1.
Discussion of Findings... 26
5.2.
Practical implications ... 27
5.3.
Theoretical implications ... 27
6.
Conclusions ... 28
7.
Limitations and recommendations for future works ... 29
8.
Bibliography ... 30
vi
LIST OF FIGURES
Figure 4.1 – Final Classification do not follow a normal distribution ... 13
Figure 4.2 – Decision Tree for academic achievement at course level (Model 1) ... 20
Figure 4.3 – Decision Tree for academic achievement at year level (Model 2) ... 23
Figure 4.4 – Cumulative Lift and Cumulative Captured Response for Model 1 ... 25
Figure 4.5 – Cumulative Lift and Cumulative Captured Response for Model 2 ... 25
Figure 9.1 – SAS MINER MODEL 1 ... 36
vii
LIST OF TABLES
Table 2.1 – Review of prior research on academic achievement ... 8
Table 4.1 – Normality Test ... 13
Table 4.2 – Students’ Characteristics ... 15
Table 4.3 – Parents’ Socioeconomic Characteristics ... 16
Table 4.4 – Schools’ Characteristics ... 17
viii
LIST OF ABBREVIATIONS AND ACRONYMS
DGEEC Direção-Geral de Estatísticas da Educação e Ciência
GLM General Linear Model
GDP Gross domestic product
GPA Grade point average
IEA International Association for the Evaluation of Educational Achievement
HLM Hierarchical Linear Modeling
INE National Institute of Statistics
IRT Item Response Theory
MEC Ministry of Education and Science
MLR Maximum Likelihood
NCES The National Center for Education Statistics
OECD Organization for Economic Co-operation and Development
OLS Ordinary Least Squares
PISA Programme for International Student Assessment
RDD Regression Discontinuity Design
SASE Serviços de Ação Social Escolar
SEM Structural equation models
SES Socioeconomic status
1
1. INTRODUCTION
Understanding the factors that lead to students’ academic achievement is a timeless topic that is not only of universal concern to students, teachers, and families but also to society in general (Jayanthi, Balakrishnan, Ching, Latiff, & Nasirudeen, 2014; Maehr & Zusho, 2009). The role students’ academic achievement has on the individuals and overall society is a matter that long concerns the researchers, mainly as a result of the positive effects that it has demonstrated and highlighted on key aspects of society such as development and productivity improvements (B. Spinath, 2012). In fact, it emphasizes the importance of human capital (Barro & Lee, 2001; Neamtu, 2015) increases the knowhow on new businesses and technologies and promote the spreading and transmission of information and knowledge (Hanushek & Wößmann, 2010). As so, students’ academic achievement can be used to determine the variation of salaries, growth domestic product (GDP) rate and foster a higher rate of country development (Hanushek & Kimko, 2000; Hanushek & Woessmann, 2012), but also to fight social exclusion and discrimination of minority groups (Dronkers, Van Der Velden, & Dunne, 2012). In a more practice perspective the students’ academic achievement at secondary level can act as a catalyst that will determine the progression to the next level of education and subsequently into the world of work (Abosede & Akintola, 2016).
There are several studies and theories that explain what factors influence students’ academic achievement, one of the most well-known is promoted by the Organization for Economic Co-operation and Development (OECD) through the Programme for International Student Assessment (PISA), “a triennial international survey which aims to evaluate education systems worldwide of 15-year-old students”. The goal is to enhance the added value of this work by studying a global and borderless subject using data from Portuguese students attending public schools in the years 2014/2015 for 10th, 11th and 12th grades, evaluated and attending the 21 courses further carried out
on the national examinations, provided by Directorate-General of Statistics of the Portuguese Ministry of Education (DGEEC). The data and the database collected have never been analyzed and studied in the same way as this study does and, as so, the findings will offer further insights that can help demonstrate, furthermore, the status of education and what possible factors may be influencing students’ academic achievement in the context of an European country, facilitating, in the medium and long term our understanding of the measures that can be taken to help students achieve better results in the future. Additionally, the aim of this study is also to fill a gap that exists by analyzing academic achievement using data mining techniques, which is an innovative approach as these techniques permit handling large amount of data, finding rules, patterns, thus developing models that can make predictions and support new ideas and, ultimately, theories. In this particular case, the objective is to give evidence on which factors affect students’ academic achievement by studying students, parents and school at the same time and provide evidence on why some students achieve better results than others leading to better understandings and conclusions (Hodis et al., 2015). To pursue the objective expressed above, this work is organized as follows: the first section describes the importance of studying students’ academic achievement and distinguish this from previous analysis. The second defines academic achievement and what has been studied on this topic. The third explains our conceptual model and displays the hypotheses tested. The fourth specifies the methodology and exposes our results. The fifth presents the discussion of findings. The sixth presents the main conclusions and finally the limitations and recommendations for future works.
2
2. THEORETICAL BACKGROUND
2.1.
T
HE CONCEPT OF ACADEMIC ACHIEVEMENTAcademic achievement is an universal topic, and the study of tests related to school success has been initiated since the years of the Second World War mainly due to the correlation between the quality of an educational system and the socioeconomic development of the countries (Steinmayr, Meißner, Weidinger, & Wirthwein, 2016). Being a wide-opened topic, its definition depends and can be easily influence by the possible factors used to measure it. According to Steinmayr, Meißner and Weidinger (2016), “academic achievement represents performance outcomes that indicate the extent to which a person has accomplished specific goals that were the focus of activities in instructional environments, specifically in school, college, and university. Therefore, academic achievement should be considered as a multifaceted construct that comprises different domains of learning“. Hence, in a linear and more objective perspective is a cumulative function of current and prior family, community, and school experiences (Rivkin, Hanushek, & Kain, 2005). On the other hand, from a perspective of results obtained can be described as individual student marks in a given year, school achievement exams or standardized test scores in core subjects, grades or grade point average (GPA), or even teacher rating scales (Chowa, Masa, Ramos, & Ansong, 2015).
2.2. P
RIOR RESEARCH ON ACADEMIC ACHIEVEMENTSince the 1960s international agencies, such as the International Association for the Evaluation of Educational Achievement (IEA) and (OECD), have performed several international tests (e.g., TIMSS and PISA) regarding students’ academic achievement in cognitive areas (Hanushek & Wößmann, 2010). According to what has been described, the literature review shows that one of the first social scientific studies that analysed which factors influenced students’ academic achievement started with The Coleman Report that showed, on the one hand, little association between quantity and quality of school contributions and levels of educational attainment, and, on the other hand, the most important determinants of students’ educational attainment were family background, but also to the backgrounds of other students in school (Coleman & Hopkins, 1966). Over the years many critiques and improvements were presented to the Coleman’s Report particularly to have better insights on the impact of teachers’ characteristics have on students’ academic achievement (Bowles & Levin, 1968). Supporting this theory, Greenwald, Hedges and Laine (1996) argued that factors such as teacher education, experience, and smaller classes are positively related to students’ academic achievements.
Since then, new approaches have emerged and started to create several new models and theories. Walberg (1984) designed a model defending that exists nine majors’ factors directly influencing students’ academic achievement: the ability or prior achievement, development, motivation, amount of time students engage in learning, quality of the instructional experience, home, classroom, peers and television, these last four factors influence psychologically the learning. Bourdieu’s theory (Bourdieu, 1973, 1984) is the most well-known theory of cultural capital. He defends that children from high status backgrounds have an advantage since they share similar cultural understandings as those which inspired and guide the educational system (Marks, Cresswell, & Ainley, 2006). Coleman’s theory (Coleman, 1988) is the most well-known theory of social capital struggles that defends that children have better results in schools with more inner network community around them, where
3 parents, teachers, and the local community interact and enhance educational success. Epstein's theory defends that the combination of psychological, educational, and sociological perspectives can lead the family, school, and local community to influence student achievement (Driessen, Smit, & Sleegers, 2005).
As a result of numerous empirical studies over a very long period of time and join all of the perspectives, the best way to perceive the main causes of students’ academic achievement is to understand and study the characteristics of students, parents and schools (Chowa et al., 2015) as conclude when applying hierarchical linear modeling (HLM) due to the multileveled nature of the data, but also teachers’ characteristics, although we were not able to retrieve data from teachers resulting in a limitation of this study. In order to clarify the importance of the four characteristics presented before, each of the perspectives and the respective methodology used will be described in detailed below.
Students’ Characteristics
Students’ characteristics have been studied as a major factor to explain students’ academic achievement (C. L. Lee & Mallik, 2015; Patterson & Pahlke, 2011). To obtain these results, the researchers used OLS regressions collecting multi-year data set over 2007-2012 and regression model using data from 2007 from two periods of time, respectively. One of the most studied determinants is gender, where according to research, exist significant gender differences in students’ academic achievement, since females in almost all cases outperform males in school results (Mensah & Kiernan, 2010; Steinmayr & Spinath, 2008; Wally-Dima & Mbekomize, 2013) with higher highlight among different scientific areas of studies (Brunner et al., 2013; Ghazvini & Khajehpour, 2011; Steinmayr & Spinath, 2008). While Mensah & Kiernan (2010) used Tobit regression for both univariate and multivariate analysis, Steinmayr & Spinath (2008) applied multiple regression analyses and structural equation models (SEMs) and Wally-Dima & Mbekomize (2013) descriptive statistics. Brunner chose to apply multiple-group factor-analytic models to examine the standard model, the nested-factor model and the non-independence of the student data was estimated by means of the full maximum likelihood method (MLR). However, male students outperformed female students in specific mathematics ability (Brunner, Krauss, & Kunter, 2008), and in the opposite way girls outperform boys in reading (Brunner et al., 2013), specifically across OECD countries (2014). There are still those who conclude that female students also graduate from high school with higher grade point averages (GPAs) than male colleagues (Perkins, Kleiner, Roey, & Brown, 2004). This conclusion came from The National Center for Education Statistics (NCES) of United States using as methodology linear regression parameters, and logistic regression parameters.
Another sociodemographic characteristic that has been pointed as key for this topic is ethnicity, particularly in which way students’ ethnicity affects their school performance. In this case Lee (2007) applied multi and individual-level analysis using the classical linear regression model. It’s also important to understand whether immigrant children or those whose parents are emigrants have adapted well in schools and how this has influenced their school performance as well as their adaptation in adulthood (Portes & Rumbaut, 2005). In Netherland, for example, “(non-Western) ethnic minority pupils start and finish primary education with considerable arrears in mathematics and (Dutch) language compared to the native Dutch population” (Stevens, Clycq, Timmerman, & Van Houtte, 2011). According to OECD results (2012) this behavior is recorded in most OECD countries
4 where the results shows clearly that students with an immigrant background tend to have lower education performance than native students.
Students are probably the most frenetic and high consumable users of contemporary digital communication technologies (Wentworth & Middleton, 2014). To have a clear understanding on how it affects their actions and consequently their performance at school, it seems of crucial concern and at the same time vital to comprehend if the new teaching approach brings advantages to student performance. With this in mind, technology is being taken in consideration on the traditional indicators of students’ academic achievement, including not only the access to internet but also the way students are using it (Torres-Díaz, Duart, Gómez-Alvarado, Marín-Gutiérrez, & Segarra-Faggioni, 2016). For this study, the researchers used a random sample and categorized it in two groups using factor and cluster analysis, for the results they applied a multinomial logistic regression model. As a result, researchers also felt the need, to create a new concept and approach that is characterized by the fusion of the terms education and entertainment – Edutainment, being describe as “a very interesting combination of traditional content and teaching methods in the context of new technologies” (Oksana & Elena, 2015). This still however, an underdeveloped topic and therefore it is not permissible to draw enough conclusions from it (Okan, 2003).
Some authors have concluded, through interviews methods, that internet access has shown to be highly correlated with impaired and poor students’ academic achievement (Kubey, Lavin, & Barrows, 2001; Liebert & Chou, 2001), although more recent studies have proved that these conclusions are not so clear since children who use Internet with higher frequency have higher scores (Jackson et al., 2006; Torres-Díaz et al., 2016).
Owning and using a home computer is one of those factors that, after literature review, leads to inconclusive results as there are studies that indicate that there is a clear positive relation between having access to the computer at home and better students’ academic achievement (Borzekowski & Robinson, 2012; Gil-Flores, 2009). At the same time, there are researchers arguing that using computers in a more frequent way do not necessarily lead to better or higher students’ academic achievement (Lei & Zhao, 2007), it can actually lead to a broaden, rather than narrow, math and reading achievement gap (Vigdor, Ladd, & Martinez, 2014), and there are even those who criticize and defend that those students who spent more time on their computer, compared to those who spent less time, have lower GPAs and spend less time studying (Wentworth & Middleton, 2014).
Parents’ Characteristics
Parents’ characteristics and their involvement has been identified as a possible important key factor for students’ academic achievement as demonstrated by Fan & Chen (2001) when applying regressions using GLM or by Hill & Taylor (2004) when referring that parents’ involvement “has a positive influence on school-related outcomes for children”. In fact, this influence occurs at both quantitative and qualitative level. One example is the positive relation between parent involvement at school and parents’ higher expectations being associated with higher students’ academic achievement, demonstrated after recurring to t tests, chi-square statistics, and hierarchical regressions (J.-S. Lee & Bowen, 2006). Concerning the effect of parental participation and its effect on achieving better results, the literature also reveals a positive correlation between home climate and environment influence on students’ academic achievement, being observed by means of interview techniques carried out on the students, through regression analysis and qualitative
5 research respectively (Codjoe, 2007; Jeynes, 2007; Wilder, 2014). When applying a longitudinal study, by using hierarchical regression analysis and logistic regression analysis, Miedel and Reynolds (1999) demonstrated that parent involvement independently led to greater achievement for children and adolescents. In this sense Barnard (2004) also explained that parents have a positive influence on students as “parent involvement in school was significantly associated with lower rates of high school dropout, increased on-time high school completion, and highest grade completed“, when a logistic regression and hierarchical linear regression were adopted as well as univariate analysis.
Another well-known factor that has been demonstrated, when recurring to regression techniques, to be relevant and having a positive relationship (Caro, Mcdonald, & Willms, 2009) to the explanation of students’ academic achievement is parents’ socioeconomic status (SES). Indeed, there is support that this factor is influenced by parents’ income, occupation and education level (J.-S. Lee & Bowen, 2006; Sirin, 2005; Steinmayr, Dinger, & Spinath, 2010). However, the research is more expansive with respect to the influence of mother's education on students’ academic achievement, presenting that lower maternal education remained significantly linked with lower children’ school outcome (Hartas, 2011; Mensah & Kiernan, 2010) as both researches concluded after using mainly univariate analysis. With the current recession, more students are now living in households where their parents are unemployed. As result, does this cause any effect on their educational outcomes? Even though there weren't found many studies on this topic there are those who argue that “long-term parental unemployment predicts lower educational attainment for children” (Sandstrom & Huerta, 2013).
Schools’ Characteristics
Regarding schools’ characteristics, the first focus is mainly in the school and class size due to the fact that it is not difficult to find claims for both sides of the argument about whether their influence can lead to enhancements in learning outcomes (Leithwood & Jantzi, 2009). Class size is one of the topics that has elicited more debates as a result of dubious and different conclusions but also its associated costs (Schanzenbach, 2014). Smaller classes size has been frequently suggested as a way to enhance students’ academic achievement when applying OLS regression analyses (Krassel & Heinesen, 2014). In fact, according to Bosworth (2014) results show that not only it improves students’ achievement but may also be relatively more effective closing the achievement gaps after using regressions and chi-square tests. A similar perspective provided by Rivkin, Hanushek and Kain (2005) reinforcing, through regression tests, prove that class size reduction, allow students to have better progression at school. A contradictory view is given by other studies proving that using linear regression analysis, the reduction of class size is not directly linked to the better students’ academic achievement or school performance (Hoxby, 2000; Wößmann & West, 2006).
According to the existing link between school size and students’ academic achievement the truth is the remaining studies reported a negative relationship between increasing school size and achievement supported by regression and cross-sectional regression analysis (Archibald, 2006; Welsch & Zimmer, 2016). Aligned with this theory Egalite and Kisida (2016) expose a clear evidence that students’ academic achievement in math and reading declines as school size increases. Opposed to the previous theory there are also those who have found evidence of a positive relationship between larger school size and academic achievement after using linear programming techniques (Barnett, Glass, Snowdon, & Stringer, 2002).
6
Teachers’ Characteristics
The literature also reports to be fairly reasonable, through regression analysis, to assume that teachers’ influence is among the most significant determinant to explain the students’ academic achievement (Rockoff, 2004) leading to an emergent interest and therefore to a growth on the number of studies on how teachers’ characteristics affect the students’ academic achievement (Buddin & Zamarro, 2009; Clotfelter, Ladd, & Vigdor, 2006; Goldhaber & Hansen, 2013; Guarino, Reckase, Stacy, & Wooldridge, 2015; Rivkin et al., 2005). It is without surprise that Hanushek (2011) reports teachers as one the most crucial factors to students’ academic achievement. However, it is important to know which characteristics most likely explain the teacher’ impact on students’ academic achievement. A recent research conducted in Portugal (Sousa, Portela, & Sá, 2003), using data from the period between 2010 and 2012, studied the impact of gender, teacher situation, education level and experience by using as methodology OLS regression analysis, concluded that female teachers have higher influence on students’ academic achievement than males’ teachers and that teachers working away from home have significant negative effects on students’ academic achievement. Advanced degree teachers (Masters or PhDs) seemed to have no effect on the lower or higher students’ performance when compared to those with a graduation degree. Finally, it’s also pointed that teachers with more experience are more effective increasing student achievement gains than those with less experience. The teacher characteristics presented previously suggested that there’s a positive correlation between teacher experience on math and reading results when applied mostly OLS regression analysis (Clotfelter et al., 2006; Croninger, Rice, Rathbun, & Nishio, 2007). In addition, students taught by female teachers scored significantly higher than those taught by male teachers in both mathematics and science as conclude Wößman (2003) after applying WLS regressions. The position of teacher education level is an aspect that does not present a clear consensus, since there are different conclusions. For instance, Croninger (2007) reports positive effects between teachers’ education level and students’ achievement, however, Rivkin (2005) raise serious doubts on this topic.
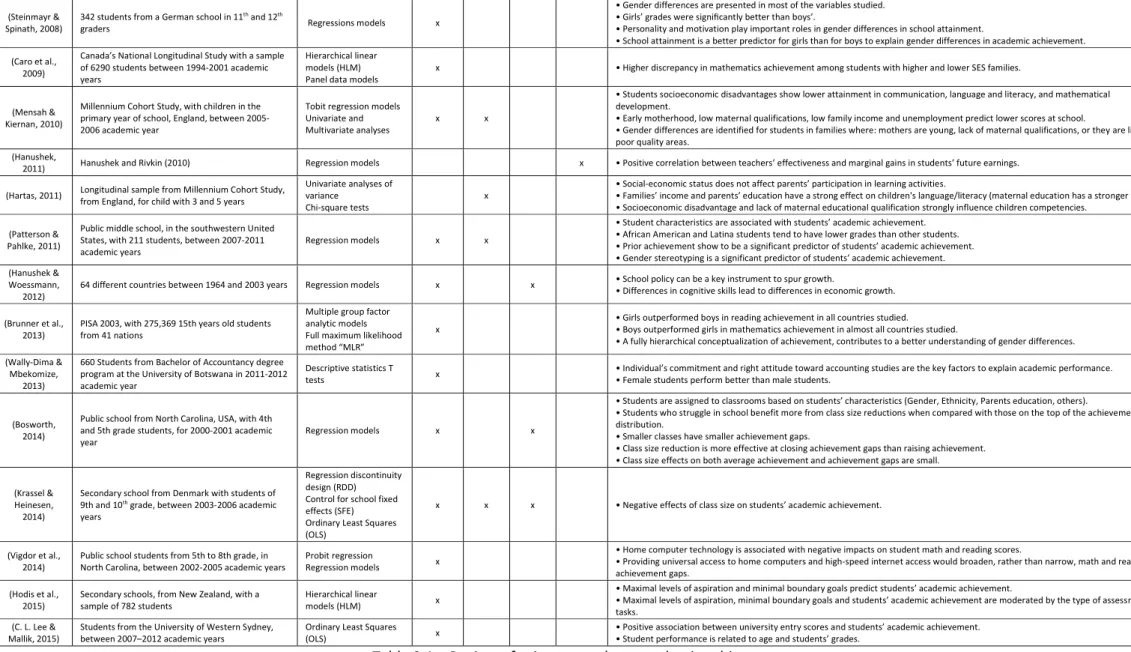
As displayed in the table below, there are few studies applying students, parents, schools and teacher’s characteristics to explain students’ academic achievement. As a way to surpass this lack of information, the purpose of this study is to analyze each of these four dimensions at the same time, although there is no information about teachers’ characteristics as mentioned before.
7
Ref Data Methods Students Parents Schools Teachers Findings
(Hanushek & Kimko, 2000)
Cognitive skills for 39 countries, only 31 countries
have the measurement of economic performance Regression models x x
• International mathematics and science test scores are strongly related to growth of nations. • Direct spending on schools has no relationship to student performance differences. • Home-country quality differences of immigrants are directly related to U.S. earnings. • Mathematics and science skills are relevant for the labor force.
(Hoxby, 2000)
Connecticut, USA: 649 elementary schools with data from 1992-1993 to 1997-1998 and 146 elementary districts with data from 1986-1987 to 1997-1998
Regression models x x
• Class size does not have a statistically significant effect on student achievement.
• Class size reduction has greater effect in schools with more low income or African-American students. • Policy experiments containing incentives produce better results than class reduction.
(Fan & Chen,
2001) Meta-analysis from 25 different studies
General linear model
(GLM) x x
• Positive relationship between parental involvement and students’ academic achievement, when applying GPA. • Parental home supervision has very low relationship with students’ academic achievement.
• Strong relationship between parents’ aspiration/expectation and students’ academic achievement • Low relationship between parental home supervision and students’ academic achievement. (Barnett et al.,
2002)
152 secondary schools from Northern Ireland, between 1994-1995 and 1995-1996 academic years
Linear Programming
techniques x
• Positive relationship between effectiveness-efficiency performance scores and secondary school size. • Larger secondary schools perform better than smaller ones.
(Rockoff, 2004)
10,000 elementary-school students and 300 teachers from two districts in New Jersey. In district A between 1989-1990 to 2000-2001 and district B between 1989-1990 to 1999-2000 academic years
Regression models x • Large differences in quality among teachers within schools.
• Teachers’ experience increases student test scores, particularly in reading subject areas.
(Driessen et al., 2005)
Primary school from the Netherlands, with more than 500 schools and 12,000 students, in 1994-1995 academic year
Frequency, Variance and
Structural models x x x
• No direct effect of parental involvement on students’ academic achievement.
• No direct effect on schools with numerous minority pupils where they appear to provide a considerable amount of extra effort with respect to parental involvement.
(Rivkin et al., 2005)
Public school students from Texas. Data for three
cohorts between 1993-1995 academic year Regressions models x x
• Class size reduction is not a good predictor to explain students’ academic achievement. • Teacher is an important factor to explain school quality.
(Archibald, 2006)
Elementary schools from Nevada, USA, with more than 60,000 students, between 2002-2003 academic year
Hierarchical linear
models (HLM) x x x
• Teacher performance is positively related to students’ academic achievement.
• Per-pupil expenditure at the school level is positively related to students’ academic achievement in reading as it indicates what resources matter for education.
• Student background characteristics matter, at the student level and school level. • School size and school level poverty have negative impacts on both math and reading results. (Jackson et al.,
2006)
140 children from USA, between December 2000
and June 2002 with an average age of 13.8 years Internet recorded x
• Children using more internet have better results in reading achievement than children who used it less. • Despite the age, the use of internet has no effect on students’ academic performance.
(J.-S. Lee & Bowen, 2006)
415 children of 3rd until 5th grade from the southeastern United States in 2004 academic year
Hierarchical linear
models (HLM) x x
• Parents with different demographic characteristics and different types of involvement from dominant groups had the strongest association with achievement.
• Parental homework help was negatively associated with European American students’ academic achievement. • Parent involvement at school and high educational expectations, displayed the strongest relationship with achievement. (Marks et al.,
2006) PISA 2000, over 6,000 schools across 32 countries
Item Response Theory (IRT)
Regression models
x x x
• Cultural factors show to be important to explain socioeconomic inequalities in education.
• Cultural resources play a more important role in socioeconomic inequalities in students’ academic achievement than material resources at home.
• Material and learning infrastructure play a more important role for student performance in mathematics and science than for reading. (Jeynes, 2007) Meta-analysis, from 52 studies, between 1972-2000 Regression models x • Parental involvement has a positive impact on secondary students’ academic achievement.
(Codjoe, 2007) Sample from black students in Edmonton, Canada Interviews x • Home environment and parental support contribute to students’ academic achievement. (Croninger et
al., 2007)
From Early Childhood Longitudinal Study, Kindergarten Class of 1998–1999
Hierarchical linear
models (HLM) x x
• Teachers’ degree type and experience positively affect students’ reading achievement. • Teachers’ qualifications influence students’ academic achievements on reading and mathematics.
(H. Lee, 2007) 80 high schools and 52 middle schools, from USA, with students grades 7 to 12, in 1994
Hierarchical linear models (HLM) Classic lineal regression model
x x x • Peer racial/ethnic composition do not mediate the relationship between school racial/ethnic composition and achievement. • Racial/ethnic composition of schools matters for educational achievement in the USA.
(Lei & Zhao, 2007)
Middle school from Ohio, USA with 237 students, between 2003–2004 academic year
Hierarchical linear models (HLM) ANOVA tests
x
• The quantity of technology use, per itself, is not critical to student learning.
• When the quality of technology use is not ensured, more time on computers may cause more harm than benefit.
8
(Steinmayr & Spinath, 2008)
342 students from a German school in 11th and 12th
graders Regressions models x
• Gender differences are presented in most of the variables studied. • Girls’ grades were significantly better than boys’.
• Personality and motivation play important roles in gender differences in school attainment.
• School attainment is a better predictor for girls than for boys to explain gender differences in academic achievement. (Caro et al.,
2009)
Canada’s National Longitudinal Study with a sample of 6290 students between 1994-2001 academic years
Hierarchical linear models (HLM) Panel data models
x • Higher discrepancy in mathematics achievement among students with higher and lower SES families.
(Mensah & Kiernan, 2010)
Millennium Cohort Study, with children in the primary year of school, England, between 2005-2006 academic year
Tobit regression models Univariate and Multivariate analyses
x x
• Students socioeconomic disadvantages show lower attainment in communication, language and literacy, and mathematical development.
• Early motherhood, low maternal qualifications, low family income and unemployment predict lower scores at school.
• Gender differences are identified for students in families where: mothers are young, lack of maternal qualifications, or they are living in poor quality areas.
(Hanushek,
2011) Hanushek and Rivkin (2010) Regression models x • Positive correlation between teachers’ effectiveness and marginal gains in students’ future earnings. (Hartas, 2011) Longitudinal sample from Millennium Cohort Study,
from England, for child with 3 and 5 years
Univariate analyses of variance
Chi-square tests
x
• Social-economic status does not affect parents’ participation in learning activities.
• Families’ income and parents’ education have a strong effect on children's language/literacy (maternal education has a stronger effect). • Socioeconomic disadvantage and lack of maternal educational qualification strongly influence children competencies.
(Patterson & Pahlke, 2011)
Public middle school, in the southwestern United States, with 211 students, between 2007-2011 academic years
Regression models x x
• Student characteristics are associated with students’ academic achievement. • African American and Latina students tend to have lower grades than other students. • Prior achievement show to be a significant predictor of students’ academic achievement. • Gender stereotyping is a significant predictor of students’ academic achievement. (Hanushek &
Woessmann, 2012)
64 different countries between 1964 and 2003 years Regression models x x • School policy can be a key instrument to spur growth.
• Differences in cognitive skills lead to differences in economic growth.
(Brunner et al., 2013)
PISA 2003, with 275,369 15th years old students from 41 nations
Multiple group factor analytic models Full maximum likelihood method “MLR”
x
• Girls outperformed boys in reading achievement in all countries studied. • Boys outperformed girls in mathematics achievement in almost all countries studied.
• A fully hierarchical conceptualization of achievement, contributes to a better understanding of gender differences. (Wally-Dima &
Mbekomize, 2013)
660 Students from Bachelor of Accountancy degree program at the University of Botswana in 2011-2012 academic year
Descriptive statistics T tests x
• Individual’s commitment and right attitude toward accounting studies are the key factors to explain academic performance. • Female students perform better than male students.
(Bosworth, 2014)
Public school from North Carolina, USA, with 4th and 5th grade students, for 2000-2001 academic year
Regression models x x
• Students are assigned to classrooms based on students’ characteristics (Gender, Ethnicity, Parents education, others).
• Students who struggle in school benefit more from class size reductions when compared with those on the top of the achievement distribution.
• Smaller classes have smaller achievement gaps.
• Class size reduction is more effective at closing achievement gaps than raising achievement. • Class size effects on both average achievement and achievement gaps are small.
(Krassel & Heinesen, 2014)
Secondary school from Denmark with students of 9th and 10th grade, between 2003-2006 academic
years
Regression discontinuity design (RDD) Control for school fixed effects (SFE) Ordinary Least Squares (OLS)
x x x • Negative effects of class size on students’ academic achievement.
(Vigdor et al., 2014)
Public school students from 5th to 8th grade, in North Carolina, between 2002-2005 academic years
Probit regression
Regression models x
• Home computer technology is associated with negative impacts on student math and reading scores.
• Providing universal access to home computers and high-speed internet access would broaden, rather than narrow, math and reading achievement gaps.
(Hodis et al., 2015)
Secondary schools, from New Zealand, with a sample of 782 students
Hierarchical linear
models (HLM) x
• Maximal levels of aspiration and minimal boundary goals predict students’ academic achievement.
• Maximal levels of aspiration, minimal boundary goals and students’ academic achievement are moderated by the type of assessment tasks.
(C. L. Lee & Mallik, 2015)
Students from the University of Western Sydney, between 2007–2012 academic years
Ordinary Least Squares (OLS) x
• Positive association between university entry scores and students’ academic achievement. • Student performance is related to age and students’ grades.
9
3. CONCEPTUAL MODEL FOR UNDERSTANDING ACADEMIC ACHIEVEMENT
The literature review conducted on the previous section allowed us to be aware of the main antecedents of academic achievement. By combining the results of multiple past studies and theories that supported them, we have built a comprehensive research model to shed some light on what drives academic achievement. Based on the literature, we have identified four contexts that may affect academic achievement, namely the characteristics of students, parents, schools and teachers. However, as there are contradictory findings on the literature, and due to data availability, mentioned below, the last one (teachers) was excluded from the context of this study. Hence, within each of the three constructs that are likely to influence academic achievement, some relationships are hypothesized.Gender differences is one of most studied characteristics over the years. In fact, the main conclusions refer that female students obtain better academic results when compared with male students (Mensah & Kiernan, 2010; Steinmayr & Spinath, 2008; Wally-Dima & Mbekomize, 2013) despite these conclusions being more pronounced in some academic areas (Brunner et al., 2013; Ghazvini & Khajehpour, 2011; Steinmayr & Spinath, 2008). Usually females tend to have better academic performance. Therefore, we hypothesize:
H1: Gender will have an impact on students’ academic achievement as females will perform better.
Students’ sociodemographic characteristics, more specifically if the student is native (has the same nationality as the country under study) or immigrant (has other nationality), have been studied from the moment native students have presented better results than immigrant ones (Strand, 2011). In this study, will only be presented if the student has a Portuguese nationality or other. Therefore, we hypothesize:
H2: Native students will perform better on academic achievement.
Computer access is another characteristic that triggers different conclusions. In this context some researchers are less optimistic about the relationship between academic achievement and access to computers (Lei & Zhao, 2007; Vigdor et al., 2014; Wentworth & Middleton, 2014), while the more optimistic consider that computers as a working tool are a benefit for students since we currently live in a digital age and information systems (Borzekowski & Robinson, 2012; Gil-Flores, 2009; Lei & Zhao, 2007; Vigdor et al., 2014). Therefore, we hypothesize:
H3: Students with computer access will perform better on academic achievement.
Internet access is one of the characteristics that has generated more contradictions or less clear conclusions since it can be seen as a distraction, when used excessively (Kubey et al., 2001; Liebert & Chou, 2001), and not for academic purposes, but on the other hand, it can be seen as an added value for the students, providing a wider learning network (Jackson et al., 2006; Torres-Díaz et al., 2016). Therefore, we hypothesize:
10 Although no reference was found between the number of previous students reprove years and the academic achievement in this study, what is being studied is whether the fact that the student having reproved in previous years or not could in fact be a factor that influences students’ academic achievement. Therefore, we hypothesize:
H5: Students that have reproved in the pass will present lower levels on academic achievement in
the future.
Family support from Social Services (SASE) is a social benefit which the main purpose is supporting underprivileged families who have children of school age, guaranteeing equal access opportunities and school success for all students in primary and secondary education levels. It also tries to promote socio-educational support measures for the students of households whose economic situation determines the need for financial contributions for school expenses such as the purchase of books and school supplies, meals and transport (DGE, 2018). What we want to find out is whether the students that receive this kind of support, will be impacted on their academic achievement. Therefore, we hypothesize:
H6: Students that receive support from social services (SASE) will have lower levels on academic
achievement.
Family financial support is a social benefit attributed monthly to families. The objective is to compensate households’ expenses related to the sustenance and education of children and young people. What we want to find out is whether the students that receive this kind of support, will be impacted on their academic achievement (Segurança Social, 2018). Therefore, we hypothesize:
H7: Students that receive family financial support will have lower levels on academic achievement.
Mother education level refers to the level of the academic degree of the mother and is one of the characteristics that present a clear impact on academic achievement (Hartas, 2011; Mensah & Kiernan, 2010), being also one of the variables that is directly linked to the parental SES (Caro et al., 2009; Sirin, 2005; Steinmayr et al., 2010). Father education level refers to the level of the academic degree of the father and is one of the characteristics that seems clear to be interesting to know how can impact the academic achievement, being also one of the variables that is directly linked to the parental SES (Caro et al., 2009; Sirin, 2005; Steinmayr et al., 2010). Therefore, we hypothesize:
H8: Parents education level will have a positive impact on academic achievement.
Class size is the number of students per class. There are several (and to some extent contradictory) conclusions on this topic diverging when it comes to an overall agreement. Although there are researchers who defend that there is no direct relationship between the reduction of number of students per class and the increase of students’ academic achievement (Hoxby, 2000; Wößmann & West, 2006), there are those who argue that students benefit a lot when implementing this measure (Bosworth, 2014; Krassel & Heinesen, 2014; Rivkin et al., 2005). Therefore, we hypothesize:
11 School size is the characteristic that measures the number of students per school. Even though there might be no direct connection between the students’ academic achievement and school size, there are those who defend that larger schools have better student´s results (Barnett et al., 2002). The truth is that a link between the dimension of the schools and students’ results can be found: bigger schools will have bigger classes. With this in mind, we found evidences that prove the opposite: a negative relationship between school size and students’ academic achievement (Archibald, 2006; Egalite & Kisida, 2016; Welsch & Zimmer, 2016). Therefore, we hypothesize:
12
4. METHODOLOGY AND RESULTS
4.1. D
ATATo reach the proposed objectives in this study, with the most reliable and complete data, we used data from MISI data base. The MISI database is the information system where educational data concerning pre-scholar, basic, secondary from public schools under MEC (Ministry of Education and Science) and some types of private schools is collected. Its purpose is to centralize all educational data collection from pre-schools, basic and secondary, as well as provide to the respective institutes the necessary information that will serve as basis to the production of educational statistics to the decisions-making processes. The public education context comprises four programs: employees, accounting, students and school social actions. In the context of this paper, the MISI data base was used to collect all the data from students, parents and schools, however we were not able to retrieve data from teachers resulting in a limitation of this study. To better contextualize the data collected, we also used data from Portuguese National Institute of Statistics (INE) to gather information on the students’ residence area, specifically on population density, monthly average income, percentage average on culture expenses, aging index, residence population and unemployment rate.
All data from the MISI database regarding students, parents and schools was collected at the DGEEC facilities in Lisbon between November 2016 and January 2017. Programming techniques were used to collect them, in this case SQL, namely SQL Server Management Studio tool. For the treatment of the data collected, data analysis techniques were used, recurring to SAS software, more specifically SAS Guide and SAS Miner tools.
After the appropriate data processing it, was also added data from INE source to better contextualize the data. The final database contains a total of 383560 observations, from Portuguese students attending public schools in the years 2014/2015 for 10th, 11th and 12th grades evaluated and
attending the 21 courses where national exams take place, since was excluded Portuguese course reserved to students with severed to profound deafness, so that the analysis would be the most accurate as possible as these comprise the majority of registered students (Gabinete do Secretário de Estado da Educação, 2017), this means: Biology and Geology, Drawing A, Economics A, Philosophy, Physics and Chemistry A, Geography A, Descriptive Geometry A, History A, History B, History of Culture and Arts, Latin A, Portuguese Literature, Foreign Language - German, Foreign Language - Spanish, Foreign Language - French, Foreign Language - English, Mathematics A, Mathematics Applied to Social Sciences, Mathematics B, Portuguese and Portuguese Non Maternal Language.
4.2. D
ESCRIPTIVES
TATISTICS AND NON-
PARAMETRIC TESTSTo better understand the conclusions found on the literature review it is vital to perform tests so that our analysis can be as much accurate and complete as possible. However, it is important to understand the correct distribution followed by the data collected, as it is incorrect to assume that all data follows at first sight a normal distribution. As there were suspicions that our dependent variable, final grade/score, did not follow a normal distribution, a Kolmogorov-Smirnov test was used to verify this hypothesis and the results showed that, in fact, there is a high statistical proof that our dependent variable does not follow a normal distribution as the null hypothesis was rejected with a
13 significance of 1%. Furthermore, it was observed that the variable distribution histogram is asymmetrical, and as so, it supports the previous statement that the variable doesn’t follow a normal distribution.
Test for Normality
Test Statistic P-Value
Kolmogorov-Smirnov D = D = 0,099641 Pr<D <0,0100 Table 4.1 – Normality Test
As we rejected the hypothesis that students’ grade follows a normal distribution, to assure there is no violation of statistical tests’ assumptions, the choice was to analyse the data through non-parametric tests. In this situation, the Mann-Whitney test was used to compare two independent samples, the Kruskal-Wallis to compare more than two independent samples, but also the variances test, called the Conover test that measures if two or more samples have the same variance, i.e., the same asymmetry of final classifications, W.J. Conover said that “nonparametric methods use approximate solutions to exact problems, while parametric methods use exact solutions to approximate problems” (K. M. Ramachandran & Tsokos, 2015).
To begin the explanatory data analysis, we can start by analyzing students’ characteristics on this study: students from Portuguese public high-school, in the years 2014/2015 for 10th, 11th and 12th
grades, evaluated and attending the 21 courses where the national exams take place, as showed on table 4.2.
As it can be observed, more than half the students is female (55.9%) and those whose age is comprised between 16 and 18 years old are the majority (81.5%). Focusing on the number students reprove years, it is possible to observe that from the full student’s sample, the majority has never reproved before 10th (9.4%), 11th (32.5%) and 12th grades (28.5%). The next highest score belongs to
students from 10th, 11th and 12th grades that reproved once (2.6%, 11,8% and 12.6%, respectively). It
is also possible to conclude that the students who present the lowest rate in this variable are registered in the 10th grade students who reproved twice or more (0.2%). Concerning to nationality,
97.2% of the students are Portuguese and only 2.8% come from other country. Regarding computer Figure 4.1 – Final Classification do not follow a
14 access, 71.2% of the students have access to computers, while 28.8% confirm not have computer access. Internet access has very similar results, with 68.6% of students claiming to have access to the Internet, compared to 31.4% who said they did not.
Regarding the results obtained in the Mann-Whitney test, it is verified that there is statistical evidence of the difference on academic achievement between gender, in other words, female students tend to obtain better results on mean values of academic results (13.38) than their male colleagues (12.90). The results obtained in the Conover test indicate that there are greater asymmetries in the final average score of the male students, this means that the scores obtained by male students are more irregular (females with 2.98 and males with 3.04), there are a great number of students who obtained good results and at the same time others who got poorer results.
Concerning the age variable, it is observable, through Kruskal-Wallis test that at least one of the classes tends to achieve statistical different values than at least one of the other classes. Nevertheless, through the Conover, i.e., Variance test, it is possible to conclude that the lowest asymmetries in students’ academic achievement are recorded in the class of students between 19 and 21 years old (2.67), followed by students between 16 and 18 years old (2.99).
Regarding the results obtained in variable N_Reprov, which determine the number of reprove years that the student has until the current year and academic period (2014/2015), Kruskal-Wallis test indicates that within the existing classes of each year there is at least one that registers a higher value, and it is clearly suspected that are the classes of the students that belong to 10th (13.18), 11th
(13.77) and 12th (13.64) that have never reproved a year before. On the other hand, the Conover test
indicates that on the 10th year there are greater discrepancies on the results for students who have
never reproved (3.15), on the 11th on the students who reproved more than twice (3.72) and on the
12th again the category of students who reproved more than twice (3.51).
The statistics tests of the Mann-Whitney test, on variable nationality, show us that there are differences on student's mean values of academic results, with native Portuguese students (13.19) tending to obtain better results in comparison to students of other nationalities (12.37). According to Conover results, both Portuguese and immigrants have equal asymmetries in their school results (3.01).
Regarding students with computer and Internet access, it is possible to conclude that there are differences in their academic achievement when comparing to the ones that do not have access to both technologies. The Mann-Whitney results shows that students who have access to computer (13.17) and Internet (13.20) tend to have better mean values of academic results. However, on the Conover test we observe greater asymmetries in the results of the final average score, obtained among students who have access to computer or internet (3.08).
15
Variables n % Mean SD Mann-Whitney
/Kruskal-Wallis (k) Conover Variance Test Gender Female 62.174 55.9% 13.38 2.98 -2548.4738***1 -2.5849*** Male 49.128 44.1% 12.90 3.04 Age (k) [0-16[ 153 0.2% 13.98 3.46 14072.9362*** 3777.8620*** [16-18[ 90.682 81.5% 13.36 2.99 [19-21[ 19.731 17.7% 11.45 2.67 ]>=21] 736 0.7% 11.74 3.66 N_Reprov by year 10th,0 rep 10.475 9.4% 13.18 3.15 4050.3054*** 372.5845*** 10th,1 rep 2.870 2.6% 11.40 2.93 10th,2 reps 187 0.2% 10.82 2.91 10th, +2reps 209 0.2% 12.08 2.95 11th,0 rep 36.124 32.5% 13.77 2.89 16579.2848*** 2644.0207*** 11th,1rep 13.116 11.8% 11.95 2.65 11th,2reps 976 0.9% 11.09 2.64 11th, +2reps 444 0.4% 11.08 3.72 12th,0 rep 31.725 28.5% 13.64 2.88 9025.3129*** 1871.5462*** 12th,1 rep 13.990 12.6% 11.61 2.67 12th,2 reps 785 0.7% 10.93 2.86 12th, +2 reps 401 0.4% 11.83 3.51 Nationality Portugal 108.134 97.2% 13.19 3.01 730.1785*** -6.0427*** Other 3.168 2.8% 12.37 3.01 Computer 0 32.110 28.8% 13.14 2.84 44.3024*** -37.7989*** 1 79.192 71.2% 13.17 3.08 Internet 0 34.922 31.4% 13.10 2.86 144.2750*** -37.2340*** 1 76.380 68.6% 13.20 3.08
Table 4.2 – Students’ Characteristics
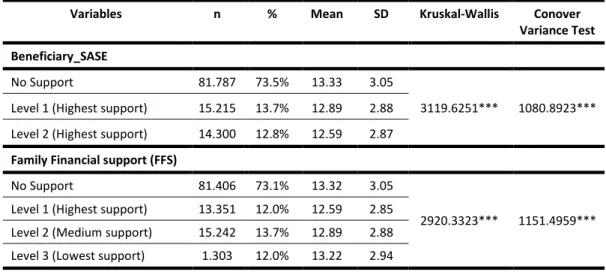
Regarding the descriptive analysis of the parents’ socioeconomic characteristics, presented on table 4.3, it is verified that most students are not Beneficiary_SASE (73.5%), existing a similar distribution among the students with Beneficiary_SASE in levels 1 (13.7%) and level 2 (12.8%). The Kruskal-Wallis test indicates that, in fact, there are differences in students’ academic achievement when comparing the results of mean values of academic results on the three levels mentioned above. According to the results it is suspected that students with no support from SASE are the ones who obtained better results on mean values of academic results (13.33). On the other hand, the Conover test shows that
16 the range where there are greater asymmetries in the results of mean values of academic results is recorded in the students that are not Beneficiary_SASE (3.05).
Observing students who received financial support (FFS), and similarly to the results obtained above, it is verified that 73.1% of the students do not receive any financial support. It is also possible to observe that 12% receive the supports that are established in level 1, with highest financial support, followed by the students from level two (13.7%) and after followed by the students that are included in level 3, the lowest support (12%). The Kruskal-Wallis test indicates that, in fact, there are differences in students’ performance when the results of the mean values of academic results are acquired in the four classes presented. With the results presented above it is suspected that students with no financial support (FMS) are the ones who obtained better results on mean values of academic results. On the other hand, the Conover test indicates that the interval where there are greater asymmetries in the results of the final average classification is recorded in students who do not have financial support at all (3.05).
Variables n % Mean SD Kruskal-Wallis Conover
Variance Test Beneficiary_SASE
No Support 81.787 73.5% 13.33 3.05
3119.6251*** 1080.8923*** Level 1 (Highest support) 15.215 13.7% 12.89 2.88
Level 2 (Highest support) 14.300 12.8% 12.59 2.87 Family Financial support (FFS)
No Support 81.406 73.1% 13.32 3.05
2920.3323*** 1151.4959*** Level 1 (Highest support) 13.351 12.0% 12.59 2.85
Level 2 (Medium support) 15.242 13.7% 12.89 2.88 Level 3 (Lowest support) 1.303 12.0% 13.22 2.94
Table 4.3 – Parents’ Socioeconomic Characteristics
Although there are no results on variables parent’s educational level and parents’ professional characteristics, due to the high number of missing values, it’s possible to conclude, with data provided by students who produced results, that students whose both parents have PhD degree are the ones that have the highest mean values of academic results, opposing those coming from the most disadvantaged socioeconomic families and with a lower educational level (middle school) as the ones that have the lowest mean values of academic results.
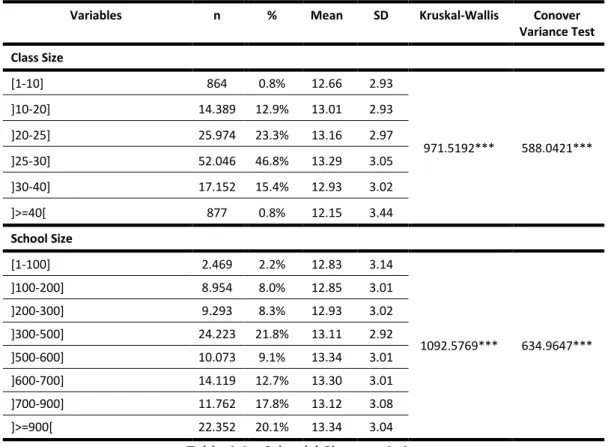
To what refers to schools’ characteristics on table 4.4, more specifically to variable class size, it is verified that most of the students are included in classes between 26 and 30 students (46.8%). The second highest percentage is registered in groups that have between 21 and 25 students (23.3%), followed by classes that have between 31 and 40 students (15.4%). The Kruskal-Wallis test indicates that there are significant differences in the mean values of the students' classification where at least one of the classes obtains better results than the others. According to the results it is suspected that the groups composed between 26 and 30 students score the highest mean values (13.29 values) whereas the class with the lowest mean values is registered in classes with more than 40 students (12.15). The Conover test indicates that the class with the highest mean values asymmetries is the class composed by more than 40 students per class (3.44). On the opposite way, the one with the
17 smallest asymmetries is the smallest classes: 10 or less than 10 students and between 10 and 20 students per class (2.93), followed by classes composed between 21 and 25 students per class (2.97). Focusing on variable school size, it is possible to conclude that the largest proportion of students is registered on schools with a composition between 301 and 500 (21.8%) followed by those registering more than 900 students (20.1%) and finally schools between 701 and 900 students (17.8%). The remaining students’ population is equally spread on schools from other classes. It should be also noted that schools between 601 and 700 students contain 12.7% of students. As for the results obtained through the Kruskal-Wallis test, it is possible to conclude that at least one of the classes obtains higher mean values when compared to the others, and it is suspected that the classes where this occurs are in schools between 501 and 600 students, and with more than 900 students (13.34 for both). With a different outcome, the Conover test indicates that the highest asymmetries occur in classes corresponding to schools that have 100 or fewer students (3.14), followed by those between 701 and 900 students (3.08). In contrast, the range with the lowest asymmetries in the mean values is in schools between 301 and 500 students (2.92).
Variables n % Mean SD Kruskal-Wallis Conover
Variance Test Class Size [1-10] 864 0.8% 12.66 2.93 971.5192*** 588.0421*** ]10-20] 14.389 12.9% 13.01 2.93 ]20-25] 25.974 23.3% 13.16 2.97 ]25-30] 52.046 46.8% 13.29 3.05 ]30-40] 17.152 15.4% 12.93 3.02 ]>=40[ 877 0.8% 12.15 3.44 School Size [1-100] 2.469 2.2% 12.83 3.14 1092.5769*** 634.9647*** ]100-200] 8.954 8.0% 12.85 3.01 ]200-300] 9.293 8.3% 12.93 3.02 ]300-500] 24.223 21.8% 13.11 2.92 ]500-600] 10.073 9.1% 13.34 3.01 ]600-700] 14.119 12.7% 13.30 3.01 ]700-900] 11.762 17.8% 13.12 3.08 ]>=900[ 22.352 20.1% 13.34 3.04
Table 4.4 – Schools’ Characteristics
From within the 21 courses where national exams take place on table 4.5, the analysis will be conducted only on those that constitute the ground basis for the four major type courses on the secondary degree: Science and Technologies, Social-Economic Sciences, Languages and Humanities and Visual Arts – Portuguese, Foreign Languages – English and Philosophy, as well as mandatory school disciplines on the 4 courses mentioned above – Mathematics A, History and Drawing A. From here it is possible to conclude, through the descriptive analysis, as expected, that the subjects with the largest number of students enrolled, are the four subjects of the general formation of the students. The subject with the highest number of students, either female or male, is Portuguese
18 (11.3% and 8.6%, respectively), followed by Philosophy (8.5% and 6.7%, respectively) and Foreign Language – English (8,5% and 7,0%, respectively). The subject with the lowest number of students enrolled is Drawing A, with 1.1% female students and 0.5% male students. Regarding the analysis of the non-parametric Kruskal-Wallis test, it is possible to conclude that at least one of the classes obtains higher mean values, compared to the others, and it is suspected that this situation occurs in the subjects of Drawing A (14.75 for females and 14.14 for male students) and in Foreign Language – English (14.41 for females and 14.51 for male students). On the other hand, the subject that tends to obtain lower mean values is History A (12.50 for females and 12.09 for male students), followed by Mathematics A (13.01 for females and 12.43 for male students) and Portuguese (13.20 for females and 12.30 for male students). The Conover test indicates that, clearly, the subject that registers the greatest asymmetry of results is Mathematics A, for both genders (female with 3.49 and male with 3.56), followed by the Foreign Language – English (female with 3.16 and male with 3.00). Finally, the subject that presents the lowest asymmetry is Drawing A, for the female (2.32) and male (2.42).
Variables n % Mean SD Kruskal-Wallis Conover
Variance Test Courses by Gender Drawing A, Female 4.359 1.1% 14.75 2.32 89.1649*** 1.9836*** Drawing A, Male 2.021 0.5% 14.14 2.42 Philosophy, Female 32.715 8.5% 13.76 2.84 1038.7988*** -6.2612*** Philosophy, Male 25.705 6.7% 13.00 2.83 History A, Female 13.506 3.5% 12.50 2.66 104.3030*** -8.9812*** History A, Male 6.465 1.7% 12.09 2.54
Foreign Language – English, Female 32.701 8.5% 14.41 3.16
15.4312*** -14.2941*** Foreign Language – English, Male 26.645 7.0% 14.51 3.00
Mathematics A, Female 23.757 6.2% 13.01 3.49 314.4330*** -1.5765*** Mathematics A, Male 23.302 6.1% 12.43 3.56 Portuguese, Female 43.285 11.3% 13.20 2.47 2508.7112*** -5.6441*** Portuguese, Male 33.148 8.6% 12.30 2.46
Table 4.5 – Courses by Gender
To what the non-parametric statistical tests is concerned, one limitation should be acknowledged, that is, naturally, also a limitation of the present study. Due to the high number of students, the sample size in the tests is very large, in the order of dozens of thousands. Hence, rejecting the null hypothesis in the non-parametric tests is something very likely to happen, even when the differences have no practical significance.
4.3. D
ECISIONT
REESThe data mining technique applied in this study are decision trees. Decision trees are a data mining technique that are very popular given the fact that there are very easy to interpret and to implement their findings in any human or automated decision-making process. Although they are not among the most powerful methods for prediction, decision trees entail several advantages, especially the one related with the fact that they are non-parametric models, i.e., they have virtually no assumptions whatsoever regarding the data type and its characteristics such as variables’ distributions, outliers or missing values. Decision trees are hierarchical collections of rules that describe how to divide a large