ASSOCIAÇÃO DE POLITÉCNICOS DO NORTE (APNOR)
INSTITUTO POLITÉCNICO DE BRAGANÇA
Using Importance-Satisfaction Analysis in Evaluating Student
Satisfaction: A Case Study of Economics and Administration
Faculty of Qafqaz University
Hikmat Akhundov
Final Dissertation submitted to Instituto Politécnico de Bragança
To obtain the Master Degree in Management, Specialisation in Business
Management
Supervisors:
Paula Odeta Fernandos
Nasimi Kamalov
Karim Mammadov
ASSOCIAÇÃO DE POLITÉCNICOS DO NORTE (APNOR)
INSTITUTO POLITÉCNICO DE BRAGANÇA
Using Importance-Satisfaction Analysis in Evaluating Student
Satisfaction: A Case Study of Economics and Administration
Faculty of Qafqaz University
Hikmat Akhundov
Supervisors:
Paula Odete Fernandes
Nasimi Kamalov
Karim Mammadov
i
Abstract
Education is one of the main industries in the world, which needs to focus more than other types of industries. As Mandela said, “Education is the most powerful weapon, which you can use to change the world” (www.brainyquote.com). Global economic recession era put serious pressure on private Higher Education Institutions (HEI), which resulted as decrease in the university spending`s budget. Therefore, HEI forced to develop more competitive ways to find new financial resources for rapid technological and organizational changes (Savsar, 2012).
Students are the motive of being of Higher Education. The aim of this study is to implement İmportance-Satisfaction Analysis (IPA) matrix to evaluate the student`s satisfaction and assess importance of different attributes in terms of student`s perception. The students that participated in this study enrolled in the present academic year, 2015/2016, in the Economics and Administration Faculty-Qafqaz University.
In order to perform study, survey method applied to collect the data and number of received valid questionnaire were 266. Questionnaire used to collect demographic information of students, identify importance given to each attribute and satisfaction degree of each attribute. Descriptive analysis used to identify profile of respondents, also find satisfaction and importance degree for each attributes. To evaluate differences between groups, built association between variables, find relation between variables and answering to the research hypothesis inferential analysis applied. Moreover, IPA matrix was been used to explore the attributes that needs improvement that perceived as attributes that are more important for the students.
The result showed that generally students are satisfied with service quality offered by HEI-on sample of the Qafqaz University. In addition, research found that there are no differences in overall satisfaction and importance by department, gender, academic year and grade point average. IPA matrix highlighted the main attributes, which performs well, namely Academic Services and Teaching aspects, and in another hand needs to concentrate in Undergraduate program and External Relations. In addition, research found that loyalty of students is very low and there is a negative correlation between loyalty and satisfaction.
ii
Resumo
A educação é uma das principais indústrias do mundo, que precisa de se concentrar mais do que outros tipos de indústrias. Como disse Mandela, a educação é a arma mais poderosa que se pode usar para mudar o mundo. A recessão económica mundial colocou uma pressão elevada sobre Instituições de Ensino Superior privada (IES), tendo resultado uma diminuição no orçamento. Portanto, as IES têm sido forçadas a desenvolver formas mais competitivas para encontrar novos recursos financeiros para rápidas mudanças tecnológicas e organizacionais (Savsar, 2012). Os estudantes são a razão de ser do Ensino Superior. Neste sentido, o objetivo deste estudo assenta em aplicar a matriz e Importância-Performance/Satisfação para avaliar a satisfação dos estudantes e avaliar a importância que os mesmos colocam aos serviços prestados pela IES. Os alunos que participaram neste estudo encontram-se matriculados no presente ano letivo, 2015/2016, na Economia e Administração Faculdade-Qafqaz University.
Para a realização do estudo aplicou-se um inquérito por questionário tendo sido recebidos um total de 266 respostas. O questionário permitiu recolher informações demográficas dos estudantes, identificar importância dada a cada atributo, bem como a satisfação com cada atributo. A análise descritiva utilizada permitiu identificar o perfil dos inquiridos, também encontrar satisfação e a importância para cada atributo. Para avaliar as diferenças entre os grupos, associação entre as variáveis, relação entre variáveis e responder às hipóteses de investigação recorreu-se a uma análise. Além disso, a matriz IPA foi utilizada para explorar os atributos e quais os que necessitam de atenção, na perspetiva dos estudantes.
Os resultados permitiram concluir, globalmente, que os alunos encontram-se satisfeitos com a qualidade do serviço oferecido pela Universidade Qafqaz. Além disso, verificou-se que não existem diferenças na satisfação global e a importância por departamento, sexo, ano letivo e classificação média. A matriz IPA destacou que os atributos Serviços de docência e Serviços académicos, por outro lado devem concentrar as suas forças nos atributos relacionados com os Cursos e Relações com o exterior. Além disso, constatou-se que a lealdade dos alunos são muito baixos e há uma associação menos entre a lealdade e satisfação.
iii
Xülas
ə
Təhsil sahəsi dünyada digər sektorlardan daha çox diqqət cəlb edən bir sektordur. Mandelanın dediyi kimi “Təhsil dünyanı dəyişmək üçün istifadə edə biləcəyin çox güclü silahdır.” (www.brainquote.com) Qlobal iqtisadi tənəzzül dövrü özəl Ali Təhsil Müəssisələrinə böyük təsir etdi və nəticədə universitet büdcəsində azalmalar nəzərə çarpdı. Bunun nəticəsində təşkilati dəyişikliklər etmək və texnoloji yeniliklərdən yararlanmaq üçün universitetlər lazımı maliyyə vəsaitinin tapılması üçün yeni daha rəqabətədavamlı yollar axtarır.
Tələbələr Ali Təhsil Müəssisələrinin əsas motividir. Bu araşdırmanın əsas məqsədi, Əhəmiyyə t-Məmnuniyyət Təhlilindən (ƏPT) istifadə edərək tələbələrin məmnunluğunu qiymətləndirməkdir. Həmçinin, tələbələrin qavrama baxımından müxtəlif atributların əhəmiyyətinin qiymətləndirilməsidir. Araşdırmanı həyata keçirmək üçün sorğu metodundan istifadə olunaraq 266 sorğudan nəticəəldə edilib. Sorğu tələbələrin biyoqrafik məlumatlarını müəyyənləşdirmək və hər bir atributun əhəmiyyət və məmnuniyyət dərəcəsini təyin etmək üçün istifadə edilib. Tələbələrin biyoqrafik məlumatunı analiz etmək üçün təsviri statistikadan istifadə olunub. Qruplar arasında olan fərqlilikləri, dəyişənlər arasındakı əlaqələndirməni tapmaq üçün vəəsas araşdırma hipotezlərini cavablandrmaq üçün təhlili statistikadan istifadəolunub. Bundan başqa, ƏPT matriksindən istifadə edərək inkişafa ehtiyacı olan atributların və tələbələr üçün daha çox əhəmiyyət kəsb edən atributlar müəyyələşdirilmişdir.
Nəticə göstərdi ki, ümumi olaraq tələbələr Qafqaz Universitetinin təklif etdiyi xidmət keyfiyyətindən məmnundurlar. Həmçinin, aydın oldu ki, ümumi məmnuniyyət vəəhəmiyyətdə bölmələr arası, cinsə, tədris ilinə və ümumi qiymət ortalamasına görə fərqlər mövcud deyil. Həmçinin, ƏPT matriksi məmnuniyyət dərəcəsi yüksək olan və daimi investisiya tələb edən, həmçinin əhəmiyyət dərəcəsi yüksək olan və məmnuniyyət dərəcəsi yüksəldilmə imkanı olan atributları ortaya çıxardı. Əlavə olaraq, araşdırma tələbələrin loyallıq dərəcəsinin az olduğunu, hətta məmnuniyyət və loyallıq arasında mənfi əlaqəolduğunu ortaya çıxardı
Açarsözlər: Müştəri Məmnuniyyəti, Əhəmiyyət, Ali Təhsil Müəssisələri, Xidməti Keyfiyyət, Əhəmiyyət-Məmnuniyyət təhlili, Tələbə
iv
Resumen
La educación es una de las principales industrias en el mundo, que debe centrarse más que otros tipos de industrias. Como dijo Mandela, La educación es el arma más poderosa que puedes usar para cambiar el mundo. La recesión económica global pone una fuerte presión sobre las instituciones de enseñanza privada Superior (IES), lo que dio como resultado la disminución en el presupuesto. Por lo tanto, las IES son obligadas a desarrollar formas más competitivas para encontrar nuevos recursos financieros para los cambios tecnológicos y organizativos rápidos (Savsar, 2012).
Los estudiantes son el motivo de ser de la enseñanza superior. El objetivo de este estudio es implementar la matriz de Importancia-Desempeño/Satisfacción (IPA) para evaluar la satisfacción del estudiante y evaluar la importancia de los diferentes atributos en términos de percepción del estudiante.
Los estudiantes que participaron en este estudio están matriculados en el presente año académico, 2015/2016, en la Universidad de Economía y Administración Facultad-Qafqaz. Para realizar el estudio y recoger los datos fue aplicada una encuesta y recibieron 266 cuestionarios. El cuestionario fue utilizado para recopilar información demográfica de los estudiantes, identificar importancia que se da a cada atributo y la satisfacción del grado de cada atributo. Un análisis descriptivo se utilizó para identificar el perfil de los encuestados, encontrar la satisfacción e importancia para cada atributo. Para evaluar las diferencias entre los grupos, asociación entre variables, relación entre variables y para responder a las hipótesis de investigación se hizo un análisis inferencial. Por otra parte, la matriz de IPA fue utilizada para explorar los atributos que necesita mejorar. Los resultados mostraron que en general, los estudiantes están satisfechos con la calidad del servicio ofrecido por la Universidad Qafqaz. Además, encontraron que no hay diferencias en la satisfacción global y la importancia por departamento, género, año académico y promedio de calificaciones. La matriz IPA señaló que la elevada importancia y satisfacción para los atributos de la Enseñanza y de los Servicios académicos, y por otro lado, deben concentrar sus fuerzas en los atributos relacionados con los Cursos y las Relaciones con el exterior. Además, la investigación mostró que la lealtad de los estudiantes es muy baja y hay una asociación entre la lealtad y satisfacción.
v
Acknowledgements
I would like to express my deepest appreciation to my supervisor Phd. Paula Odete Fernandes because of her support and help, Phd. Nasimi Kamalov and Phd. Karim Mammadov for their help and motivation.
In addition, I want to thank to teachers and supervisors of the Economics and Administrative sciences faculty especially, Etibar Huseynli for his help in data collection process. Moreover, I would like to acknowledge students of the Qafqaz University for filling up the questionnaire and students/members of Quality Statistics Society of Qafqaz University for in the process of data collection.
vi
Acronyms
H– Hypothesis
HEI –Higher Education Institution
IPA –Importance-Performance/Satisfaction Analysis M– Mean
O –Objectives
SD –Standard Deviation
vii
Table of Contents
List of Figures ... viii
List of Tables ... ix
Introduction ... 1
1. Literature review ... 3
1.1 Introduction ... 3
1.2 Service Quality ... 3
1.3 Measuring satisfaction ... 10
1.4 Measuring Service Quality in HEI ... 13
2. Research Methodology ... 19
2.1 Objectives of the study and research hypothesis ... 19
2.2 Data collection ... 20
2.3 Data analysis techniques ... 22
2.4 Population vs Sample ... 24
3. Presentation and analysis of results... 26
3.1 Profiles of the respondents ... 26
3.2 Descriptive statistics of the variables in the study ... 31
3.3 Inferential analysis ... 36
3.4 Importance-Satisfaction Analysis and Problematic Areas ... 40
3.5 Suggestions for University Service Management ... 44
Conclusion, Limitation and Future Research ... 46
References ... 48
viii
List of Figures
Figure 1. Customer perceptions of quality and customer satisfaction... 12
Figure 2. Expected Service Quality. ... 14
Figure 3. Service Quality Model. ... 15
Figure 4. Importance-Performance Matrix. ... 18
Figure 5: Distribution of students` by gender. ... 26
Figure 6. Distribution of students` by age group. ... 27
Figure 7. Distribution of students` by region. ... 27
Figure 8. Distribution of students` by study area. ... 28
Figure 9. Distribution of students` by academic year. ... 28
Figure 10. Students` distribution by Academic GPA ... 29
Figure 11. Main source of information about Qafqaz University. ... 29
Figure 12. Is it your first choice to choose Qafqaz University? ... 30
Figure 13. Do you want to continue your study at Qafqaz University? ... 30
Figure 14. Means for Importance and Satisfaction... 35
Figure 15. Importance-Satisfaction analysis for each attribute (Median=3.64; 4.35). ... 42
ix
List of Tables
Table 1. Transition from Goods-Logic to Service-Logic. ... 5
Table 2. Stakeholders of Higher Education Institution. ... 7
Table 3. SERVQUAL five dimensions and definition. ... 16
Table 4. Data Analysis Techniques. ... 23
Table 5. Population and sample. ... 25
Table 6. Cross-tabulation of Region and Main Source of Information. ... 31
Table 7.Descriptive analysis of Importance attributes. ... 32
Table 8. Descriptive analysis of Satisfaction attributes. ... 34
Table 9. Mean and Standard deviation of main attributes. ... 35
Table 10. Overall Satisfaction. ... 36
Table 11. Overall Satisfaction by Department. ... 36
Table 12. Sample size by gender. ... 37
Table 13. Student`s t-test and Levene`s test to identify differences by gender. ... 37
Table 14. Kruskal-Wallis test to identify differences by study area. ... 37
Table 15. Levene`s test and One-Way ANOVA test to identify differences regarding GPA. ... 37
Table 16. Levene`s test and One-Way ANOVA test to identify differences by academic year. ... 38
Table 17. To identify differences in the Master 1st year student. ... 38
Table 18. Do you want to continue your study in "Qafqaz" University and Satisfaction Cross tabulation. ... 38
Table 19. Phi Test to identify positive association between satisfaction and loyalty. ... 39
Table 20. Kruskal-Wallis test to find differences by region. ... 39
Table 21. Means rank for region. ... 39
Table 22. Correlation between satisfaction and importance. ... 40
Table 23. Levene`s Test and t-Test for identifying differences between Bachelor and Master degree. ... 40
Table 24. Location of each attributes in IPA matrix. ... 41
Table 25.Location of main attributes in İPA matrix. ... 43
1
Introduction
The main objective of all companies is to attract new and maintain current customers to develop their business. In this frame, offensive marketing strategies designed to attract new customers, and defensive marketing strategies used to keep the current customer at the company (Erickson, 1993). As the result of growing competition among companies, offensive marketing is very difficult to implement. The cost of attracting the new customer is very high rather than keeping the current customer. In addition, the low growth and high competition are the general characteristics of all industries (Fornell & Wernerfelt, 1987) which makes difficult to attract customers` attention. Therefore, companies need constantly monitor and follow their current customer, understand how company performs from point of customer, are the customers satisfied or not.
As the service provider, Higher Education Institutions (HEI) offer different services to stakeholders of institution and need to have knowledge of the main aspects that influence the decision-making process of potential stakeholders to choose an institution. Since the students are, the main stakeholder of the HEI, institutions need to give more attention to the service quality offered to students; also, satisfaction of the students should be priority.
Taking into consideration the above, main objective of this study is to assess satisfaction of students and importance of different aspects of university services from student’s perception. In addition, evaluate quality of different services offered to students. Moreover, study will examine how student’s satisfaction and importance of different aspects differs in terms of different demographic profile of students such as age, gender, region, study area.
Evaluation of service quality in higher education is relatively new phenomenon. Research related service quality and customer satisfaction has been implemented mainly in commercial organizations. However, there is not so many research made on students satisfaction and service quality in higher education. Therefore, literature review section tries to provide description of the main theoretical frame based on scientific papers, specifically highlighting service quality, measuring satisfaction and measuring service quality in HEI. In addition, this section provides different models for evaluating service quality in HEI.
In research methodology section, primarily research objectives defined and hypothesis determined; further data collection process, data analysis techniques and sampling explained. Data collected using survey method, which includes 42 main questions that categorized to evaluate importance and satisfaction of eight different aspects. In order to know profile of respondents nine questions asked. Sample included 266 questionnaire received from population that consist of 1 322 students.
2
In the last section, frequency analyze applied to analyze respondent’s profile. Descriptive analysis used to find mean and standard deviation of satisfaction and importance dimension. In addition, to find average satisfaction rate and average importance rate for each latent variables. To analyze all research hypothesis inferential analysis used as a tool. İn addition, inferential analysis used to investigate differences, association and relation between variables.
3
1. Literature review
1.1 Introduction
In this section of study, it is going to be reviewed literatures to discuss information of different researchers. In particular, this section seeks uncover and critically analyze concepts from key authors, relevant theories and models, which will help to deeply understand service quality concept, its characteristics and importance, service in higher education institutions (HEI) and etc.
Main ideas assembled under three main sections: Service Quality (Section 1.2), Measuring Satisfaction (Section 1.3) and Measuring Service Quality in HEI (Section 1.4). Service quality section starts comparing service and goods, which is the main ideas in economics then concentrates on defining service in the context of HEI. This is followed by the discussion on stakeholder`s of HEI and definition of service quality concept. Later, determined perceived service quality and service quality concept in HEI. Within this section, debate circles around service quality. In the second Measuring Satisfaction section, attempting to understand importance of satisfaction, uncover loyalty and will focus on relationship between service quality and satisfaction. Finally, in the third section of Measuring Service Quality in HEI section, the study point out the different models for assessing service quality as SERVQUAL, HEDPERF, Perceived Service Quality models. In addition, explore Importance-Performance analyses, which the study will use.
1.2 Service Quality
4
in the education industry, it should give qualified services. The quality of services that university apply differentiate it from its competitors.
1.2.1 Services vs Goods
Goods and Services are the main ideas in economics. Significant difference of service and physical goods are the because of their tangible and intangible factors. On the one hand, goods are the objects or products that have been produced, transported, stored and sold. On the other, service produced within the customer consumption period and service is individualistic action. According to the view of Grönroos (1984) services are also like products which needs more consumer involvement in the process of consumption. He argues that during the process of buyer-seller interaction, so many different activities will get attention of consumer for evaluation. However, he argues that goods should not be treated as services (Gronroos, 1978). Process of goods starts with the manufacturing process, which later sold to customer. Then, bought goods consumed by customer. However, service firstly sold to customer, then produced, at the end consumed by customer (Berry, Zeithaml, & Parasuraman, 1985). In their research Parasuraman, Zeithhaml and Berry (1985) defined three specification of service as intangibility; heterogeneity; inseparability.
Intangibility: For the truth, majority of services are intangible. The service cannot be seen, tasted, felt even some of them cannot be touched. The service cannot be tested before buying for quality assurance. Furthermore, it cannot be illusttrated or displayed.
Heterogeneity: Service differs from customer to customer even service purchased today could be different from yesterday`s. There could be difference between same service produced by different producer which makes service heterogeneous.
Inseparability: Production and consumption of goods mostly occurs in different places. However, most services purchased whenever they produced. Consumer or producer cannot separate production of service from its purchase.
Previously, goods were produced more than services because the assessment of service`s quality was harder than goods quality. However, nowadays, all big economies producing virtually more services and exchanging them more than goods (Vargo & Lusch, 2008).
In their research Vargo and Lusch (2004, p.5) brought new concept to marketing literature on goods and services. According to this study, they suggest that goods-centered view primitively propose following:
1. The purpose of economic activity is to make and distribute things that can be sold. 2. To be sold, these things must be embedded with utility and value during the production
and distribution processes and must offer consumer the superior value agains other offers.
5
4. For both maximum production control and efficiency, the good should be standardized and produced away from the market.
5. The goods can then be inventoried until it is demanded and then delivered to the consumer at a profit.
Furthermore, service companies always want to improve their service better serv their customers. The service-centered view sees marketing as a continuos learning process and according to them service-centered view concentrates on the following issues:
1. Identify or develop core competences, the fundamental knowledge and skills of an economic entity that represent potential competitive advantage.
2. Identify other entities (potential customers) that could benefit from these competences. 3. Cultivate relationships that involve the customers in developing customized,
competitively compelling value propositions to meet specific needs.
4. Gauge marketplace feedback by analyzing financial performance from exchange to learn how to improve the firm’s offering to customers and improve firm performance. (Vargo & Lusch, 2004, p. 5).
In their further research, Vargo and Lusch (2008, p.258) have offered six different way of transitioning from Goods-Logic to Service-Logic, which can be seen in Table 1.
Table 1. Transition from Goods-Logic to Service-Logic.
Goods Logic Service Logic
Making Something (Goods or services) Assissting customer in their own value-creation processes
Value as produced Value as co-created
Customers as isolated entities Customers in context of their own networks Firm resources primarily as operand Firm resources as operant
Customers as targets Customers as resources
Primacy of efficiency Efficiency through effectivenes Source: Vargo and Lusch (2008, p.258).
In short, it can be infered that in their nature service and goods are different. Although, there are little similarities regarding both of them offered for gaining profit, offered by organization, differences from view of customer and firm more than similarities.
1.2.2 Higher Education as a Service
6
For the management of Higher Education Institutions it is necessary to apply market–oriented strategies and principles, which used in profit-making institutions (Deshields, Kara, & Kaynak, 2005). Institutions perceive the importance of higher education as a service, therefore putting attention on satisfying student needs and meeting their expectations (Deshields, Kara, & Kaynak, 2005). According to the views of Oldfield and Baron (2000, p.86) higher education can observe as a “pure” service. Institutions should be more service oriented and act with their students as a customer for satisfying their needs (Gruber, Fub, Roediger, & Glaser-Zikuda, 2010). There are debate among researchers that students are customer or not. Introduction of tuition fees changes status and attitude of student to customer and expectation of them as other consumer of service sectors (Temizer & Turkyilmaz, 2012).
There is a competition in higher education market and quality of services delivered differentiate an institution from their competitor. As the service provider, higher education institutions needs to provide service that exceeds students expectation, which does not automatically rather, it should be intentiaonally managed.
1.2.3 The Stakeholder of HEI
Emphasizing the qualification of Higher Education Institution as a service, it is important to stress that Higher Education Institution, like other organizations, have many different stakeholders with several interest and needs.
Definition of stakeholder and its meaning creates a big dilemma among researchers that what kind of entity should be stakeholder. For better understanding stakeholder in the context of higher education, primarily it is important to define stakeholder. Common sense seems to dictate that groups, people, institutions, organizations, natural environments are generally could be potential or actual stakeholder (Mitchell, Agle, & Wood, 1997). First and early definition, which is very important today, ensured by Freeman (1984, p.46) as: “Any group or individual who can affect or is affected by the achievement of the organisation objectives.”
7
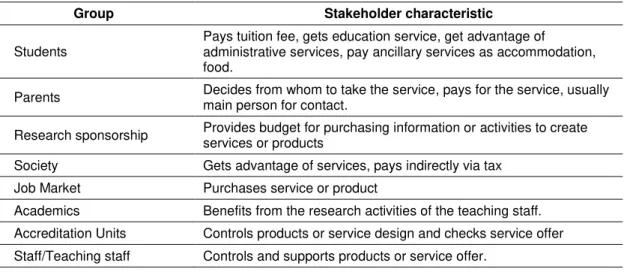
When public support for the private Higher Education Institutions decreases, significance of external stakeholder increases (Benneworth & Ben, 2010). For the Higher Education Institutions, essential thing is not only to detect their stakeholder but classify and rank them. To identify, which partners and customers are important for the future success, for the mission of the university (Kettunen, 2014). When it comes to the topic of stakeholders of Higher Education Institutions`, most of the researchers agree with the stakeholders of HEI as described in Table 2.
Table 2. Stakeholders of Higher Education Institution.
Group Stakeholder characteristic
Students
Pays tuition fee, gets education service, get advantage of
administrative services, pay ancillary services as accommodation, food.
Parents Decides from whom to take the service, pays for the service, usually main person for contact. Research sponsorship Provides budget for purchasing information or activities to create
services or products
Society Gets advantage of services, pays indirectly via tax Job Market Purchases service or product
Academics Benefits from the research activities of the teaching staff. Accreditation Units Controls products or service design and checks service offer Staff/Teaching staff Controls and supports products or service offer.
Source: Sahin (2009, p. 107).
Identifying the main stakeholder of the HEI are very difficult (Cuthbert, 1996). However, according to the view of different researchers, student is the primary and important stakeholder of the Higher Education Institutions. Beside the students are main stakeholder of universities, they already play a key role in delivery and production process of service (Hill, 1995). The satisfaction rate of students and parents is comparable to the prestige of the university and related with expected income and employment after graduation (Moraru, 2012). Therefore, universities should take into consideration student’s expectation while building strategic development plans and policies. Aim of universities is to take part in top positions in university ranking, basically, increasing student satisfaction to highest point and decrease dissatisfaction rate to minimum and consistently become preferred by the student (Sahin, 2009).
This part of study endorse that there are many different stakeholders in higher education. However, the main focus group for this study is the student as the leading stakeholder of the Higher Education Institutions.
1.2.4 Defining Service Quality
8
that an organization providing services can achieve and arises from the contribution of all activities directly or indirectly related to the conception and development of the service". According to the view of Baron, Harris and Hilton (2009) “Service quality is the single most researched area in services marketing to date”.
Description of quality according to Peter Drucker (1985) is not what producer puts in product or service but it is something customer gets out and is willing to pay for. Lewi and Booms (1983) explained service quality as a unit of measurement of how service delivered to customer and how it met with the expectation of customer. Zeithaml, Berry, and Parasuraman (1988) in their research mentioned service quality as the difference between consumer perception and expectation. Service quality concept should be approached from the view of customer because they have different assessment, conditions and values.
As the suggestion of Parasuraman, Zeithhaml and Berry (1985) there are 10 determinants of service quality as: Reliability, Responsiveness, Competence, Acces, Courtesy, Communication, Credibility, Security, Understanding/Knowing Customer, Tangibles. They also mention that some of determinants can be combined. Moreover, according to the study of Berry, Parasuraman and Zeithaml (1988, p. 37) service quality assessed by customer comparing expectation to actually what they get and defined, could be combined into the 5 determinants of service quality as :
Tangibles: Facilities, physical equipment, personnal appearance;
Reliability: the ability to perform the desired service dependably, accurately and consistently;
Responsiveness: the willingness to provide prompt service and help customers;
Assurance: employees` knowledge, courtesy and and ability to convey trust and confidence;
Empathy: the provision of caring, individualized attention to customers.
9
1.2.5 Perceived Service Quality
“Perceived service quality is the result of the consumer`s comparison of expected service with perceived service.” (Parasuraman, Zeithhaml, & Berry, 1985, p. 47). According to this view, consumer compare the expectation of service quality that is prior to receiving service with their own perception, which is the actual received service. If the expectations of customer met, then perceived service quality can be satisfactory, on the contrary, if the expectation of customer unmet then satisfaction will be less. In addition, if the service is more than expectation, in that case customer perceived service quality can be more than satisfactory (Berry, Zeithaml, & Parasuraman, 1985). According to the study of Clemes, Gan, Kao and Choong (2008) there is a relation between overall satisfaction and perceived service quality.
Perception of service quality is different according to various parties. In the Section 1.2.3 it was concluded that different stakeholder`s perception about service quality are not same as institutions perception, which results failure in the evaluation of service quality. Furthermore, Cuthbert (1996) suggest in his research that expectation of students are differ according to different years and monthes.
1.2.6 Service Quality in HEI
10
1.3 Measuring satisfaction
1.3.1 Importance of Satisfaction
Today globalization affect the economies all over the world. Organization focus point changing from profit maximization to maximize the profit through the customer satisfaction (Seth, Deshmukh, & Vrat, 2005). When consumer or customer is pleased with the goods or services, it has called satisfaction. Customer happiness is the main signal of customer satisfaction. Evaluating customer satisfaction is very hard, because it is the human feelings.
Nowadays delivery of service as important as process. The concept of loyalty and satisfaction of student have attracted much interest in recent years and turn out as one of the major goals of all educational institutions. The main motivation for the growing emphasis on student satisfaction is that increase in the student satisfaction leads to a stronger competitive position resulting in attracting future students and keeping the existing ones (Temizer & Turkyilmaz, 2012). Satisfaction of the students should considered as the priority by the institutions due to intensive competition among competitors, internationalization spirit and day-by-day increase in the expectation of the students towards higher educational institution (Sudharani, Ravindran, & M, 2012). Furthermore, from research perspective, education institutions sector represents a very interesting discipline to examine, because one would to know the level of education provided and satisfaction of students.
The researches highlights that satisfaction is comparing level of expectation and perceived performance. Expectation of student can start before they enrolled to institution; therefore, it is important for researcher firstly to define what the students expect from higher education institution (Palacio, Meneses, & Perez, 2002). In contrary, many researchers believe that satisfaction is the level of expectation and perception during university years. However, many researcher faces problem of creating definition for the student satisfaction because, many studies focused on commercial customer satisfaction therefore, there is a big question that to put student as customer or not (Hom, 2002).
1.3.2 Loyalty
11
emotional extension to the product or service, which was high compared to other market alternatives. Next one is to repeat purchase (Griffin, 1995). Features of loyal customers could be summarized as follow:
Price sensitivity of loyal customers are less;
Serving to loyal customers are cheaper;
Loyal customers give affirmative recommendation on their most-loved brand;
Loyal customer don`t buy product of other company`s;
Loyal customers repurchase.
The main goal of any companies is to make profit and increase profitability over times. Loyalty of customer is one the way to achieve this goal. Loyal customer keep in touch with their favorite firms for years and spend large share of their budget to company.
In higher education, to establish loyal customers, institutions requires to establish good relationship with the students who provides financial base for the higher education institutions. Specifically, for gaining competitive advantage student loyalty is the main strategy because, finding new students are more expensive than keeping existing ones (Rofas-Mendez, Vasquez-Parraga, Kara, & Cerda-Urrutia, 2009). It apparently assumed that loyal student may compensate after graduation as alumni or may continue their next study at the same institute. Indicators of loyal student specification could be:
Student ready to recommend higher education Institution;
Student ready to choose same higher education institution again;
Student ready to recommend the study programme of institution.
According to research of Jones and Sasser (1995) while satisfaction rate increases customer loyalty also tends to increase. Therefore, to create loyal customers and keep those customers over time, it is necessary to satisfy the customer needs and wants.
1.3.3 Relationship between Service Quality and Satisfaction
12
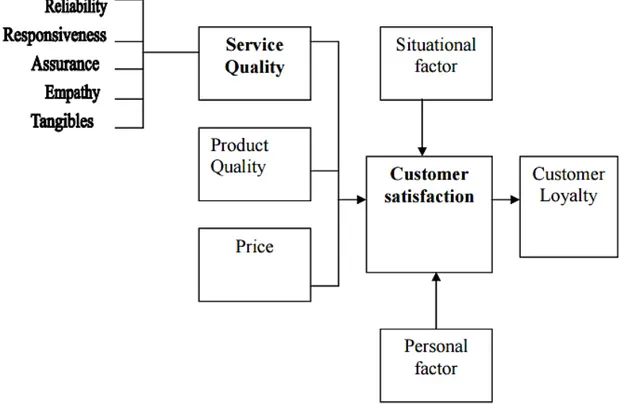
The below Figure.1 shows the relationship between satisfaction and service quality. According to view of the author “service quality is a focused evaluation that reflects the customer’s perception of reliability, assurance, responsiveness, empathy and tangibility while satisfaction is more inclusive and it is influenced by perceptions of service quality, product quality and price, also situational factors and personal factors” (Wilson, Zeithaml, Bitner, & Gremler, 2008).
Figure 1. Customer perceptions of quality and customer satisfaction. Source: Wilson, Zeithaml, Bitner and Gremler (2008, p.79).
Parasuraman, Zeithhaml and Berry (1985) pointed in their research that while perceived service quality is high, customer satisfaction will also increase. Most of the researcher agree with this idea that there is a gap between customer expectation and the perceived value of the customer. When this gap decreases, in other words, when the perceived value exceeds expectations then customers of certain product or services will be satisfied. However, when customer`s perceived value does not meet with expectations in that case customers will be dissatisfied. In addition, with the dissatisfied customers it would be very hard for the organizations to survive in competition based econnomy. Therefore, to gain high satisfaction rate from customer, to establish loyal customers organization depends on offering high quality of services.
13
responsiveness, reliability, assurance and empathy have a big relationship with the student satisfaction (Hasan, Ilias, Rahman, & Razak, 2008).
1.4 Measuring Service Quality in HEI
Scientists and scholars show intense effort to evaluate precisely service quality and better figure out its necessary antecedents and result in order to set up methods for accurately improving quality to catch up competitive advantage and make customer loyalty (Abdullah, 2006). Furthermore, so many distinction arise among researchers regarding the measurement of service quality (Abdullah, 2006). Parasuraman, Zeithhaml and Berry (1985) view`s are that service quality are very difficult to describe. This is because of intangibility of service, for the consumer it more easy to evaluate goods quality than service.
There is less tools for evaluating students satisfaction in HEI. However, as students have taken fee payer and higher education as service provider, it could applied the tools which were developed for commercial organization to the education industry.
1.4.1 Models for assessing Service Quality
To gain competitive advantage organization needs to use latest technology to collect information about market demands and exchange it among organizations and aim of this exchange is to increase knowledge about service quality (Seth, Deshmukh, & Vrat, 2005). Managers and researchers always tend to know detail about components of service quality for the customer satisfaction, to increase profitability. Notion of models tries to identify and show the relationship, which, exist between main factors (Ghobadian, Speller, & Jones, 1994).
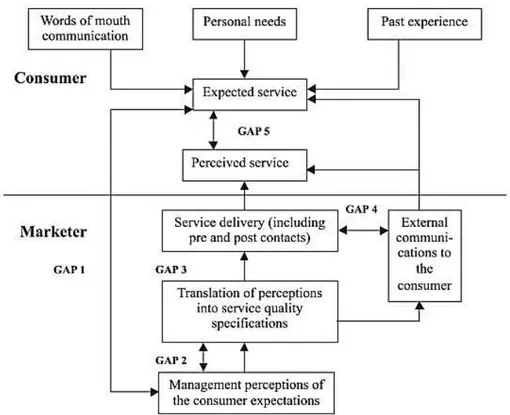
There is many models, which helps to assess service quality. GAP model`s (Parasuraman, Zeithhaml, & Berry, 1985) authors` suggest that service quality is the difference between customer expectation and performance along the quality dimension. They developed service quality model according to analysis of GAP model. In the GAP model researcher found several gaps in service marketer`s side as:
Consumer expectation-management perception gap;
Management perception-service quality specification gap;
Service quality specifications-service delivery gap;
Service delivery-external communications gap;
Expected service-perceived service gap.
14
1.4.2 The Perceived Service Quality Model
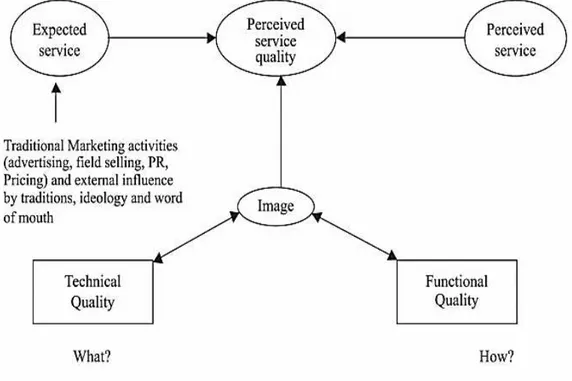
Grönroos (1984) suggests that expected service and perceived service are the two dependent variables of perceived service quality. Author argues that customer puts expected service vs perceived service and in the result perceived service quality comes across. For satisfying customer the author suggest to match perceived service with the expected service. The author defined “technical quality”, “functional quality” and “image” as three components of service quality.
Figure 2. Expected Service Quality. Source: Grönroos (1984, p. 40).
15
1.4.3 The SERVQUAL model
The SERVQUAL model suggested by Parasuraman, Zeithhaml and Berry (1985) in which proposed that service quality is the difference between expectaion of customer and their perception. SERVQUAL model developed on the base of GAP analysis. As in the shown Figure 1, there were five gaps suggested. According to this view service quality is the difference between perception expectation. Authors have an idea that perceived service quality is relying on the size of the gap between expectation and perception. Whenever, gap is small level of service quality is high.
Figure 3. Service Quality Model.
Source: Parasuraman, Zeithhaml and Berry (1985, p. 47).
In their study, Parasuraman, Zeithhaml and Berry (1985) suggested 10 components of service quality. Later, Berry, Parasuraman and Zeithaml (1988) decreased this components into five dimensions (see Table 4). The SERVQUAL model included 22 items, asking expectations related to service quality of organization from the customers. The model combined with the five dimensions.
16
and Fazlic (2015) found that there is a negative gap between students` expectation and perception of service quality.
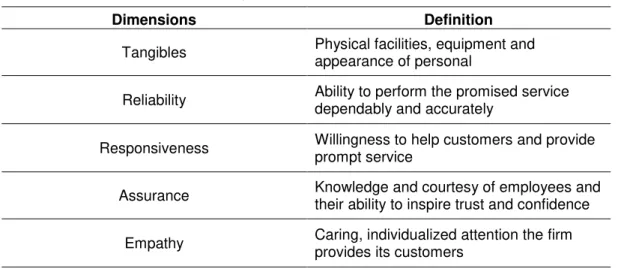
Table 3. SERVQUAL five dimensions and definition.
Dimensions Definition
Tangibles Physical facilities, equipment and appearance of personal
Reliability Ability to perform the promised service dependably and accurately
Responsiveness Willingness to help customers and provide prompt service
Assurance Knowledge and courtesy of employees and their ability to inspire trust and confidence Empathy Caring, individualized attention the firm
provides its customers Source: Parasuraman, Zeithaml and Berry (1988, p. 23).
1.4.4 The SERVPERF model
SERVPERF model developed by Cronin and Taylor (1992) to criticize SERVQUAL model. In their research, authors maintain main objective that current operationalization and conceptualization of SERVQUAL model is insufficient. As the second objective writer mention emprically to examine relationship between consumer satisfaction and service quality (Cronin & Taylor, 1992). SERVPERF model or “performance-only measures” refers to service quality and evaluates only consumers` perception of the performance of organization or service provider. On the contrary SERVQUAL model examines gap between consumers` expectation and perception.
Result of emprical study reported that reliability and validity offered by SERVPERF model better than SERVQUAL, which shows that expectation could be ignored (Cronin & Taylor, 1992). However, in response of Parasuraman, Zeithaml and Berry (1994) suggested that for the validity SERVQUAL performs as well as SERVPERF model on each criteria. In addition, the result of their study suggested that SERVPERF model perform better than SERVQUAL but recommended to use gap model because of better diagnostic capacity.
Taking into consideration all these studies, the research will focus on the collecting data of students` perceptions, not the expectation at all.
1.4.5 HEDPERF model
17
determinants in HEI, therefore developed HEDPERF model. For developing this model, author took SERVPERF model as a base, assimilated perception-only approach.
1.4.6 Importance-Performance/Satisfaction Analysis
For increasing customer overall satisfaction Importance-Performance Analysis is the useful and simple techniques, which can help managers to explore the attributes that can be improved (Silva & Fernandes, 2011). Martilla and James (1977) to evaluate elements of marketing program found Importance-Performance Analysis (IPA). Authors suggest that for developing marketing strategies, IPA provides useful information. For instance, which features an organization needs to invest more resources and identifies features that take more resources than others do. In addition, Martilla and James (1977, p.79) argue that “It is a low cost, easily understood technique that can yield important insights into which aspect of the marketing mix a firm should devote more attentian as well as identify areas that may be consuming too many resources”. Further, IPA model identifies aspects that performance is low and requires improvement also which aspects important for customers. In addition, IPA tool specifies aspects, which has high effect on customer satisfaction.
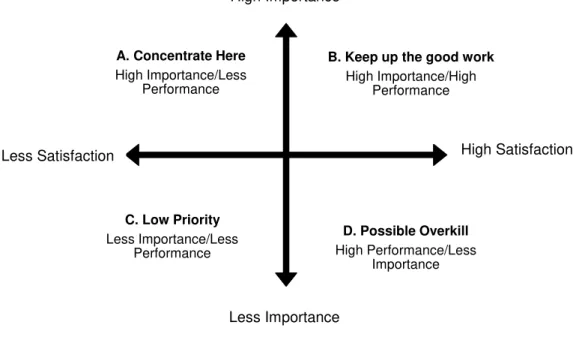
The IPA tool acknowledge satisfaction as the factor of two components: Importance of the products or services offered by and performance of organizations in providing these services (Martilla & James, 1977). In other words, it evaluates satisfaction of customer according to two factors: Importance of aspects from view of customer and Performance of these aspects. After, separately showing the importance and performance, IPA tool demonstrate overall satisfaction. This tool classifies different aspects into four categories for setting priorities.The four categories are: “Concentrate here”, “Keep up the good work”, “Low priority”,“Possibleoverkill”, which are shown in Figure 4. Each quadrant offers different strategies for the management in order to identify weaknesses for improving to get high customer stisfaction.
Quadrant A. “Concentrate here” quadrant represents arear in which attributes are important and performance could be improved. Producing maximum results constructive action should be concentrated.
Quadrant B. “Keep up good work” quadrant indicates competitive advantage of product or service and strengths. Attributes situated in this area performing well and need continued investment (Sever, 2015).
Quadrant C. “Low priority” quadrant illustrate that attributes are not performing well, but is not considered important for the customer. Therefore, management should not extremely focus on this area.
18
Figure 4. Importance-Performance Matrix. Source: Martilla and James (1977, p. 78).
There are four stage included in IPA tool. First stage is to define the aspects to measure. In the second stage, required to separate performance and importance measures. Next stage is to calculate means for importance and performance of each aspect and scheme on the vertical and horizontal axes of the matrix. In the fourth stage, analyze importance-performance grid (Deacon & Du Rand, 2012).
Importance-Satisfaction analysis improved on the base of Importance-Performance Analysis. Importance-Performance/Satisfaction analysis made confusion among researcher`s because of littler differentiation between performance and satisfaction. Main distinction was that satisfaction could be used instead of performance. Are these definitions give same meaning or they are different? Baker and Crompton (2000) states that previously performance and satisfaction have been used interchangeably. Therefore, authors explained differentiation as performance evaluates providers` output on the contrary satisfaction examines visiters outcome. Common sense seems to dictate that satisfaction become main assessment for service quality. Therefore, performance exchanged with satisfaction (Tonge & Moore, 2007; Aktas, Aksu, & Çizel, 2007). IPA tool used for evaluating student satisfaction in HEI by many researcher (Silva & Fernandes, 2011; Ford, Joseph, & Joseph, 1999 and etc.).
A. Concentrate Here
High Importance/Less Performance
B. Keep up the good work
High Importance/High Performance
C. Low Priority
Less Importance/Less Performance
D. Possible Overkill
High Performance/Less Importance
Less Importance
Less Satisfaction High Satisfaction
19
2.
Research Methodology
After reviewing literatures related to service quality, satisfaction and different models for assessing service quality in HEI, in this section, represented methodologies used to point out study. This section divided into four parts. First, part will show aim and objectives of the study. Main questions should be answer: What is the aim of this study? What is going to be done in this study? What is the objective of the study? How is going to do? Then, research hypothesis will be defined. In the second part, it will be explained procedures for collecting data, reliability of collected data. Data collection process will be explained. Methods that was used to collect data. Later, in the third part, it will be clarified the techniques for analyzing data. At the end, population and final sample size will be shown and explained.
2.1 Objectives of the study and research hypothesis
Researchers suggest that fundamental purpose of the research is to find answers to the questions with the application of scientific source. In literature review part presented so many different views of different researcher`s. The previous section has raised so many questions and numbers of objectives, these objectives are being studied and answered in this research. The primary purpose of this study is to explore students` perceptions of service quality and their satisfaction rate. Aim of this research is to find how different aspects important for Economics and Administrative sciences and Industrial Engineering department of Qafqaz University, by the perception of undergraduate and master students and do they satisfied or not? In addition, to evaluate satisfaction rate of students according to the different aspects. Does the student satisfaction varies based on different aspects or not? Which aspects more important for the students and which of them are less important? Additionally, study examined whether there is a relation between different demographic factors and aspects.
20
(O1): To assess importance of different aspects in terms of student`s perception. (O2): To determine student`s satisfaction according to different aspects.
(O3): To reach overall satisfaction of student`s within the given service in terms of different aspects.
(O4): Identifying satisfaction dissimilarities in students` perceptions of service across different departments.
(O5): To give suggestions to the management of university to improve service quality provided to students.
(O6): Identify loyalty of students.
(O7): Identifying positioning of each attributes in IPA matrix.
The findings from this study will fill the gaps related to students` satisfaction and importance of different aspects perceived by students.
Based on the objectives of the study main research hypothesis (H) of the study are: H1: There are differences in overall satisfaction and importance by gender.
H2: There are differences in overall satisfaction and importance by study area.
H3: There are differences in overall satisfaction and importance regards overall grade point average (GPA).
H4: There are differences in overall satisfaction and importance by academic years (Bachelor and Master Degree).
H5: There is a positive association between overall satisfaction and loyalty. H6: There are differences in overall satisfaction and importance related to region. H7: There is a positive relationship between the satisfaction level and importance level. H8: Main attributes will be positioning in quadrant B, “Keep up the good work” in IPA matrix. H9: There are differences in overall satisfaction and importance between Bachelor and Master Degree.
2.2 Data collection
21
research argued that there are many disadvantages of online data collection. Firstly, resarchers` lack of control over the environment where study is being taken. There is a possibility that respondent answer wrongly regarding to demographic questions, or can take the survey more than one time. On the contrary, in the paper based data collection study completed inside the class with the supervision of the teachers. Therefore, for this study paper based data collection method chosen. It would be very hard to supervise students while completing online survey.
2.2.1 Design of Questionnaire
For selecting different determinants of students satisfaction, the study choose previous literature as a base (Joseph & Joseph, 1997; Alves, 1998; Pike, 2004; Silva & Fernandes, 2011). Questionnaire consists of two parts. In the first part nine demographic questions asked from the respondents (see appendix).
a. Quality of General Aspects: Which includes questions about Modern facilities, clean facilities, Sport facilities, Cultural activities, Association of students.
b. Quality of Library: Easy access to shelves, Ways of consulted rapidly, Warmth of its staff, Interest in solving the problems of student.
c. Quality of Computer Laboratory facilities: Availability of laboratories and computer facilities, Ability to use after classes, Existence training in computer tools.
d. Quality of Social Services: Financial aid for students, Existence of medical support to students, Availability of accommodation for students, Existence of canteens, Knowledge of rules and procedures, Trust and safety in services, Information service completion, Interest in solving the problems of student, Simple rules and procedures, Warmth of its staff.
e. Quality of Academic Services: Simple procedures, Knowledge of rules and procedures, Interest in solving problems of student, Trust and safety in service, Information service completion, Quick response, Warmth of its staff.
f. Quality of Teaching Aspects: Friendliness of the teachers, Personalized attention, Easy communication with teachers, Clarity and precision in the exposure of knowledge, Scientific expertise of teacher, Fair assessment, Advice the basic bibliography
g. Quality of Undergraduate Programs: Updated content, Several career opportunities h. Quality of External Relations: Getting the internships, Exchange programs with foreign
universities, Conferences and seminars, Internet connection
Before, starting to collect data explanation about research given to administrative of faculty, make clear that why the data are required. Then, for completing questionnaires supervisors provided clear and unambiguous instruction for the students. After completing all questionnaires by the students, all data entered to SPPS for analyzing.
22
All questions in the second part were measured with the a five-point Likert scale:
- For Satisfaction dimension: 1 - Strongly Disagree; 2 - Disagree; 3 - Neither Disagree nor Agree; 4 - Agree; 5 - Strongly Agree.
- For Importance dimension: 1 - Very unimportant; 2 - Unimportant; 3 - Neither important nor Unimportant; 4 - Important; 5 - Very Important.
2.2.2 Reliability
“Reliability is concerned with the consistency of test results over groups of individuals or over the same individual at different times” (Smith & Albaum, 2013). Reliability as a term means how “repeatability” or“consistency”. For measuring reliability of the scale, there are three methods: test-retest, alternative forms and internal consistency (Smith & Albaum, 2013). In the research, used internal consistency method. In which, should be calculated Cronbach`s alpha. If Cronbach`s alpha:
α
> 0.9 it can concluded that questionnaires reliability is very good. 0.9>α>0.8 it can concluded that questionnaires reliability is good. 0.8> α>0.7 it can concluded that questionnaires reliability is reasonable. 0.7> α>0.6 it can concluded that questionnaires reliability is weak. α<0.6 it can concluded that questionnaires reliability is inadmissible.It was applied reliability test for the satisfaction questions on SPSS software, which the number of questions is 42. According to the result of test, Cronbach’s alpha is equal to 0.939, which is more than 0.9 that shows reliability of questions related to importance dimension is very good. In addition, Cronbach`s alpha for the satisfaction dimension is equal to 0.946, which is also more than 0.9 that show reliability is very good.
2.3 Data analysis techniques
23
respectively. In addition, other closed questions type coded with the numbers and added to SPSS.
Table 4 highlights objectives, research hypothesis, and the techniques were used to analyze the data.
Table 4. Data Analysis Techniques.
Label Objectives or Research Hypothesis Data analysis technique
O1 To assess importance of different aspects in terms of
students` perception. Frequency tables
O2 To determine students` satisfaction according to
different aspects. Frequency tables
O3 To reach overall satisfaction of students` within the
given service in terms of different aspects. Mean and Standard Deviation
O4 Identifying satisfaction dissimilarities in students`
perceptions of service across different departments. Mean and Standard Deviation
O5 To give suggestions to the management of university
to improve service quality provided to students. IPA Matrix
O6 Identifying loyalty of students. Graph with relative and absolute frequencies
O7 Identifying positioning of each attributes in IPA matrix. IPA Matrix
H1 There are differences in overall satisfaction and
importance by gender. t-Student test
H2 There are differences in overall satisfaction and
importance by study area. Kruskal-Wallis test
H3 There are differences in overall satisfaction and
importance regards overall grade point average (GPA). One-Way ANOVA test
H4
There are differences in overall satisfaction and importance by academic years (Bachelor and Master Degree).
Bachelor Degree: One-Way ANOVA test Master Degree: Mean and
Standard Deviation
H5 There is a positive association between overall
satisfaction and loyalty. Phi test
H6 There are differences in overall satisfaction and
importance related to region. Kruskal-Wallis test
H7 There is a positive relationship between the satisfaction level and importance level.
Pearson Coefficient Correlation
H8 Main attributes will be positioning in quadrant B, “Keep
up the good work” in IPA matrix. IPA Matrix
H9 There are differences in overall satisfaction and
importance between Bachelor and Master Degree. t-Student test
24
rate for each latent variables will be used frequency analysis. In addition, mean and standard deviation will be calculated for each variables of satisfaction and importance.
Inferential analysis will be used to examine hypothesis test. According to type of data different tests will applied. If data is parametric in that case t-test, if data is non-parametric Kruskal-Wallis test will be applied. Seeing differences between two independent sample t-test will be used. Kruskal-Wallis test will be used to determine if there are differences between more than two samples. In addition, Importance-Satisfaction Analysis will be applied which explained Section 1.4.6.
To show the results on the IPA matrix median will be used for the satisfaction and importance dimension.
2.4 Population vs Sample
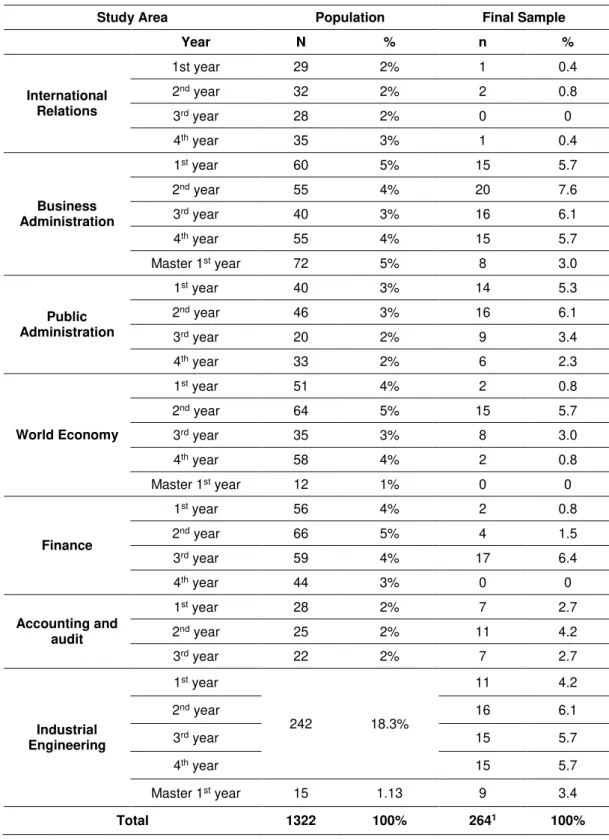
The research survey held in Qafqaz University, Baku, Azerbaijan. There are mainly two reasons that Qafqaz University have chosen. First, wanted to know satisfaction of students with the university also, data collection was convenient in this university. Population consist of students from one faculty of Economics and Administrative sciences, which includes six department (International Relations, Business Administration, Public Administration, World Economy, Finance and Accounting and Audit) also one department of Industrial Engineering.
In Table 4 it is shown that population consist of 1 322 students from bachelor and master degree of Economics and Administrative sciences faculty and Industrial Engineering department. Master degree contains 99 students, 1 223 students are from bachelor degree. It was impossible to examine all population, so it was decided to select the random sample. Questionnaires distributed with the help of teachers during their classes, which covered all departments and academic years. Specifically, want to mention that every respondent belonging to population had equal opportunity to be included into the sample. Only the students of second-class master degree students excluded from sample because, in the 2nd year master degree students were not attending to classes, they were working on their dissertations.
25
Table 5. Population and sample.
Study Area Population Final Sample
Year N % n %
International Relations
1st year 29 2% 1 0.4
2nd year 32 2% 2 0.8
3rd year 28 2% 0 0
4th year 35 3% 1 0.4
Business Administration
1st year 60 5% 15 5.7
2nd year 55 4% 20 7.6
3rd year 40 3% 16 6.1
4th year 55 4% 15 5.7
Master 1st year 72 5% 8 3.0
Public Administration
1st year 40 3% 14 5.3
2nd year 46 3% 16 6.1
3rd year 20 2% 9 3.4
4th year 33 2% 6 2.3
World Economy
1st year 51 4% 2 0.8
2nd year 64 5% 15 5.7
3rd year 35 3% 8 3.0
4th year 58 4% 2 0.8
Master 1st year 12 1% 0 0
Finance
1st year 56 4% 2 0.8
2nd year 66 5% 4 1.5
3rd year 59 4% 17 6.4
4th year 44 3% 0 0
Accounting and audit
1st year 28 2% 7 2.7
2nd year 25 2% 11 4.2
3rd year 22 2% 7 2.7
Industrial Engineering
1st year
242 18.3%
11 4.2
2nd year 16 6.1
3rd year 15 5.7
4th year 15 5.7
Master 1st year 15 1.13 9 3.4
Total 1322 100% 2641 100%
Source: Author's own calculation.
1 Sample consists of 266 respondents. However, two of them did not mention their academic year. Therefore, when the
26
3. Presentation and analysis of results
This section introduce the study findings from a sample of 266 questionnaires about student satisfaction in Economics and Administrative sciences faculty and Industrial Engineering department. This section consists of five parts. The first section (Section 3.1) examines profiles of respondents. Specifically, addresses age, gender, study area, academic year, source of information about university, region of student and other demographic questions about students. In order to classify the single variables, frequency tables used. In the second section (Section 3.2) descriptive analysis was used to describe results of data.
3.1 Profiles of the respondents
According to analyse of students` profile, as shown in Figure 5 number of male students are twice more than female students. 69.92% of sample is male students, which consist of 186 students. 30.08% of sample is female students, which consists of 80 students.
Figure 5: Distribution of students` by gender.
27
whose age is more than 27 makes 2.66% of sample, which consist of 7 students. Smallest part of students` age is less than 18 that makes 1.52% of sample and contains 4 students which can be seen in Figure 6.
Figure 6. Distribution of students` by age group.
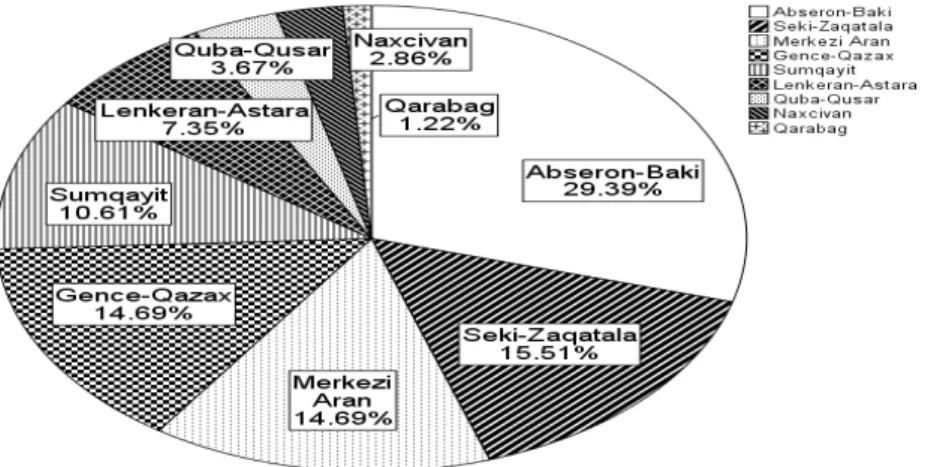
Azerbaijan divided into 9 region and from each region, there is a student studying in Qafqaz University. Study highlights that 29.39% (72) of students are from Absheron-Baku region, which followed by Shaki-Zaqatala with the 15.51% (38). Students from Markazi Arran and Ganja-Gazakh region each account 14.69% (36). The 10.61% (26) students are from Sumqayit, 7.35% (18) are from Lankaran-Astara region. The 3.67% (9), 2.86% (7), 1.22% (3) of students are from Guba-Gusar, Nakhcivan and Karabakh region-which could be observed from Figure 7.
Figure 7. Distribution of students` by region.
28
Figure 8. Distribution of students` by study area.
Research have done among Bachelor and 1st year Master students. Master 1st year students represents 6.44% (17) of the sample. Bachelor 1st year student’s represents 19.70% (52), 2nd year represents 31.82% (84) of the sample. Bachelor 3rd year students represent 27.27% (72) and 4th year students represents 14.77% (39) of sample, as is possible to see in Figure 9.
Figure 9. Distribution of students` by academic year.
29
Figure 10. Students` distribution by Academic GPA
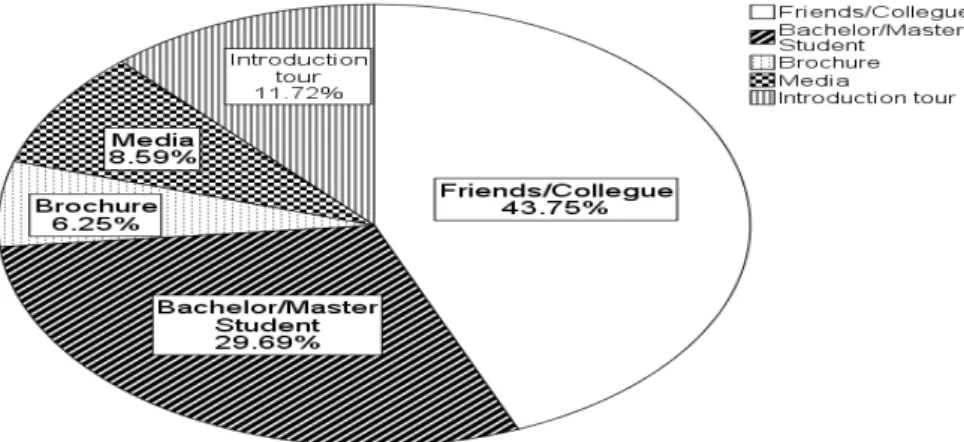
Asked from students` their main source of information about Qafqaz University. This questionnaire included five answers as seen in Figure 11:
Friends/College: 43.75% (112) of respondents argued that they heard about Qafqaz University from their friends or colleague.
Bachelor/Master Student: This is the current students of Qafqaz University and 29.69% (76) of respondents argued that their main information source was the current students of Qafqaz University.
Introduction Tour: Every year University management invites different High schools or preparation courses to university and gives them information about university. In the context of introduction tour, 11.72% (30) of respondents argued their main source of information about Qafqaz University.
Media: 8.59 % (22) of students argued their main source of information as media.
Brochure: 6.25% (15) of students` suggested that their main source of information was the brochure, which printed by Qafqaz University.