Universidade de Aveiro 2017
Departamento de Ambiente e Ordenamento
Diego Alexander
Parra Sánchez
Air quality assessment in Patio Bonito, Colombia
Avaliação da qualidade do ar em Patio Bonito,
Colômbia
Universidade de Aveiro 2017
Departamento de Ambiente e Ordenamento
Diego Alexander Parra
Sánchez
Air quality assessment in Patio Bonito, Colombia
Avaliação da qualidade do ar em Patio Bonito,
Colômbia
Dissertation presented to the University of Aveiro to fulfill the requisites required to obtain a master degree in Environmental Studies, carried out under the scientific guidance of professor Ana Isabel Couto Neto da Silva Miranda, full professor of the Department of Environment and Planning of the University of Aveiro.
I want to dedicate this work to God, to my grandparents who from heaven take care of me, to my mom and dad, relatives and friends in Colombia, without their support would not have been possible this adventure called “Portugal”.
Examination committe
Chair Doctor Maria Isabel da Silva Nunes
Assistant professor of the Department of Environment and Planning of the University of Aveiro.
External examiner Doctor Oxana Anatolievna Tchepel
Assistant Professor of the Faculty of Sciences and Technology of the University of Coimbra
Advisor Doctor Ana Isabel Couto Neto da Silva Miranda
acknowledgement I want to thank to God “the number one”, who gave me life, a beautiful family and his blessings. Thank you for being my best adventures companion. I also thank to my mom and my dad for all her love and support, to my relatives, friends, coworkers in Colombia, to my football buddies, to my thesis supervisor, my Portuguese professors and to all those angels who God put in my way. Thanks for believing in me, thanks for all your support, patience and affection.
“Whoever does not love does not know God, because God is love” (1 John 4:8).
“Whatever you do, work at it with all your heart, as working for the Lord, not for human masters” (Colossians 3:23).
palavras-chave Emissões de fabrico de tijolos, matéria particulada, qualidade do ar, modelação.
resumo O fabrico artesanal de tijolos gera um efeito direto sobre a qualidade do ar que afeta a saúde das comunidades vizinhas a este tipo de indústria. No município de Nemocón, no distrito rural Patio Bonito, na Colômbia, a grande maioria das pequenas empresas que fabricam tijolos utilizam técnicas artesanais. As infraestruturas são basicamente representadas por um forno e uma parcela de terra denominada "Chircal". Os trabalhadores geralmente usam fornos de fogo direto abastecidos com carvão, maioritariamente gás natural e diesel.
O presente trabalho tem como objetivo caracterizar a qualidade do ar, tendo em consideração o crescimento maciço da atividade de fabrico de tijolos no distrito rural de Patio Bonito, Nemocón, Colômbia, avaliando especificamente a matéria particulada PM10, que é um dos poluentes mais críticos devido ao seu impacto na saúde dos habitantes e no ambiente local. Para este estudo, foi analisado o ano de 2013, que apresentou as maiores concentrações de PM10 dos últimos cinco anos, de acordo com dados históricos da autoridade ambiental da região Cundinamarca, Colômbia. Para avaliar a qualidade do ar no Patio Bonito, aplicou-se uma metodologia de modelação da qualidade do ar recorrendo ao modelo Gaussiano URBAIR, desenvolvido pela Universidade de Aveiro. Para uma simulação adequada, foi necessário compilar dados de entrada como fontes de emissão e dados meteorológicos. O exercicio correspondeu aos períodos de 8 de agosto, 20 e 24 de novembro de 2013, com altas concentrações médias diárias de PM10, acima de 100 μg /m3, limite regulado pela legislação Colombiana.
Como possíveis medidas de melhoria, foram propostos dois cenários que se avaliaram recorrendo ao modelo URBAIR. O primeiro cenário implicou a substituição de fornos “Fuego dormido” por um forno tipo túnel, devido às suas menores emissões de PM10. O segundo cenário, considerou a operação dos fornos Colmena com um sistema de controlo de emissões (ciclone). Os resultados permitiram concluir que as opções de melhoria representam uma redução significativa de PM10 até 44.3%.
keywords Emissions from brick manufacturing, particulate matter, air quality, modeling.
abstract The manufacturing brick generates a direct effect in the air quality affecting the health of the surrounding communities of this type of industry. In the Colombian municipality of Nemocón, in the Patio Bonito rural locality, the majority of small and micro-sized brick fields uses craft techniques for manufacturing different types of bricks. The manufacturing plant is basically represented by a kiln and a plot of land as a farmyard; the area where these elements are concentrated is commonly named “Chircal”. Craft brickers usually use kilns of direct fire and upward firing for cooking. The main fuel used in the manufacture of bricks is coal, followed by natural gas and diesel.
The present work aims to characterize air quality, taking into account the massive growth of the brick manufacturing activity in the rural locality of Patio Bonito, Nemocón, Colombia, specifically assessing the particulate matter PM10, which is one of the most critical air pollutant due to its impact on health of its inhabitants and on the local environment. The year 2013 was selected for the analysis, because the highest PM10 concentrations of the last five years that happened in that year, according to historical data from the environmental authority of Cundinamarca region.
For assessing the air quality in Patio Bonito, a Gaussian air quality model named URBAIR, developed by the University of Aveiro, was applied. For an adequate operation of this model, it was necessary to collect input data as emission sources and meteorological data. The modeling periods were August 8th, November 20th and 24th 2013, when daily averaged with concentrations above 100 µg/m3, limit regulated by Colombian legislation were registered.
Moreover, two improvement scenarios were proposed. The first implied replacing all the “Fuego dormido” kilns by one Tunnel kiln, because it showed the lowest PM10 emissions. The second considered the operation of “Colmena” kilns with an emission control system. Results allowed to conclude that those improvement measures can reduce the PM10 contribution to air pollution levels.
i
TABLE
OF
CONTENTS
List of figures ... iii
List of tables ... v
Notations ... vii
1. INTRODUCTION ... 1
2. AIR QUALITY ASSESSMENT AND BRICK MANUFACTURING IN THE WORLD ... 5
2.1 China ... 7 2.2 India ... 10 2.3 Bangladesh... 14 2.4 Vietnam ... 17 2.5 Mexico... 19 2.6 Brazil ... 21 2.6 Colombia ... 23
3. CHARACTERIZATION OF PATIO BONITO ... 29
3.1 General information ... 29
3.2 Characterization and contribution of emission sources ... 33
3.2.1 Brick kilns emissions ... 34
3.2.2 Fugitive emissions ... 38
3.2.3 Road traffic emissions ... 40
3.3 Air quality ... 42
4. AIR QUALITY MODELING ... 47
4.1 The Gaussian air quality model URBAIR ... 47
4.2 Selection of episodes ... 48
4.3 Application of the air quality model URBAIR ... 51
4.3.1 Simulation domain ... 51
4.3.2 Meteorological data... 52
4.3.3 Brick kiln emissions ... 56
ii
4.4 Results ... 59
5. IMPROVEMENT MEASURES ... 63
5.1 Short terms measures ... 63
5.2 Medium term measures ... 64
5.3 Long-term measures ... 69 5.4 Contingency plan ... 73 6. CONCLUSIONS... 77 REFERENCES ... 81 APPENDIX A ... 87 APPENDIX B ... 88 APPENDIX C ... 89
iii
List of figures
Figure 1 Brick production process (URL 1) ... 5 Figure 2 Location of the nine monitoring stations in Wuhan (Song et al., 2016) ... 8 Figure 3 Annual mean concentrations of air pollutants in urban Wuhan (Song et al., 2016) ... 10 Figure 4 Locations of the sampling sites in Panzan village (Skinder et al., 2014) ... 12 Figure 5 Monthly average of SOx and TSP during non-operational and operational phases of brick kilns (Skinder et al., 2014) ... 13
Figure 6 Comparison of different SO2 data (Ahmed & Hossain, 2008) ... 15
Figure 7 Fine PM probable source locations across the Indian Subcontinent. The red color represents higher probability locations. (Begum et al., 2013). ... 16 Figure 8 Average emission rate from a brick kiln during the firing period used in modeling for the base case ... 17 Figure 9 The ISCST3 model domain with the Song Ho brick-making village (Le & Oanh, 2010) ... 18
Figure 10 SO2 concentrations distribution in the 10 x 10 km2 model domain in the base case
(2007). ... 19 Figure 11 Suitability map for the establishment of the brick industry in Chihuahua, México ... 20 Figure 12 Distribution of kilns at southern Santa Catarina, Brazil (Camara et al., 2015) ... 22 Figure 13 Fuels consumptions (Tera calories/year) in Colombia per size brickworks (CAEM, 2015). ... 24 Figure 14 PM2.5 annual concentrations and exceedances for the period 2008 – 2011 (Silva & Valencia, 2013). ... 25 Figure 15 Three PM10 sampling points selected in the study: La venta, Colegio and El Plan ... 26 Figure 16 Nemocón and Patio Bonito location (URL 2) ... 30 Figure 17 Brick kiln distribution in rural localities of Nemocón in 2013 (Sánchez, 2016) .... 31 Figure 18 Brick kilns coexisting with populated areas (Sánchez, 2016) ... 33
iv
Figure 19 Different brick kilns in Patio Bonito (Sánchez, 2016) ... 35
Figure 20 Distribution of Fuego dormido kilns by nominal production capacity (Rodriguez & Piñeros, 2011) ... 36
Figure 21 Fugitive emissions from brick production activity (Sánchez, 2016) ... 39
Figure 22 Location of the Casablanca Toll and brickworks area (URL 3) ... 40
Figure 23 Daily average PM10 concentrations (µg/m3) in 2013 ... 49
Figure 24 Monthly average PM10 concentrations in 2013 ... 50
Figure 25 PM10 exceedances in August and November in 2013 ... 50
Figure 26 Satellite image of the study domain Google Earth, (2017) ... 52
Figure 27 Daily temperature (°C) for August 8, November 20 and 24 of 2013 ... 53
Figure 28 Monthly wind rose for August and November 2013 ... 54
Figure 29 Wind speed and direction for August 8 (a) November 20 (b) and November 24 (c) 2013 ... 55
Figure 30 Emission point sources in Patio Bonito influence area ... 56
Figure 31 PM10 background concentrations in 2013 ... 59
Figure 32 Spatial distribution of the PM10 concentrations in 2013, resulting from the simulation of August 8 (a), November20 (b) and November 24 (c), considering 74 brick kilns emissions ... 61
Figure 33 Comparison between Natural gas and mineral coal (Rodriguez & Piñeros, 2011) ... 65
Figure 34 Spatial distribution of the PM10 concentrations for November 20/11/2013 (a), simulation including Colmena kilns with control system cyclones (b) and the difference scenario (c) ... 68
Figure 35 Coal gasifier of single stage (URL 6) ... 70
Figure 36 Spatial distribution of the PM10 concentrations for November 20/11/2013 (a), simulation including Hoffman and Tunnel kilns with control system cyclones (b) and the difference scenario (c) ... 72
v
List of tables
Table 1 Emission sources and contribution of fine PM mass and black carbon (BC) during the
period 2001 – 2009 in Dhaka, Bangladesh (Begum et al., 2013) ... 16
Table 2 Production capacity of kilns in Colombia (CAEM, 2015) ... 24
Table 3 Characteristics of the municipality of Nemocón (DANE) ... 29
Table 4 Chemical physic properties of used coal in kilns (Sánchez, 2016) ... 32
Table 5 Annual coal consumption per Fuego dormido kiln class (Sánchez, 2016) ... 36
Table 6 Annual coal consumption of other brick kilns (Sánchez, 2016) ... 37
Table 7 Estimated PM10 emissions from brick kilns based on coal consumption (Sánchez, 2016) ... 38
Table 8 Estimated emissions from road traffic based on vehicle category (Sánchez, 2016) 42 Table 9 Comparison between estimated emissions (Sánchez, 2016)... 42
Table 10 Air quality index values ... 45
Table 11 Air quality Index ICAR (2013-2015) ... 46
Table 12 Main inputs data for URBAIR model... 48
Table 13 Emission point sources ... 56
Table 14 Emission source data from 74 brick kilns for URBAIR ... 57
Table 15 Emission sources input data URBAIR... 58
Table 16 Emission sources input data URBAIR... 58
Table 17 Emission sources input data (improvement scenario 1) ... 67
vii
Notations
List of abbreviations
ACP Atmospheric Contingency Plan
APA Agência Portuguesa do Ambiente
API Air Pollution Index
APM Airborne Particulate Matter
AQI Air Quality Index
BTK Bulls Trench Kiln
CA Cluster Analysis
CAEM Corporación Ambiental Empresarial
CAR Corporación Autónoma Regional de Cundinamarca
CCDRC Comissão de Coordenação e Desenvolvimento Regional do Centro
DANE Departamento Nacional de Estadística
FCBTK Fixed Chimney Bull Trench Brick Kilns
GIS Geographical Information System
HACA Hierarchical Agglomerative Cluster Analysis
ICAR Colombian Air Quality Index
IDEAM Instituto de Hidrología, Meteorología y Estudios Ambientales de Colombia
ISC3 Industrial Source Complex
ISCST Industrial Source Complex-Short Term
MCA Multicriteria Analysis
NAAQS National Ambient Air Quality Standards
NOx Nitrogen Oxides
PM Particulate Matter
PM2.5 Particulate matter with an aerodynamic equivalent diameter smaller than
2.5 microns.
PM10 Particulate matter with an aerodynamic equivalent diameter smaller than
viii
PMF Positive Matrix Factorization Model
SDA Secretaria Distrital de Ambiente de Bogotá
SISAIRE Subsistema de Información de la Calidad del Aire
SOx Sulfur Oxides
TSP Total suspended particles
USEPA Environmental Protection Agency of the United States
VSBK Vertical Shaft Brick Kilns
WMO World Meteorological Organization
WHEP Wuhan Environmental Protection Agency
List of variables
BpHi Break-point of the concentration at the upper limit of the ICAR category
BpLo Break point of the concentration at the lower limit of the ICAR category
Cp Concentration measurement for pollutant p
IHI Value of the index at the upper limit of the ICAR category
ILo Value of the index at the lower limit of the ICAR category
Ip Index for pollutant p
roar Ambient air density Cpar Ambient air heat capacity Cpas Ambient dry air heat capacity Pa Atmospheric pressure in Pascal unit Zi Mixing layer height
hr1 Relative humidity at 2 m Clas Stability class
rad Solar radiation
ta1 Temperature at 2 m dv1 Wind direction at 10 m vv1 Wind speed at 10 m
ix Chemical compounds CO Carbon monoxide CO2 Carbon dioxide HCl Hydrochloric acid HF Hydrofluoric acid NO2 Nitrogen dioxide O3 Ozone SO2 Sulfur dioxide
1
1.
INTRODUCTION
The air pollution is defined as the presence in the atmosphere of substances in such amounts that affect humans, vegetation, animals, or material adversely (Li et al., 2012). Large scale burning of fuels to supply energy to industries, households and means of transportation is the main cause of air pollution. Li et al., (2012) estimated that almost 90% of the air pollution are related with the combustion of fuel. An important air pollution source is the world brick manufacturing activity, which is responsible for an significant contribution of toxic fumes, containing particulate matter (PM) and high concentration of carbon monoxide (CO) and sulfur oxides (SOx), that are harmful to eyes, lungs and throat (Vijay & Menon, 2011).
The global brick production is estimated in 1500 billion bricks per year (Schmidt, 2013). China is the top producer with 1000 billion of units per year (67%). In China, bricks are mainly used as the material to construct walls but they are also used for the construction of pavements, canals, drains, roofs, etc. In India, the second global producer of bricks with 200 billion of units per year (10% of the global brick production), the majority of current brick production is made in artisanal kilns, which are important fixed emission sources (Bhat, Afeefa, Ashok, & Bashir, 2014).
The brick manufacturing in Colombia includes a large number of small kilns known as "Fuego dormido", which do not have emissions control systems neither suitable designs for an
optimal combustion. In addition, this type of kilns does not comply the emission limit values
and affect the air quality.78% of companies in the mining sector, including brickworks, do
not have environmental licenses or do not comply with environmental management plans (Silva & Valencia, 2013). The municipality of Nemocón, rural locality of Patio Bonito, is one example of an area strongly affected by Fuego dormido emissions to the atmosphere.
2
The rural locality of Patio Bonito is an industrial corridor known in the region of Cundinamarca, in which almost 80% of the brick demand for the Bogotá D.C and the region is produced (Rodriguez & Piñeros, 2011). The manufacture of these bricks, in most cases, is
done in a rudimentary way, using artisan kilns like Fuego dormido. The environmental impact
is continuous and has lasted approximately 40 years with this activity. Medium and big brickworks, which have other types of kilns like Hoffman and Colmena kilns, are also installed in the rural locality. Nowadays, they are involved in a process of technological restructuring in order to comply the national emission limits and to improve the air quality.
The present work aims to assess the air quality in Patio Bonito, Nemocón, Cundinamarca, Colombia, for the base year 2013, taking into account a previous characterization of different emission sources and local meteorological conditions (Sánchez, 2016). Criteria pollutant, such as particulate matter with an aerodynamic equivalent diameter smaller than 10 µm (PM10) is addressed, because it is one of the pollutants that Colombia has categorized as more important within its current environmental legislation. A modeling approach to simulate PM10 levels in Patio Bonito, for 2013 selected episodes and for emissions mitigation scenarios was developed and applied allowing to better understand PM10 levels and the brick manufacturing contribution to particulate pollution.
This document is organized as follows. Chapter 2 describes important aspects related to brick manufacturing emissions around the world. It includes cases related to brick kiln emissions and to their impacts on the air quality of different countries that have a significant brick production activity.
Chapter 3 presents the characterization of the municipality of Nemocón and the rural locality Patio Bonito, taking into account local emission sources, climatology and the air quality state. A description of the main emission sources in Nemocón and Patio Bonito is done as well as a calculation of their contribution to PM10 emitted levels. Road traffic emissions are also compared with emissions from the brick kilns.
3
Chapter 4 is focused on air quality modeling. It presents a description of the Gaussian air quality model URBAIR, its different input and output variables, including meteorological parameters and PM10 emission sources. PM10 pollution episodes are selected for simulating PM10 levels in Patio Bonito, taking into account the operation of different point sources related to the local brick manufacturing activity. Likewise, application and results of the URBAIR model are presented.
Chapter 5 proposes different improvement measures for Patio Bonito. These proposals include short, medium and long term measures. Two of these improvement measures are simulated with the URBAIR model, and their impact on the air quality assessed by comparison of results with those from the 2013 selected episodes. In this chapter, a contingency plan that includes control and prevention measures is also proposed.
5
2.
AIR
QUALITY
ASSESSMENT
AND
BRICK
MANUFACTURING
IN
THE
WORLD
This chapter describes aspects of the brick manufacturing activity around the world, which are related to air pollution. It presents some case studies related to the air quality assessment in countries that have presented a growth of brick production during the last years such as: China, India, Bangladesh, Vietnam, Mexico, Brazil and Colombia, and taking into account their increase of the atmospheric pollutants concentration in the ambient air of the analyzed territories.
In a brick manufacturing facility, different types of kilns can be used to produce bricks, from craft kilns like “Arabian” or “Fuego dormido” to more technological kilns, like Hoffman and Tunnel kilns. The Colmena kilns are similar to Fuego dormido kilns, but they have a stack. Construction and operation costs of Hoffman and Tunnel kilns are high. Figure 1 shows an example of a production process in a developing country like Colombia.
6
Basically, the productive process of brick manufacturing consists in the following phases:
Exploitation and clay extraction: different types of material (silica-calcareous) with appropriated physic-chemical properties are coming from mines for the elaboration of the product.
Maturation and preparation: the clay after being extracted from the mine is left in the open air to favor its disintegration. Then it is mixed with sand, being left in rest in an aging process that favors the elaboration of blocks and bricks. The extraction and transport of clay usually takes place with bulldozer or loader, using a vehicle that produces fugitive emissions by its movement. Additionally, the storage of the clay is another source of suspended particulate emissions.
Molding and extrusion: in the case of small, medium and large brickworks, this process is carried out in the inner part of the warehouses, and usually has one or two lines of production that operate alternately; the equipment used is basically material hopper, conveyor belts, shredder, laminator, extruder and cutter.
Drying: the block is conditioned through a dehydration phase in order to prepare it to a final cooking/firing with the desired properties.
Cooking: corresponds to the burning process of the bricks in kilns. The clays mixed with sand are subjected to cooking passing during this process by complex reactions governed by their chemical and mineralogical composition. In cooking, chemical reactions are completed, the bricks undergo a slight contraction and acquire a characteristic structure that gives strength to the finished brick. The temperature varies between 1000°C and 1100°C.
7
In craft brick kilns, the burning process takes a long time to solidify the bricks from mud and the quality of the burnt fuel is usually low. Therefore, the bricks production activity is a source of atmospheric pollutants, such as PM10, particulate matter with an aerodynamic equivalent diameter smaller than 2.5 µm (PM2.5), SOx, nitrogen oxides NOx, hydrochloric acid (HCl) and hydrofluoric acid (HF).
The primary sources of total suspended particles (TSP), PM10, and PM2.5 emissions are in the raw material grinding, screening operations, and the kilns. Other PM emissions sources include fugitive dust sources, such as paved roads, unpaved roads, and storage piles.
Combustion products include sulfur dioxide (SO2), NOx, CO, and carbon dioxide (CO2),
emitted from fuel combustion in brick kilns and some brick dryers (USEPA, 1997).
Brick manufacturing emissions have been growing during the last decade in the world due to the increase on the demand of brick production. Some countries have developed their own emission factors calculations according to the environmental and operation conditions and have developed national inventories for different fixed sources like craft kilns (Sánchez, 2016).
2.1 China
In the world, China is the first brick producer. It estimated that China produced 340 billion bricks in 2012, contributing with 44% of the global total production (Zhao et al., 2013). There are approximately 80,000 brick kilns in China, which 90% are traditional annular type. The annular brick kilns usually have large furnaces with large roof areas but only a single stack.
The most relevant atmospheric pollutants generated by brick manufacturing in China are
TSP, SO2, NOx and PM2.5 (Zhang, Streets, He, & Klimont, 2007). In the last years, non
technified kilns like the Bull’s Trench Kiln (BTK) have been replaced by Tunnel and Hoffman kilns with emission control systems (Schmidt, 2013).
8
Some studies have manifested difficulty to estimate emissions from point sources in the brick manufacturing due to the lack of information of emission factors in some districts where exist this activity (Zhang et al., 2007). The same difficulty has been presented for the estimation of fugitive emissions for this activity (Chen et al., 2017).
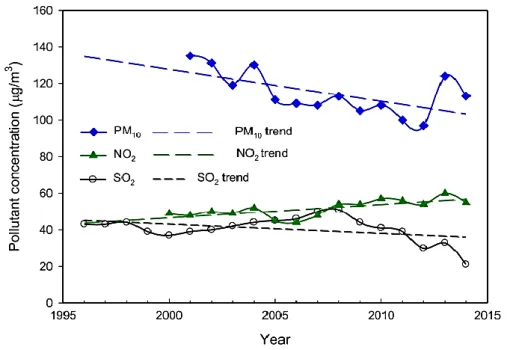
Regarding air quality assessment, despite the existence of studies about air pollution levels in different Chinese cities, it is difficult to refer specific researches that directly relate air quality with the brick manufacturing activity (Sánchez, 2016). Nevertheless, some studies identify the air quality status of some Chinese cities. The study of air quality status for the Wuhan city is an example of them (Song, Guang, Li, & Xiang, 2016).
Wuhan is the capital city of Hubei province. It is situated on the east of the Jiang-Han plain, a vast area in the valley of Yangtze River. It is one of the areas with high industrial development in the country, with high coal consumption, steel and brick manufacturing industries and smelting activities, accounting for high emissions of PM (Song et al., 2016). In
this study, -concentration of criteria pollutants such as PM10, nitrogen dioxide (NO2), SO2,
were measured through the operation of nine monitoring stations. The location of the nine monitoring stations is presented in figure 2.
9
The nine urban monitoring sites were classified into three groups (Song et al., 2016). Group I consists of the LY site, which is located in the famous East Lake scenic area with the best air quality. Group II corresponds to three monitoring sites with heavily traffic roads nearby,
where relatively severe NO2 pollution occurs (marked as YH, ZY, and JT sites). Group III
comprises the remaining five sites, characterized by PM10 and SO2 pollution (marked as HQ,
GX, XQ, WJS, and GH sites).
Simple descriptive statistics were performed to obtain the annual average. Subsequently, data were compared with the National Ambient Air Quality Standard (NAAQS) to evaluate the overall pollution status in Wuhan. In addition, multivariate statistical methods; among them, the Cluster Analysis (CA), was used for simplifying and classifying the behavior of environmental pollutants in a specific region. In order to examine the spatial pattern of air pollution in Wuhan, the nine monitoring stations were grouped using Hierarchical Agglomerative Cluster Analysis (HACA), a distribution-free ordination technique to group sites with similar characteristics by considering an original group of variables.
Based on the monitoring data, the daily air quality was reported using the Air Pollution Index (API). The API data for those pollutants were collected from the air quality publishing platform supported by the Wuhan Environmental Protection Agency (WHEP).
Figure 3 shows the annual average concentrations of PM10, NO2, and SO2 for the period
2001–2014 and the SO2 concentration for the period 1996–2000. It can be seen that the
average concentration of SO2 remained almost constant during the 1996–1998 period, but
dropped clearly in 1999 and 2000. Over the period 2009–2014, a significant decline in the
SO2 concentration occurred steadily, finding in the final period that all the SO2
10
Figure 3 Annual mean concentrations of air pollutants in urban Wuhan (Song et al., 2016)
PM1O concentrations from 2001 to 2014 indicates that PM10 pollution was actually
declined. However values are above the annual NAAQS limits of 70 µg/m3, NO
2 values show
a clear trend with slightly increase since 2007; nevertheless, those values are always below
the limit standard. In addition, the SO2 concentration has steadily decreased since 2008, due
to the strict implementation of flue gas desulphurization in coal-fired power plants. Finally, results identified that air quality has slightly improved over the recent years.
2.2 India
India is the second-largest brick producer in the world, with 260 billion of bricks every year that represents 13% of the global production. The sector consumes around 40 million tons of coal per year (CCACOALITION, 2012). Despite its size, the brick kiln sector in India remains largely unorganized. In addition, the number of smoke-emitting brick kilns is rising without any improvement in the emission process. Approximately 70% of the Indian brick production comes from 3000 bulls trench kilns (Suresh, Kumar, Mahtta, & Sharma, 2016).
11
The Continuous Fixed Chimney Bull Trench Brick Kiln (FCBTK) is the main used technology. FCBTK is a horizontal, moving fire kiln in which firing is done continuously during the brick making season
In the 2010 multi‐pollutant emissions inventory for the national capital region Delhi, emissions for the brick sector were estimated as: 12,400 tons/year for PM10, 4000 tons/year
for SO2, and 6750 tons/year for NOX, representing 9%, 11% and 1% respectively, of the total
emissions from the industrial sector in this region (Guttikunda & Calori, 2012).
An example of air pollution assessment related to brick manufacturing industries, near a populated area, is the one developed in the city of Nagpur, India (Bhanarkar, Gajghate, & Hasan, 2002). The objective of this study was to monitor along 24 hours the ambient air around brick kilns in a populated area, in order to assess the air quality, to know the impact of the brick kilns and to establish the ground level concentrations of main pollutants as TSP
NOx and SO2 using dispersion models.
The study included emissions monitoring during 24 hours in 125 small bricks kilns and 90 mobile chimney units. These brick kilns were divided into three main types: county type kilns, Bull’s trench kilns and high draught kilns.
The micrometeorology data, namely wind speed and direction was collected during 24 hours in areas nearby the brick kilns area by an automatic weather station. The parameters of mixing height and stability class were used for predicting daily average ground level
concentrations of PM10, SO2 and NOx influenced by emissions released from brick kilns,
using the dispersion model Industrial Source Complex-Short Term (ISCST2) (Bhanarkar et al., 2002).
Results allowed to identify that ambient air quality was marked by TSP in a range between
312–651 µgm3. In addition, there was a contribution of fugitive emission due to wind-blown
12
from 7–9 and 14–29 µgm3 respectively. The impacted area around brick kilns was about 3
km in radius (Bhanarkar et al., 2002).
Another case study related to air pollution from brick kilns is related to the Panzan village, Budgam district. There are approximately more than 15 brick kilns just within a diameter of 2 km (Skinder, Pandit, Sheikh, & Ganai, 2014). All the brick kilns are Bull’s trench kiln type. The estimated amount of coal consumed by each brick kiln (functional only for six months) varies between 2.5 and 3 tons per season.
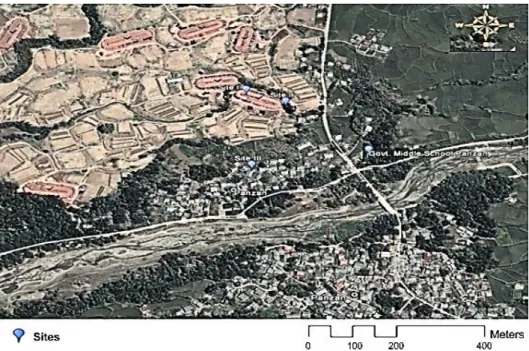
Criteria pollutants such as SOx, NOx, TSP were monitored during 8 hours periods for the non-operational and non-operational phases of brick kilns in the months from April to September 2012 (Skinder et al., 2014). Three sampling sites were selected for assessing the atmospheric pollutant contribution from brick kilns. Figure 4 shows the location of these sampling sites. A high volume environ-tech air sampler was used.
Figure 4 Locations of the sampling sites in Panzan village (Skinder et al., 2014)
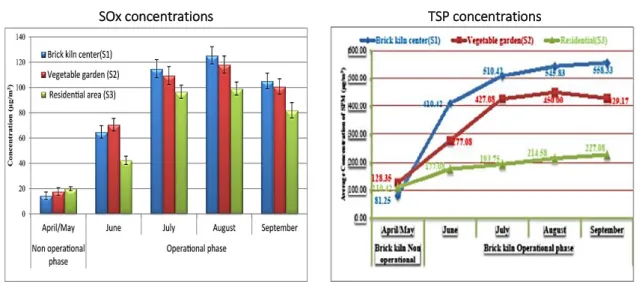
The three sampling sites were classified as: brick kiln center (S1), vegetable garden (S2) and residential area nearby brickfields (S3). Figure 5 shows the monthly average of SOx and TSP concentrations for the operational and non-operational phases of brick kilns.
13
SOx concentrations TSP concentrations
Figure 5 Monthly average of SOx and TSP during non-operational and operational phases of brick kilns (Skinder et al., 2014)
According to figure 5, SOx concentrations registered during the operational phase of brick kilns were high, especially in July, August and September in the sampling sites (S1, S2 and S3) with values above 120 µg/m³; contrary to this, during the non-operational phase, SOx concentrations values were below 20 µg/m³ (Skinder et al., 2014). Likewise, TSP averaged concentrations presented the same trend to increase in the sampling sites during the operational phase of brick kilns and for the same months. Concentrations of these two pollutants are strongly marked in S1 (brick kiln center).
The contribution of brick kilns to air pollution was found to be larger than the contribution from other sources. Coal combustion is the main source of airborne particles. Moreover, all monitored pollutants (SOx, NOx and TSP) were exceeding the limits prescribed by NAAQS during the operational phase of brick kilns. The Air quality Index (AQI) was categorized from severe to high; for the site S2 (residential areas), it ranged from 26 to 37 µg/m³ during non-operational phase from 84 to 148 µg/m³ during the non-operational phase of brick kilns.
Mitigation measures as the use of pulverized coal of 10 mm size for an optimum combustion, mechanical feeders for effective burning of the coal and introduction of cleaner technologies such as Vertical Shaft Brick Kilns (VSBK) instead of Bull trench kilns, were proposed (Skinder
14
2.3 Bangladesh
In Bangladesh, 5000 brick kilns are estimated to be actively producing kilns (Guttikunda, Begum, & Wadud, 2013). In particular, there are about 1000 brick kilns in the districts of Dhaka, Gazipur, Manikganj, and Narayanganj. Brick manufacturing produces 3.5 billion bricks per year, using energy-inefficient fixed-chimney as the BTK technology.
According to Guttikunda et al., (2013), total annual emissions in Dhaka region are estimated
as 23,300 tons of PM2.5 and 15,500 tons of SO2. Local sources, such as brickfields, contribute
to PM concentrations higher than the Bangladesh NAAQS (Begum, Hopke, & Markwitz, 2013). About 30 to 50% of the PM10 in the capital Dhaka is in fine particles with aerodynamic diameter less 2.5 µm. The associated health impacts largely fall on the densely populated districts of Dhaka, Gazipur, and Narayanganj with 20% of the total number of Dhaka residents dying annually as a result of poor air quality, particularly in the dry season when bricks are produced (Guttikunda et al., 2013).
In 2008, an air quality model was applied to quantify the contribution of brickfields to air
pollution. Measured concentrations of SO2 and CO, among other pollutants, were compared
with the Industrial Source Complex (ISC3) model results. Sampling was done during three days in a zone with 41 brick kilns near Amin Bazar and Savar, during the dry season (Ahmed & Hossain, 2008). The ISC3 model needs emissions and meteorological input data. Meteorological input data used were obtained from the World Meteorological Organization (WMO).
SO2 concentrations were delivered considering averages of 1 hour and 6 hours, during three
days. Figure 6 shows the comparison between measured and modeled values and the
15
Figure 6 Comparison of different SO2 data (Ahmed & Hossain, 2008)
According to results, ambient concentration values of SO2 accomplish the Bangladesh daily
standard, with values below 0.14 ppm (370 µg/m³). Day 2 had the highest SO2 modelled
concentrations, with a value of 0.12 ppm (310 µg/m³). Finally, the study concluded that the ambient air quality data generated by the ISC3 model were in agreement with the experimental results, with an average error between 5 and 10%.
More recently, aiming to estimate the impact of industries located in a suburban area, Begum et al. (2013) investigated the potential effect on air quality of Airborne Particulate Matter (APM), based on collected long-term data. For this objective, 100 samples were taken from January 2001 to February 2009 and a Positive Matrix Factorization (PMF) model was applied. It is a source-receptor model that calculates the variables distribution in a matrix. The profiles and mass contribution from identified sources were also calculated (Begum et al., 2013).
From collected data, the PMF modeling identified seven sources for the PM fine fraction samples. The source four had characteristics of black carbon, sulfur, lead and trace amount of crustal elements and represented the brick kiln source, where burnt coal in kilns contains
16
4 to 6% sulfur. The average source contributions to fine PM derived from the PMF modeling are shown in table 1.
Table 1 Emission sources and contribution of fine PM mass and black carbon (BC) during the period 2001 – 2009 in Dhaka, Bangladesh (Begum et al., 2013)
Source Fine PM samples (µg/m3)
2001-2002 2005-2006 2007-2009
Mass BC Mass BC Mass BC
Motor vehicle
7.16 2.50 5.62 0.3 12.1 0.02
Brick kiln 2.23 1.37 11.1 4.1 7.59 7.41
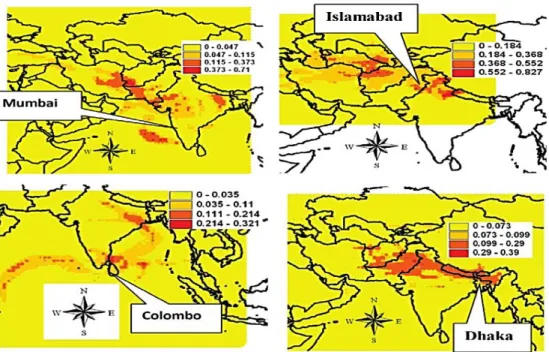
According to table 1, emissions from brick kilns became higher than any other source in the period 2005-2006 with a contribution of 22%. This is due to the increase in the number of brick kilns in Dhaka. Moreover, Begum et al.,(2013) estimated the potential source areas for PM in Pakistan, Bangladesh, India, and Sri Lanka. Figure 7 shows PM probable source locations across the Indian Subcontinent. The deep red color shows the most potential source areas than the yellow ones. It is found that the air masses travel through Iran, Afghanistan and then to Pakistan.
Figure 7 Fine PM probable source locations across the Indian Subcontinent. The red color represents higher probability locations. (Begum et al., 2013).
17
It was found that in case of Bangladesh and India, the air masses mainly pass through Iran, Afghanistan and reach Pakistan (Islamabad), then curve down to Sri Lanka (Colombo), due to the meteorological conditions in this region (Begum et al., 2013).
2.4 Vietnam
Vietnam is presenting a rapid development of the brick manufacturing activity. This sector includes medium, small and family based enterprises, which increased from 62% in 2001 to over 80% in 2005. Almost 17,000 million brick pieces were produced in 2005 (Le & Oanh, 2010). Le and Oanh (2010), developed a study in the Bac Ninh province in the north of Vietnam, in order to monitor daily brick kiln stack emissions and to derive emission factors. It was based on monitoring and dispersion modelling for the assessment of the environmental effects caused by the brick manufacturing in the village of Song Ho.
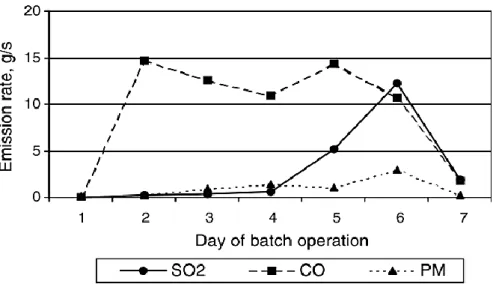
In Song Ho village there were 45 brick kilns in 2007. The production varies from 200,000 to 1,000,000 bricks per batch. The average coal consumption is 8.53 tons per 1000 bricks (Le
& Oanh, 2010). The averaged emission rate of SO2, CO and PM from brick kilns during the
firing period for seven days was assessed, figure 8 shows the obtained values.
Figure 8 Average emission rate from a brick kiln during the firing period used in modeling for the base case (Le & Oanh, 2010)
18
The emission rate for SO2 was the most interesting for modeling due to the increase during
the monitoring period in seven days with normal operation of selected kilns. The emission
varies from one kiln to another especially for SO2, which is most probably due to the variation
in the sulfur content of coal. In addition, large fluctuations in obtained emission factors among the kilns suggested that more emission measurements are still required to produce representative ranges of values. The average emission factors per 1000 bricks were 0.52-5.9
kg of SO2 and 0.64-1.4 kg of PM (Le & Oanh, 2010).
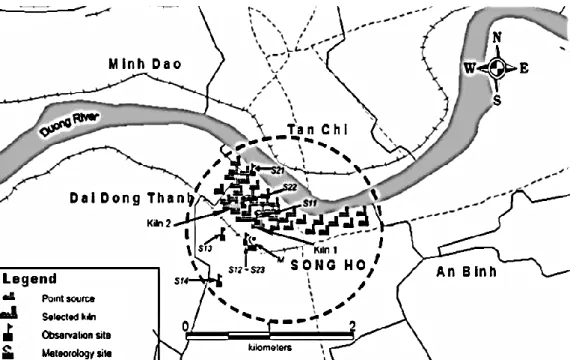
Emission factors and PM size distribution were obtained and used as input data to the Industrial Source Complex Short-Term (ISCST3) dispersion model. Figure 9 shows the defined simulation domain, which includes 21 selected brick kilns operating in the village, as well as meteorological and ambient air monitoring sites that operated during 2006 and 2007.
Figure 9 The ISCST3 model domain with the Song Ho brick-making village (Le & Oanh, 2010)
The SO2 concentrations in the surrounding area of the brick-making village, for different
emission scenarios, were estimated. The domain covered 100 km2 (Cartesian 40 × 40 grids
of 250 m) of flat terrain including the Song Ho village. Figure 10 shows the first highest SO2
19
The outermost contour is 1-h NAAQS of 350 µgm3. The Song Ho village is in the center of
the domain. Locations of brick kilns (⊗) and ambient monitoring sites (∗) are marked.
Figure 10 SO2 concentrations distribution in the 10 x 10 km2 model domain in the base case (2007).
(Le & Oanh, 2010)
Results for 21 operated kilns in the village showed that in 2007 the most critical pollutant
was SO2, exceeding the hourly national ambient air quality standards (NAAQS) of 350 µgm3,
over 63 km2 out of the 100 km2 domain in the base case.
2.5 Mexico
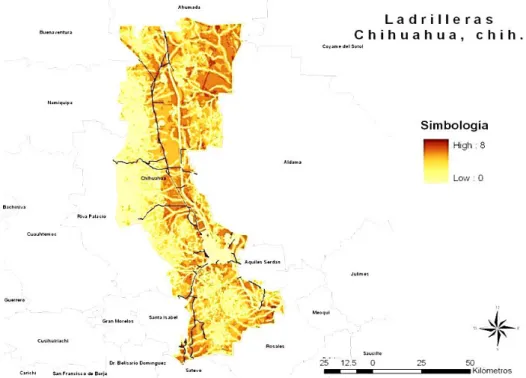
In Latin America, Mexico is an important brick producer. Brick production in Mexico, contrary to other Latin American countries, still is a handmade craft activity, 90% of the producer does not have the appropriate technology to fabricate the bricks (Corral & Covarrubias, 2012). The Secretaría de Medio Ambiente y Recursos Naturales of Mexico registered 16,300 kilns in 2011, from which 70% are traditional brick kilns, and identified a growing trend. The Chihuahua State is an example of this increase.
20
In 2012, Corral and Covarrubias (2012) investigated the impact of brick kilns in this state. The main objectives were to identify the location of the brick kilns in all the municipalities of the Chihuahua State and to determine the best alternatives to relocate the brick kiln industry in order to minimize environmental risk. Multicriteria Analysis (MCA) based on digital cartography and a Geographical Information System (GIS) were used (Corral & Covarrubias, 2012).
Chihuahua city has 296 brick kilns nearby to urban areas. These have a capacity of 20 to 30,000 bricks per kiln. A risk map was developed for five municipalities of the Chihuahua State and an evaluation matrix with weight values by category and factor was delivered (Corral & Covarrubias, 2012). The resulting risk map allowed to propose new locations for the brick industry, as shown in figure 11.
Figure 11 Suitability map for the establishment of the brick industry in Chihuahua, México (Corral & Covarrubias, 2012)
21
Figure 11 shows that the best polygons for relocation of brick kilns are in the Northeast side. The study concluded that the environmental risk maps resulting from the combination of the GIS and the MCA are important tools for solving the problem of the brick industry location in Chihuahua State.
2.6 Brazil
Santa Catarina is a Brazilian state with an important industrial sector, that includes the production of red clay ceramics (brick and tile kilns). It is responsible for 14.7% of the Brazilian ceramic production (Camara, Lisboa, Hoinaski, & David, 2015). Camara et al., (2015) developed the first diagnosis of brickfields activity, identifying a group of 318 brick manufacturing companies. The aim was to verify how the atmospheric emissions are considered by brickworks companies.
The methodology consisted of a survey, applying two methods: a questionnaire and an evaluation of environmental assessment documents, as emissions reports presented to the environmental authority. The questionnaire was applied to 151 brickwork companies between January and December of 2012.
The first questions were to inquire about the treatment of gases: if brickworks had some form of gas treatment, what type, cost, reason for installation, whether the equipment presented problems, how often, if the manufacturer provides technical assistance. The second phase of questions raised information on the operational part of the brickfields, namely the fuel used, its quantity, the number of kilns, the weekly occupation of the kilns, whether the control equipment operated during the burning period.
Finally, questions were asked about aspects related to environmental licensing: if the company conducts self-monitoring of emissions, if the environmental licenses are in a regular situation and if have ever been notified due to atmospheric emissions. This
22
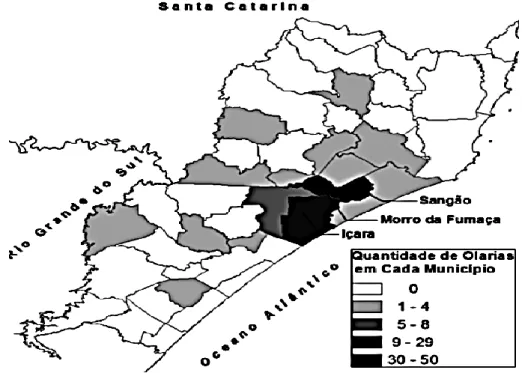
questionnaire was applied exclusively to the municipalities with the highest number of pottery: Morro da Fumaça (51%), Sangão (31%) and Içara (18%), as shown by figure 12.
Figure 12 Distribution of kilns at southern Santa Catarina, Brazil (Camara et al., 2015)
The potteries were classified into four groups according to production capacities, having the most relevant brickworks a production between 200,000 and 400,000 bricks (66.7% of total distribution). 66% of pottery produce bricks, 21% tiles and the rest both products.
From 71 companies questioned, 60 (85%) affirmed to have some type of emissions control equipment. Of these companies, 22 reported the occurrence of problems with the operation of this equipment. The most typical pollutants control system is the scrubber. In addition, 44% of total questioned brickworks have some report of their emissions; in these reports, it was pointed that emissions control equipment have an averaged removal efficiency of 62% for PM and of 33% for SOx (Camara et al., 2015)
The use of the control system varies during the burning stage of the 61 pottery selected. 53% of producer claimed to leave their system running between 5 and 50% of the total
23
operation time and 9% leave the system in activity during the entire operation time that involves the burning stage.
Finally, from 67 potteries with emission reports it was possible to estimate an annual total PM emission of 324 ton/year. In addition, Santa Catarina region has almost the double of
emissions per area (0.703 ton/year in 1 km2) than an urban region as the metropolitan area
of São Paulo (0.385 ton/year in1 km2) (Camara et al., 2015).
2.6 Colombia
In Colombia, brick manufacturing is an important productive sector that has been increasing during the last decade. The brick manufacturing issue is not properly addressed by environmental authorities. A few academic references and municipal authority studies have been produced. The Corporación Ambiental Empresarial (CAEM) presented the first national emissions inventory of bricks industries. This identified 1508 brickworks legally registered in 2015, with 2435 kiln units, which, produce 12,703,872 bricks per year (CAEM, 2015).
The national consumption of fuel in brickworks corresponds to the use of mineral coal, especially type CG1 and CG2 coals that are coal with the highest percentage of calorific power in the market, but that contain high degrees of sulfur, impurities and volatile ashes. However, currently some brickworks are using alternative fuels like firewood, biomass and natural gas. Figure 13 shows the fuel consumption in Colombia, for 2015, identifying the type of fuel, and per dimension of brick companies.
24
Figure 13 Fuels consumptions (Tera calories/year) in Colombia per size brickworks (CAEM, 2015).
According to figure 13, mineral coal is the most used fuel in this sector. The small brickworks consume an average of 1555 Tcal/year, the medium brickworks consume 888 Tcal/year and the big brickworks consume 1390 Tcal coal/year, representing 41, 23 and 36%, respectively, of the national consumption.
The inventory also mentions that Fuego dormido and the Colmena kilns are the most common, with a major national distribution. Based on the production capacity, technological level of transformation, manufactured product and type of furnace, the brick sector in Colombia can be classified as presented in table 2.
Table 2 Production capacity of kilns in Colombia (CAEM, 2015)
Kiln Type Technology Production capacity
(ton/year)
Fuego dormido
Handcrafts Handcrafts <600
Colmena Handcrafts Mechanized crafts 600-2500 Hoffman Mechanical Semi mechanized to
mechanized
5000-10000
25
The Fuego dormido kilns have a smaller production capacity (< 600 tons/year) and a lower energy consumption. A longer burning time per production period is however associated to this kiln and therefore higher particulate matter emissions can be expected.
In the national panorama, craft brickworks represent 51% of the number of kilns and 33% of the total monthly production. Contrary, the big brickworks are 3% of the total number of kilns and represent 25% of the total monthly production (CAEM, 2016).
In Antioquia region, Silva and Valencia, (2013) put into context the current situation of brickworks and tile factories at “Los Gómez” rural locality in the municipality of Itagüí, concerning the environmental impact of this activity for several decades. In this locality there are five brickworks with technified processes.
In Itagüí, PM 2.5 concentrations monitored during the period 2006-2011 were high. Figure 14 shows the annual average of PM2.5 concentrations from 2008 to 2011 in Itagüí; exceedances of the guidance annual value (15 µg/m3) adopted in Colombia and of the annual
limit established by the Resolution 610 of 2010 (25 µg/m3) are observed.
26
For this period, a relation between exposure to PM 2.5 and respiratory disease in the population was identified; 72,585 medical consultations were registered (28% of total population in the municipality) (Silva & Valencia, 2013).
The study concluded that is important to improve the technology in the tiles factories and brickworks, implementing emission control system in order to comply with emission limit established in the current legislation. In addition, it mentions that some of those factories should be relocated due to the environmental risk they represent, not only by their emissions, but also due to the high risk of landslides.
A first approach to air quality assessment in Patio Bonito and other rural localities of Nemocón, Cundinamarca, was developed in 2008 and reported by Rodriguez and Piñeros (2011). The objectives were assessing the local air quality in those rural localities and estimating the emissions from point and mobile sources. The AERMOD dispersion model was used, taking into account an emission sources inventory including 515 brick kilns and an annual average of 135,000 vehicles on nearby highway (Rodriguez & Piñeros, 2011).
Daily concentration values of PM10 were simulated and validated by comparison with data from three monitoring stations. Figure 15 shows the location of these three PM10 sampling points identified as: “La Venta”, “Colegio” and “El Plan”.
Figure 15 Three PM10 sampling points selected in the study: La venta, Colegio and El Plan (Rodriguez & Piñeros, 2011)
27
The monitoring period was from 14 October 2005 to 14 October 2006. In addition, for the air quality assessment, hourly meteorological information (e.g. cloudiness, temperature, relative humidity, atmospheric pressure, wind direction, wind speed, cloud height, precipitation, solar radiation and mixing layer height) was needed in order to run the AERMOD model. This information was taken from the hydro meteorological network of the
Corporación Autónoma Regional de Cundinamarca (CAR) and from the hydro meteorological
network of the Instituto de Hidrología, Meteorología and Estudios Ambientales (IDEAM).
Results allowed identifying PM10 concentrations above the annual limit of 70 µg/m3
established by Resolution 601 of 2006 (modified by Resolution 610 of 2010). In 56 days of the selected period. At the first sampling point (La Venta) the average of the PM10 sampled concentrations was 128 µg/m3 and the modeled value was 100 µg/m3. At the second point
(El plan), the average of PM10 sampled and modeled concentrations were 86 µg/m3 and 58
µg/m3 respectively. Finally, at the third point (Colegio), the average of PM10 sampled and
modeled concentrations were 84 µg/m3 and 58 µg/m3, respectively.
The AQI calculated was 65.81, and thus the air quality was classified as moderate, which means a risk for the health of the local inhabitants. Moreover, according to the national Decree 979 of 2006, the studied area was classified as an area of high pollution (Class I) which means that concentrations values exceed the annual standard with a frequency equal or larger 75%. These areas require taking contingency measures, suspension of new emission sources and pollution reduction programs to be extended for up to ten years (Ministerio de Ambiente, 2006).
29
3.
CHARACTERIZATION
OF
PATIO
BONITO
The present study is focused on the rural locality Patio Bonito, municipality of Nemocón, region of Cundinamarca. In order to characterize the municipality and the rural locality, general aspects in terms of geography, economy, meteorology and climatology are presented. This chapter also describes the brick manufacturing activity, atmospheric emission sources and local air quality in Patio Bonito.
3.1 General information
According to the Departamento Nacional de Estadística (DANE), the municipality of Nemocón has a population of 13,488 inhabitants. The municipality of Nemocón has the main characteristics presented in table 3.
Table 3 Characteristics of the municipality of Nemocón (DANE)
Item Description
Sea level height 2,585 m
Average Temperature 12.8°C
Precipitation 629.7 mm (153 days per year) from September to December
Driest period From December to March
Distance from Bogotá D.C 60 km
Area 98.1 km2
Administrative division 11 rural localities: Agua Blanca, Astorga, Casablanca, Cerro Verde, Checua, La Puerta, Mogua, Oratorio, Patio Bonito,
Perico and Susatá
30
In Nemocón, the brick manufacturing activity is basically developed by hand made in Fuego dormido kilns. These kilns mostly operate in a Chircal, which is a term that designates the operating area of workers taking care of the artisanal elaboration of bricks. The approximate
area of a Chircal is 260 m2.
Patio Bonito is a rural locality strongly affected by brick manufacturing activity. It is located in the 5°13´11.49” North latitude and 73°89´64.32” West longitude. It limits with El Plan
rural locality and with a national highway (route 45A). It has an area of 6.5 km2 and 2500
inhabitants, 1175 belong to the age group between 15 and 44 years old, and 561 between 5-14 years old.
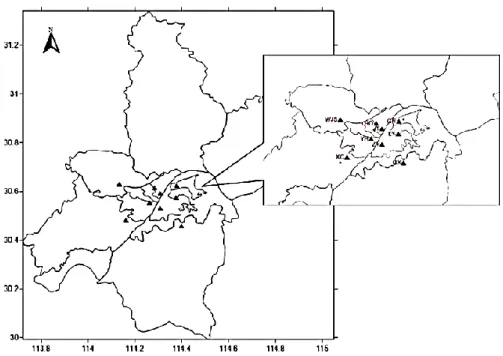
Its height above sea level goes from 2600 m to 2850 m. The terrain is mostly mountainous, having only a semi-flat area to the southwest side; the slope is variable with the lowest (7%) in the half-plane part of the area (Rodriguez & Piñeros, 2011). Figure 16 shows the location of Cundinamarca, Nemocón municipality and Patio Bonito.
Figure 16 Nemocón and Patio Bonito location (URL 2)
Soils are of medium agrological capacity, characterized by a moderately undulating relief, with high sensitivity to erosion and accelerated by the intense exploitation of clay. These
31
soils have extractive mining functions due to their geological characteristics and are currently the object of mining their minerals, mainly clay and coal, in the open and underground. They are part of the territorial units with mining licenses; their uses are conditioned and are subject to the requirements of the environmental authority (Rodriguez & Piñeros, 2011).
Patio Bonito has an urbanized center, an agricultural area, and an exclusion mining area. The main land use is agricultural. However, there are areas with a land use agro industrial, that allows in a legal way the operation of the brickworks activity.
The emission sources inventory of Patio Bonito, for 2008, developed by Rodriguez and Piñeros (2011) identified 515 Fuego dormido, 50 Colmena, 1 Tunnel and 1 Hoffman kilns. In
2013, CAR estimated 470 brick kilns.During the last five years, a reduction of the number of
Fuego dormido kilns has been noted, which could be a result of the competition in the bricks market between medium and big producers, and of their closures due to the lack of land use licenses and sanctions imposed by the municipal and environmental authorities. Currently, the total number of brick kilns is unknown. Figure 17 presents the brick kilns percentage distribution in rural localities of Nemocón in 2013:
32
According to figure 17, Fuego dormido kilns are the most used in Patio Bonito, representing almost 94% of the total kilns, followed by the Colmena kilns. The technological kilns like Hoffman and Tunnel have a low participation in this rural locality.
The majority of brickworks use granulated or pulverized coal known as CG1 and CG2 type. Table 4 shows the main physical-chemical properties of coals used in Nemocón and other municipalities of Cundinamarca region. All values, except humidity of course, are provided as dry basis.
Table 4 Chemical physic properties of used coal in kilns (Sánchez, 2016)
Coal type Humidity (%) Ashes (%) Volatile material (%)
*Sulfur (%) Calorific power (cal/g)
CG-1 4 13 33 1 7200
CG-2 3 11 33 1 7500
*Maximum limit value in Colombia / Resolution 898 of 1995
These coals contain a significant content of volatile material and ashes; their calorific power is the highest of Cundinamarca region. Regarding control emission systems, brickworks in Nemocón do not have technology as scrubbers, filters, electrostatic precipitator etc., generating emissions that can overpass the national limit values (Sánchez, 2016).
In some rural localities of Nemocón like Patio Bonito, there are populated zones nearby Chircales, where kilns known as Fuego dormido, without stacks for gases dispersion are common. Their emissions affect the health of the local inhabitants and their life quality. Figure 18 shows an example of the distance between population centers and brickfields, which can be less than 200 m (Sánchez, 2016).
33
Figure 18 Brick kilns coexisting with populated areas (Sánchez, 2016)
According to the municipal health plan of Nemocón 2012-2015, 230 medical consultation were registered; 167 by acute respiratory tract infection for youngest population (between 1 and 14 years old), and 63 cases by respiratory infection for people over 60 years old (Alcaldía de Nemocón, 2016). Morbidity due to unspecified upper respiratory infections registered 305 cases. In this plan, the local authority recognizes as a certain cause the continuous exposure to atmospheric pollutants generated by brickfields and traditional ways of bricks production as occurs in Patio Bonito.
3.2 Characterization and contribution of emission sources
Patio Bonito has different emission sources types. Brick production activity represents an important number of fixed sources, but also exist road traffic activity and fugitive emissions, which are ruled by the Colombian legislation.
The contribution of emission sources can be estimated based on previously compiled information, namely on emission factors for fixed and mobile sources for Colombia. It was necessary a review of emission factors that could apply for brick manufacturing in Colombia,
34
taking into account the guide AP42 from USEPA and other studies. In addition, data of the traffic flow were consulted in the Ministry of transport.
3.2.1 Brick kilns emissions
Into the brick manufacturing activity, the following point sources operate commonly in Patio Bonito rural locality.
1. Fuego dormido kilns: these kilns can be considered as low production and high pollution sources, due to non-homogeneous burning and incomplete combustion. Once the supply of coal has been completed the kiln is turned on (Herrera, Rodriguez, & López, 2011).The material produced is of low quality, with some scorched bricks.
2. Colmena kilns: are also known as kilns of inverted flame. The dry material is fed by a side door. The fuel can be supplied manually by means of grills placed on the wall of the kiln or automatically by stokers or carbojets. An advantage of these kilns is that fuel are not in contact with the product due to the partition wall.
3. Hoffman kilns: consist of two parallel galleries, formed by adjacent compartments connected by a pipe with flare. They operate continuously with a high production. In these kilns, the fire moves through the kiln in a counter-clockwise direction, this system provides high thermal efficiency and production. The fuel supply is performed at the top of the kiln, manually or with carbojets, (Herrera et al., 2011).
4. Tunnel kilns: are characterized by the fact that the product is cooked continuously moved
in rollers through long gallery approximately 100 m divided into three sectors, preheating, cooking and cooling. These have a high productivity with capacity ranges from 15 to 90
m3/day (CAEM, 2011). These recover the heat from the combustion gases to heat the
incoming load. Figure 19 shows pictures of some types of kilns as: Fuego dormido, Colmena and Hoffman kilns that operate in Patio Bonito.
35
(a) Fuego dormido (b) Colmena
(c) Hoffman (d) Tunnel
Figure 19 Different brick kilns in Patio Bonito (Sánchez, 2016)
In 2013, 440 Fuego dormido, 24 Colmena, 4 Hoffman and 2 Tunnel kilns were identified in
Patio Bonito by CAR (Sánchez, 2016). According to Rodriguez and Piñeros (2011), the
distribution of different classes of Fuego dormido kilns is based on the nominal production capacity during the burning/firing stage. Figure 20 shows the percentage distribution of different Fuego dormido types per nominal production capacity
36
Figure 20 Distribution of Fuego dormido kilns by nominal production capacity (Rodriguez & Piñeros, 2011)
In Patio Bonito, 40% of the total Fuego dormido kilns have a nominal production capacity of 20,000 bricks, followed by kilns with nominal capacity of 40,000 bricks (14%) and with the
same distribution kilns of 25,000 bricks (Rodriguez & Piñeros, 2011). Table 5 presents the
annual coal consumption of each Fuego dormido kiln that operate in Patio Bonito based on their nominal coal consumption capacity during burning stage.
Table 5 Annual coal consumption per Fuego dormido kiln class (Sánchez, 2016)
Fuego dormido nominal production
capacity
Coal consumption (ton coal/year) per
kiln
Number of kilns Total annual coal consumption (ton coal/year) 15000 108 53 5724 20000 144 176 25,344 25000 180 62 11,160 30000 216 48 10,368 35000 252 39 9828 40000 288 62 17,856 Total 80,280
Fuego dormido Kilns with a major amount of mineral coal consumed have a major nominal consumption capacity of this fuel. Table 6 identifies the annual coal consumption for other brick kilns based on their nominal capacity.
0 5 10 15 20 25 30 35 40 45 15000 20000 25000 30000 35000 40000 %
NOMINAL CAPACITY (BRICKS PRODUCED)
Distribution of Fuego dormido by nominal
production capacity
37
Table 6 Annual coal consumption of other brick kilns (Sánchez, 2016)
Kiln type Coal consumption (ton coal/year) per kiln
Number of kilns Total annual coal consumption (ton coal/year) Colmena 864 24 20,736 Hoffman 1020 4 4080 Tunnel 1200 2 2400 Total 27,216
According to table 6, these brick kilns have greater nominal coal consumption capacity than non technified kilns like Fuego dormido. However, their annual consumption is lower than this artisanal kiln. The calculation of brick kilns emissions was based on the use of emission factors and activity data, applying the guide AP42 from USEPA (USEPA, 1995) and it is presented in equation 1. E = EF x A x N Eq (1) Where: E – Emission EF – Emission factor A – Activity indicator
N – Number of fixed sources
The emission factors are based on isokinetic monitoring data of kilns in different brickworks companies in Colombia. Fuego dormido, Hoffman and Tunnel kilns emission factors from the Colombian ministry of the environment were considered. For Colmena kilns, an emission factor compiled in the Bogotá decontamination plan 2010, elaborated by the Secretaría
Distrital de Ambiente (SDA) (Secretaría Distrital de Ambiente, 2010). For all types of brick
kilns, the worst scenario was considered, which means brick kilns without emission control systems.