Master of Science in Business Administration – Major in General Management Master Thesis:
Hidden Public Debt across European Countries
AbstractThe purpose of this paper is to analyze two out of three main types of Hidden Public Debt, Commercial Debt and Public Private Partnerships Financing Needs, across 11 European Countries between 2000-2012.
When faced with the need to raise taxes or reduce spending, governments have for some time turned to a third option by resorting to off book loans and liabilities that do not appear in public accounts. Hidden public debts are those state commitments and liabilities that, despite a lack of specific allocation or inclusion in forecasts and liabilities, are assumed by the government.
Amongst the major results, this article concludes that countries with stronger economies, more transparency of government expenditures and relatively high tax rate stayed in- or moved to the bucket of relatively low debt levels, namely with hidden debt below 1% of GDP. Also, the level of hidden debt within the PIIGS is twice if what the rest of the sample has.
Alexei Filippovitch Panyushkin | 152112146
Supervisors: Professor Ricardo Reis and Professor Joaquim Sarmento
Dissertation submitted in partial fulfillment of requirements for the degree of MSc in Business Administration, at Catolica Lisbon School of Business and Economics
Table of Contents
Introduction ... 3
2. Literature Review ... 6
3. Data and methodology ... 17
4. Recent evolution of public debt in European countries ... 19
5. Hidden government debt. The Portuguese case ... 25
6. International comparison ... 29
7. Conclusions ... 32
References ... 34
List of tables and figures
Table 1. Evolution of government public debt across European countries (% of GDP) ... 20Figure 1. Countries with relatively low level of government public debt ... 21
Figure 2. Countries with moderate level of government public debt ... 22
Figure 3. Countries with relatively high level of government public debt ... 23
Figure 4. Absolute and relative levels of government public debt across European countries for the year 2012 ... 25
Figure 5. Evolution of hidden debt in Portugal ... 27
Figure 6. Fraction of hidden debt in total government debt of Portugal compared to European average weighted by GDP level ... 28
Figure 7. Countries with relatively low level of hidden government debt ... 29
Figure 8. Countries with moderate level of hidden government debt ... 30
Introduction
Despite concepts of transparency and accountability in public budgets as well as internal controls, there continue to be many legitimate and quasi-legitimate ways to hide public deficit debts, and future commitments. Hidden public debts are not exclusive to Europe. Allegations and accusations of hidden debt have been levied in every part of the world against governments.
There is no standard definition of debt, let alone public debt; statisticians, business and government have different methods for determining financial liabilities (Tardos, 2013). The European System of Accounts 2010 states: “Liabilities are established when the debtor is obliged to provide a payment or a series of payments to the creditor”. The financial reporting definition according to International Financial Reporting Standards, the business reporting standard of firms around the world, defines a financial liability as any contractual obligation to deliver cash or asset to another, or exchange assets or liabilities (Tardos, 2013). Here lies some of the problems which occur when discussing hidden public debt. That which is defined as such in one approach may be perfectly reasonable in another. That said, measurement approaches cannot change the real impacts of hidden public debt on economies. There are three main types of hidden public debt across European countries of interest: public private partnerships, commercial debt and state owned enterprise debt.
Hidden public debt across European countries has been in the news since the Eurozone sovereign debt crisis. This crisis revealed the extent of great hidden debts in several budgets of European governments. This is the latest manifestation of hidden deficit, debt and liability. Nevertheless, governments have likely been hiding public debt since the commencement of public budgets.
Several nations had to expend to bail out their banks and financial systems. Three institutions constituted the Troika, the name of bailout programs delivered by the European Commission, the European Central Bank and the International Monetary Fund. To what extent were these events related to hidden public debts in public private partnerships, commercial debt and state owned enterprise debt now and in the past?
The transfer of bailout funds was conditional and required implementing fiscal and structural reforms to ensure strengthened financial systems, however constraints do little to curb hidden deficits and debts, and can in fact increase the tendency when combined with restrictions on a state’s level of borrowing.
Public private partnerships or PPPs are a means of hiding debt, with an added advantage that corporations do not have to present their budgets and spending to the public for review. Examples of the model for financing public infrastructure include roads, buildings and operations such as hospitals, and payment for delivery of services usually provided by the state. Eurostat allows for the exclusion of PPP projects in the public balance sheet providing that the private company or investor takes on both the construction risk and either availability or demand risk (Jurzyca & Goliaš, 2014). User fees collected when in operation rarely cover the ongoing payments the government makes to the private company. The future commitment to make those payments and the gap between revenues sources from the project and payments represent the hidden public debt of the public private partnership. (Jurzyca & Goliaš, 2014). Those Eurozone countries, which required stability support, such as Portugal, are also, those accused of making the most use of PPP projects (Jurzyca & Goliaš, 2014).
Commercial public debts can become hidden debt, as unpaid amounts to suppliers or other amounts owed are left unpaid. The Maastricht definition of government debt used by European nations does not include the unpaid bills of all levels of governments who owe
suppliers. Were these arrears to suppliers included, government debts would become even bigger and therefore further away from the limits under the Maastricht rules in the Eurozone (The Economist, 2013).
In 2013 Italy’s public sector debt level to suppliers became controversial. Building firms, state health-care services, and others selling products and services to the public sector in Italy have dealt with chronic late payments. It was reported that services provided by the construction sector waited nine months or more for payment (The Economist, 2013). The Bank of Italy estimated the amount outstanding to companies by the Italian public sector as €91 billion (The Economist, 2013). Italy is not the only country that has been publicly shamed for non-payment of suppliers. Spain, among others, is alleged to be hiding debts greater than €65 billion (Government of the United Kingdom, 2014).
When the public sector chronically fails to pay bills to suppliers in a reasonable amount of time there are economic impacts as businesses find it increasingly difficult to manage the “involuntary loan” to governments.
How can citizens hold politicians accountable for seeking returns on their public investments when actual costs are hidden? Why are public debt indicators so weak? These problems are not new, nor are they hidden. Despite considerable research and study of the issue, hidden public debt remains a reality which impacts national and international financial flows and economics as well as the price of debt, which determines its sustainability (Tardos, 2013).
2. Literature Review
Public Debt Concept
“Subject to data availability, debt refers to general government consolidated gross financial liabilities as a percentage of GDP, based on the 1993 System of National Accounts (SNA) or on the 1995 European System of Accounts (ESA). The general government sector consists of central, state and local government units together with social security funds controlled by those units. In principle, debts within and between different levels of government are consolidated. In other terms, a loan from one level of government to another represents both an asset for the first level and a liability for the second, and they cancel out for the general government sector as a whole (i.e. are “consolidated”). The SNA/ESA definition differs from the definition of debt applied under the Maastricht Treaty. First, gross debt according to the Maastricht definition excludes trade credits and advances, as well as shares and insurance technical reserves. Second, government debt according to the Maastricht definition is valued at face (i.e. at issue prices) rather than market value as required by the SNA93. The United States and Canada also value government bonds at their face value” (OECD, 2011-2012)
When faced with the need to raise taxes or reduce spending, governments have for some time turned to a third option by resorting to off book loans and liabilities that do not appear in public accounts. Hidden public debts are those state commitments and liabilities that, despite a lack of specific allocation or inclusion in forecasts and liabilities, are assumed by the government. There are many ways that a government or state can artificially reduce their public deficits and debts in this way as well. Greater debts than authorized or considered
acceptable can be achieved using schemes such as derivatives, loans from pension funds, public enterprise, partnerships, unpaid bills and transfers to other governments.
Public Debt Concept over time
Concerns with hidden public debts are not new. Hodge (1867) reported on the budget of the American federal treasury, noting the hidden public debt of the interest payable on bonds. He pointed out that government bonds were listed as liabilities at face value, rather than the value plus the interest liability. Hodge asserted that this represented a hidden debt that was to be paid by future generations, and would in the long term harm financial health as it was not explicitly noted.
Salvemini (1935) reviewed the hidden public debt of the Italian government of 1922-1934 and concluded that, despite difficulties due to accounting that avoids explicitly recognizing certain debt, there was a considerable uncontrolled and unreported liability. Salvemini reviewed the various ways that debt was hidden, in particular commitments to pay companies for infrastructure projects, far into the future.
Parker had in 1942 indicated concern with the hidden liabilities of new old age pension schemes and the lack of alignment with the reality of the liability. Despite having made many proposals in his paper governments and organizations would largely ignore this insight. Others would also point out the inherent hidden debt in the pension model, including allegations of “pyramid schemes”.
The Problem of Information and Representation
Blejer and Cheasty (1991) reported that budget reporting methods still do not accurately portray debts, as flow through amounts flowing through budgets do not capture
all liabilities, and because contingent liability determinations do not include a full determination of present and future expenditures. Daniel, Davis, and Wolfe (1997) further argued that the data collection of oversight bodies such as the International Monetary Fund is not accurately assessing debt circumstances, showing empirically that as noncash operations are often totally excluded from the formal budget, expenses of such operations are not included in calculations of debts and deficits. Easterly (1999) opened the idea that fiscal adjustment was an illusion as deficit flows went off-book.
Methods of Hiding Public Debt
When they grow large, these hidden public debts can cause fiscal and macroeconomic instability. The impacts can depend on the methods used for hiding debt, including interest and currency swaps, future commitments such as pension, banking system and interests and partnerships in public companies.
Swaps
By exchanging floating-rate payments for fixed-rate ones, an interest-rate swap can assist countries to achieve price stability with borrowing costs. A currency swap can serve the same purpose. Authorized transfers from creditor to debtor nations in Europe are unlikely, but they can be hidden as a balance-of-payments in terms of misalignment of internal real exchange rates. Salvemini also noted that the currency conversion of 1934 resulted in a massive drop in the value of the debt. Still, as noted by Kharas and Mishra (2001) in their studies of hidden debts and economic crisis, historical hidden debts affect the future. In the Italian case that has turned out to be true.
Mayer, Thomas & Böttche (2011) report that these swaps are happening today in the Eurozone. In their research, they describe that the amount of subsidies to debtor countries through internal exchange rates on debt is quite high. Since European debtor nations are majority voters of the Governing Council, there are real risks of unauthorized payments of hidden public debt that compromises the system and leads to inflation (Mayer, Thomas & Böttche, 2011). This is the view of the situation from the western nations of the Eurozone with regard to southern and eastern debtor nations.
Swaps and the European Monetary Union
The European Monetary Union was built in sovereignty of states, and each has a national central bank, which is joined in the Eurosystem and reports to the European Central Bank. Chang and Esfahani (2013) describe how these central banks are new economic links between nations. The position of a central bank in the system results in a claim or liability against the ECB. A country with an overvalued internal real exchange rate and fiscal deficit is then considered unsafe, and cut off from private funding. To ensure solvency of the banks, central banks and the ECB become involved and transfers and outflows occur. Banks with overvalued internal real exchange rates rely on their national central bank and the ECB, while banks with undervalued internal exchange rates receive the payments and enjoy liquidity without ECB funds (Chang & Esfahani, 2013).
Pensions
Pension systems accumulate surpluses in early stages, prior to any payouts becoming due. Governments (and organizations) have found it interesting to borrow at low interest rates. This practice eventually leads to a lack of fund’s source needed later to pay the pension
liabilities, but there are other ways to securitize future payments of pensions for an immediate payout. Parker (1942) was the first to point out concern with old pension scheme systems with false surpluses and hidden liabilities, as debts were only recognized when they became due. Governments can buy future pension interests from companies and receive an immediate lump sum. Such schemes were popular in Europe, and in France, beginning with the 1997 takeover by government of France Telecom’s pension liabilities (Paul & Schalck, 2007).
Banking Crisis
Laeven & Valencia (2008) stated that a banking crisis or distress in the financial system could be caused by losses or liquidations, but the potential loss of economic outputs pushes governments to intervene and incur liabilities (2008). Laeven and Valencia (2012) further constructed a databank of all banking crisis dates, costs, and policy responses from 1970-2010. There can be complicated relationships between central banks and governments along with banking systems. In 1994, when the Greek government’s hidden debt became officially recognized it increased the deficit by almost 19% (Von Hagen and Wolff, 2006). Another allegation, as reported in the New York Times, told that Greece, just after admittance to the European Union, partnered with Goldman Sachs on Wall Street to obscure billions in debt from the budget overseers in Brussels using financing instruments that pushed debt far into the future (Story, Landon & Nelson, 2010). These currency trades which amount to loans can be hidden from public view as a liability (Story, Landon & Nelson, 2010).
Public companies can also be a source and a tool for hiding public debt. In 1995, Germany’s debt in addition to its deficit increased by more than 6% of GDP when the debts previously hidden in the former East German industrial company Treuhandanstalt were taken on by the government (Chang & Esfahani, 2013).
Studies About Public Debt
Studies with regard to public debt have followed along two lines of inquiry. The first investigated how restraining government spending impacts hidden debt and deficit activity, and the second looked at how such activities are related to major economic events. In either case various methods must be used to determine total national debt and hidden national debts. Relying on published budgets and balance sheets cannot capture hidden public debts. The International Monetary Fund (IMF) and the World Bank have conducted studies and reports regarding hidden public debt, most of which espouses transparency and inclusion of all liabilities in the official budgets and accounting of states, however this has yet to be perfected in process (Chang & Esfahani, 2013). What follows is a review of some results of these two tracks of research.
Restraints on Government Fiscal Activities
The 1992 Maastricht Treaty limited deficit expenditures and debts of signatory European nations. By this point many European nations had used derivatives and creative methods to reduce the deficit and debt in formal budgets, and they continued to do so after signing the treaty. Von Hagen and Wolff (2006) conducted empirical investigation of European countries, revealing that countries tried to bypass the Maastricht Treaty Rules by increasing off-budget activities (2006). Various methods, some very imaginative, were used to keep expenditures which would otherwise be restricted by European regulation within acceptable boundaries while hidden debts became more attractive to governments.
Kharas and Mishra (2001) overcame the lack of relevance of conventional budget deficits to currency crises by modelling actual deficits, and these did demonstrate a close link
between economic crises and actual hidden deficits. They caution that currency crises are the result of past hidden deficits, in addition to current and future hidden liabilities. Their model describes that the approximate size of hidden future public contingent liabilities can be estimated by averaging over a period of 20-30 years. A proposed solution requires a budget allocation is made annually that is equal to the average compounded hidden deficit. By making it explicit, there is more of a chance that a source of funds or investments can be developed to meet these contingent claims and future volatility resulting from the cyclical impacts of hidden public debt is less likely (Kharas & Mishra, 2001).
Attempts to control government deficits in Europe through externally imposed fiscal regulation (such as the 3% deficit limit) were explored by Von Hagen and Wolff (2006). They found considerable evidence of creative accounting to hide public debt in the European Union. They also found that regulations intended to constrain deficits were a driver, and the tool that was often used was the stock-flow adjustment (SFA) as a substitute for deficit. Large and consistent SFA discrepancies were identified by Weber (2012) in reviewing the annual variance in public debt and budgets, who found that transparency was related to a smaller size of SFA (Chang et al., 2013).
Linkages between Hidden Public Debt and Economic Events
Reinhart and Rogoff (2011) in their “The Forgotten History of Domestic Debt” gather sparse data and literature. Having built a database of public debt since the 1800s, they found that domestic debt accounts for two thirds of public debt, with implications for hidden public debt. Analysis of underlying cycles of public debt and banking crises using longitudinal historical data shows a link between banking crisis and state default across the history of the economies of both developed and developing nations (Reinhart & Rogoff, 2010). Reinhart
and Rogoff (2010) evaluated aggregate and national levels of private debt growth. Their study states that the growth of private debt occurred prior to a banking crisis and that often occurred prior to a national debt crisis.
Restraint of borrowing (for example by the restrictions of deficit and debt of the 1992 Maastrict Treaty) alongside low costs of off-book liabilities adds to the incentive to hide debt (Esfahani & Hoe Joeng, 2002). Chang & Esfahani (2013) developed a model based on these identified factors and this was used to predict the tendency of the state to hide public debt. The model was also used to estimate hidden public debt across various countries. There are, therefore, several ways in which hidden public debt can be estimated from various available data sets, but there is still work to be done to assess accuracy. Approximations for the purpose of research are however becoming common practice.
Public Private Partnerships and Public Debt
Public private partnerships (PPPs) provide private financing for public infrastructure. This practice is thought to provide a new method for financing, as well as project efficiencies and a profit opportunity for private firms. Projects that include PPP have been seen as a solution to raising capital for public projects. Several economists praise the model and believe it has contributed to a world revolution in infrastructure (Grimsley & Lewis, 2004).
In PPPs, the private firm assumes costs and financing responsibility and the government avoids budget and debt impacts with manageable payments to the company over a longer term. According to Sarmento & Renneboog (2014), only the billed costs appear on the budget. Future payments are omitted, yet committed also, but not explicitly through bookkeeping or accounting methods. While the PPP method can bring short term relief to government budgets, it represents a long term strain to future governments through
commitments to payments. As Loxley (2013) stated, “Over time, the additional financing costs of these approaches will lead to yet further fiscal restraint”.
In a PPP the private sector performs or delivers services that would typically be in the domain of the public sector, such as a private firm paid to finance and build a hospital or transfer of operating budget for private firms to take over operation of a water treatment plant (Loxley, 2012). Private firms profit from long term financing fees, retaining savings over government service delivery costs and charging professional and other fees. Loxley (2012) estimates that between 1985 and 2010, almost three thousand PPP projects were undertaken, approximately one third in Europe, with a value measured in the thousands of billions of American dollars (Loxley, 2012). The 2008 financial crisis did, however, take a toll on PPP projects, falling to have the 2007 value of €29.6 billion by 2009 (Loxley, 2014).
The difficulty of assessing PPPs and their costs and value is that in practice PPPs are not included in budgets or balance sheets of governments or their private sector partners, making them essentially invisible factors not considered by voters or for that matter politicians (Heald & Georgiou, 2011).
Criticism has included governments’ use of PPP to avoid making details transparent to citizens. This lack of transparency creates at least three issues when investigating hidden public debt in PPPs: the public’s right to access, the need for transparency of performance and the need for accurate data sets for research (Greve & Hodge, 2012).
When governments use partnerships as a vehicle to lengthen or obscure liabilities and payments, the principle of transparency of public expenditure is compromised. Performance needs to be assessed in democracies in order to make decisions as citizens and, therefore, these costs must be expressed in some way. Further, as these costs and liabilities are hidden,
research regarding potential impacts is difficult, both in looking at past trends as well as future possibilities.
Certainly, various projects have been attempting to build a knowledge base of historical data, but specifically expressing an informed opinion in budgets and balance sheets with regard to off-book transactions could go a long way towards ensuring stability of financial and economic systems as well as government expenditures.
Commercial Debt
The commercial debts of governments to suppliers can be hidden by unreported long term commitment, or by simply not paying debts when they are due. Governments, like households, know that there is more room in a budget if you leave bills unpaid. Such treatment of commercial public debts can occur until it is no longer sustainable (for example, the supplier cuts off supply) or it may be discovered suddenly, as in a transfer of responsibilities. Another method of discovery is the default of a government on a high profile debt to international investors.
Lipton (1981) describes concerns about the abilities of developing countries to pay their debts to the developed countries that provided them with loans (Lipton, 1981). Also, there is another problem and a real concern, government’s hidden debt to corporations.
Governments who default on commercial debts can often get away with it. Despite agreements and resolution, if a government does not pay a commercial entity, there is little they can do. An example was when Ecuador failed to pay debts to foreign bondholders, and it resulted in a considerable amount of complaints to the International Centre for Settlement of Investment Disputes (Porzecanski, 2010). Perhaps those investors should have looked
more closely at Ecuador’s default history, which research shows that it defaulted 109 times in the last 184 years (Porzecanski, 2010).
While it is easy to point to developing nations as the problem, Europe has had its issues with hidden public debt to corporate entities. The transition from communism to capitalism, along with the transfer of state enterprises and their debts is just one example, as Slay (1995) states in his review of the Polish economic transition. San Giorgio, for example, was an association in the 15th through 19th centuries in the Republic of Genoa. Formed in reaction to debtors, it aimed to protect creditors' rights, particularly with regard to collecting from the Republic of Genoa (Fratianni, 2006).
Other Factors of Hidden Public Debt
Hidden liabilities of future spending on programs are a reality, which must be dealt with. Future spending on health, education, security and general capital expenditures should be recognized at its present value.
Future Spending on an Aging Population
While government borrowing is reported on, future spending commitments such as the cost of providing age-related spending is not. In the UK, the Office for Budget Responsibility (OBR) annually publishes a fiscal sustainability report with the same warning, namely that current finances and long term plans are unsustainable even if all deficit reduction targets are met due to the increased costs of delivering public health, pension and social program commitments by 2063 in the context of an aging population (Bourne, 2014).
Salience and Public Debt
There is a psychology to hidden debts, which does not bode well for future generations, “that which is not clearly expressed is also not dealt with”. Almenberg and Karapetyan (2013) argue that salience or the visibility of a cost has a significant impact on decision making, and the observed effect was very large. Their studies on homeowner borrowing behaviour, showing a bias towards the more costly but salient financing schemes, are significant in light of governments and public expenditures. Based on the identified sources of what are currently hidden public debts, the effective measurement, report and inclusion in formal budget and balance sheets would force current governments and citizen to deal with claims made on future taxpayers.
3. Data and methodology
We focus our study on the analysis of government debt structure and evolution across European countries. For this purpose, we selected a sample of 11 countries from different regions of European Union to illustrate different debt evolution dynamics. This narrow selection was chosen due to data limitation but we believe that it is representative, as we include several countries from each geographical location and with different economies. Namely, our sample includes Belgium, Germany, Greece, France, Finland, Ireland, Italy, the Netherlands, Portugal, Spain and the United Kingdom.
Firstly, we use annual data of government public debt and GDP extracted from Eurostat. The figures of GDP are relevant for the analysis because we study the evolution of public debt relatively to GDP to mitigate the effects of size of the economy and to make figures comparable between the countries.
𝑃𝑢𝑏𝑙𝑖𝑐 𝐷𝑒𝑏𝑡 𝑅𝑎𝑡𝑖𝑜𝑡 = 𝑃𝑢𝑏𝑙𝑖𝑐 𝑑𝑒𝑏𝑡𝐺𝐷𝑃 𝑡
𝑡 (1)
Secondly, we continue our analysis by estimating hidden debt, which comes from the sum financing needs of Public-Private partnerships and government commercial debt. The PPPs’ financial needs are cumulated over the period of study to represent total liability of the government over time. We ignore other sources of hidden debt because of scarce data availability. The data on PPPs’ financial needs for the period of 2000-2011 is available in the analytical reports of European Investment Bank. In our calculations, we assume that the value of commercial debt equals the sum of intermediate consumption and other current expenditures multiplied by the average delay in payments measured in fractions of year in a particular country. We obtained the figures of payment delays from the annual European Payment Index reports of Intrum (for missing data points we apply linear interpolation), and the values of intermediate consumption and other expenditures from Eurostat. For the reasons previously mentioned, we also evaluate hidden debt as a ratio to GDP.
𝐶𝑜𝑚𝑚𝑒𝑟𝑐𝑖𝑎𝑙 𝑑𝑒𝑏𝑡𝑡= (𝐼𝐶𝑡+ 𝑂𝐸𝑡)𝐴𝑣𝑒𝑟𝑎𝑔𝑒 𝑑𝑎𝑦𝑠 𝑑𝑒𝑙𝑎𝑦𝑒𝑑 𝑖𝑛 𝑝𝑎𝑦𝑚𝑒𝑛𝑡𝑠 𝑡
365 (2)
𝐻𝑖𝑑𝑑𝑒𝑛 𝐷𝑒𝑏𝑡 𝑅𝑎𝑡𝑖𝑜𝑡 = 𝑃𝑃𝑃 𝑓𝑖𝑛𝑎𝑛𝑐𝑖𝑎𝑙 𝑛𝑒𝑒𝑑𝑠𝐺𝐷𝑃𝑡+𝐶𝑜𝑚𝑚𝑒𝑟𝑐𝑖𝑎𝑙 𝑑𝑒𝑏𝑡𝑡
𝑡 (3)
Finally, to divide the countries into subgroups based on their exposure to public/hidden debt, we estimate the average values of the ratios above. We also weight the average ratio by GDP of constituents, to avoid large impact of small economies.
𝑊𝑒𝑖𝑔ℎ𝑡𝑒𝑑 𝐴𝑣𝑒𝑟𝑎𝑔𝑒 𝐷𝑒𝑏𝑡 𝑅𝑎𝑡𝑖𝑜𝑡= ∑11𝑖=1𝐷𝑒𝑏𝑡 𝑅𝑎𝑡𝑖𝑜𝑖,𝑡∗𝐺𝐷𝑃𝑖,𝑡
∑11𝑖=1𝐺𝐷𝑃𝑖,𝑡 (4)
4. Recent evolution of public debt in European countries
Public debt of a country represents the debt that is owned by the central government. The deficit or the surplus of the government budget, which arises from the difference between government receipts and spending during the reporting period, decreases or increases the level of public debt respectively1. Public debt is a widely spread method of funding government operations and is also a source of financing flexibility.
Typically, the public debt comes from issuing securities, government bonds and bills. However, developing countries and the economies affected by financial crisis can also borrow directly from international financial organizations and institutions, such as International Monetary Fund, World Bank, European Central Bank etc. Government debt can be classified into external and internal, depending on the lender’s origin, and into short-, middle- and long term, conditional on the maturity of claims. Apart from mentioned, different classifications may also include the currency of the borrowings, type of guarantee or securitization and others.
The policy of the government regarding its debt, the evolution of the debt level and its ratio to GDP is an important issue for every country and its citizens. The debt of the government appears to be indirect debt of the taxpayers as taxes are the main source of budget funding for most of the countries. Therefore, the level and the risks of public debt should be under careful control using fiscal and the monetary levers. Depending on the economic conditions within the country, these risks are reflected in the yields on public debt. In other words, the returns required by the lenders mirror the relative solvency of the country and the likelihood of full debt repayment or default. But the default risk is not the only to be
considered while evaluating public debt issues. Among others, the political risk, coming from the change of the government or regime inside the country, the interest rate risk, arising from the general economic conditions in the world, and the foreign exchange rate for external borrowings should be accounted for.
The government debt of most developed and emerging countries is public information and is available in periodical statistical releases. Making this information available to general public increases transparency of economy and international relations.
For all the countries from selected sample the absolute level of public debt is always increasing with time. Over the last decade for some countries, such as Belgium and Italy, it increased by nearly 50%, whereas for others, such as Germany, Greece or France, it rose twice. In some cases, like Ireland or Spain, the public debt surged by 300% and even more. Table 1 presents the figures of annual public debt level relatively to GDP of 11 European countries.
Table 1. Evolution of government public debt across European countries (% of GDP)
2002 2003 2004 2005 2006 2007 2008 2009 2010 2011 2012 Belgium 103.4 98.4 94.0 92.0 88.0 84.0 89.2 95.7 95.5 97.8 99.8 Germany 60.7 64.4 66.2 68.5 68.0 65.2 66.8 74.5 82.5 80.5 81.6 Ireland 32.0 30.7 29.5 27.3 24.6 25.0 44.5 64.9 92.2 106.4 117.2 Greece 101.7 97.4 98.9 101.2 107.5 107.2 112.9 129.7 148.3 170.6 161.6 Spain 52.6 48.8 46.3 43.2 39.7 36.3 40.2 53.9 61.5 69.3 88.4 France 59.0 63.2 65.0 66.7 64.0 64.2 68.2 79.2 82.3 86.0 90.3 Italy 105.1 103.9 103.4 105.7 106.3 103.3 106.1 116.4 119.2 120.7 127.1 Netherlands 50.5 52.0 52.4 51.8 47.4 45.3 58.5 60.8 63.1 65.5 70.8 Portugal 56.8 59.4 61.9 67.7 69.4 68.4 71.7 83.2 93.5 108.0 120.6 Finland 41.5 44.5 44.4 41.7 39.6 35.2 33.9 43.5 48.6 49.0 53.4 UK 37.7 39.1 41.0 42.2 43.3 44.2 52.3 67.8 79.4 85.2 89.8 Source: Eurostat
However, the increase of government debt is not necessarily related to constant budget deficits and poor fiscal and monetary policy of the country. As the economy grows, the financing needs increase proportionally. For this reason, we need to exclude the economy
growth component from the growth of public debt. The easiest and most effective way to do it would be to evaluate the ratio of public debt to GDP, which is a commonly used measure of economy growth and maturity. By doing this, we also make countries comparable with each other, mitigating the size impact. In Figures 1-3 we split the countries into three subgroups – with low, moderate and high level of public debt relatively to GDP by comparing the evolution of the mentioned ratio with Europe-wide average figures.
Source: Eurostat
Note: The solid lines on the charts represent the ratio of public debt to GDP of the respective countries. The dotted lines stand for the average of this ratio weighted by GDP level across 11 European countries studied.
Out of 11 chosen countries, we include Finland, United Kingdom, Netherlands and Spain to the group of countries with relatively low level of public debt. During the last 13 years the debt level was constantly below European average, ranging in between 30% and 80% of GDP. By looking into the average ratio, one can conclude that the 2008-2009 financial crisis caused the growth of relative public debt level within entire Eurozone. In developed countries of Northern Europe the low levels of public debt to GDP are common
Figure 1. Countries with relatively low level of government public debt
0 30 60 90 120 2 0 0 0 2 0 0 1 2 0 0 2 2 0 0 3 2 0 0 4 2 0 0 5 2 0 0 6 2 0 0 7 2 0 0 8 2 0 0 9 2 0 1 0 2 0 1 1 2 0 1 2 % o f GDP
Finland
Europe average 0 30 60 90 120 2 0 0 0 2 0 0 1 2 0 0 2 2 0 0 3 2 0 0 4 2 0 0 5 2 0 0 6 2 0 0 7 2 0 0 8 2 0 0 9 2 0 1 0 2 0 1 1 2 0 1 2 % o f GDPUnited Kingdom
Europe average 0 30 60 90 120 2 0 0 0 2 0 0 1 2 0 0 2 2 0 0 3 2 0 0 4 2 0 0 5 2 0 0 6 2 0 0 7 2 0 0 8 2 0 0 9 2 0 1 0 2 0 1 1 2 0 1 2 % o f GDPNetherlands
Europe average 0 30 60 90 120 2 0 0 0 2 0 0 1 2 0 0 2 2 0 0 3 2 0 0 4 2 0 0 5 2 0 0 6 2 0 0 7 2 0 0 8 2 0 0 9 2 0 1 0 2 0 1 1 2 0 1 2 % o f GDPSpain
Europe averageand expected to remain below the average due to high tax burden. This policy allows filling the budget with taxes and makes it easier to bear interest and principal repayments on state borrowings. The UK and Spain though, even being below average levels during last decade, are now on the margin. While for the UK, which is one of the largest and strongest economies inside the European Union with high levels of economic activity and positive future growth indicators, it is most likely expected and controlled, the rapid growth of public debt in Spain is an echo of a decade-long property bubble. The Spanish government is trying to reduce or at least maintain budget deficit level by increasing taxes, cutting salaries of public sector and reducing state expenses on education and health care, which triggered the disturbance among the population that is now resulting in mass strikes and protests. Even though we focus on the time period up to 2012 due to data limitations, the analysts forecast Spanish public debt level to cross 100% of GDP in 2014-2015 for the first time in modern history, far above the number agreed between European Union members (Bloomberg).
Source: Eurostat
Note: The solid lines on the charts represent the ratio of public debt to GDP of the respective countries. The dotted lines stand for the average of this ratio weighted by GDP level across 11 European countries studied.
In the subgroup of countries with moderate level of debt we want to point out Germany and France. These countries maintain the average European debt-to-GDP ratio over
Figure 2.Countries with moderate level of government public debt
0 30 60 90 120 2 0 0 0 2 0 0 1 2 0 0 2 2 0 0 3 2 0 0 4 2 0 0 5 2 0 0 6 2 0 0 7 2 0 0 8 2 0 0 9 2 0 1 0 2 0 1 1 2 0 1 2 % o f GDP
Germany
Europe average 0 30 60 90 120 2 0 0 0 2 0 0 1 2 0 0 2 2 0 0 3 2 0 0 4 2 0 0 5 2 0 0 6 2 0 0 7 2 0 0 8 2 0 0 9 2 0 1 0 2 0 1 1 2 0 1 2 % o f GDPFrance
Europe averagethe last decade. This is in line with our expectations as these countries are the largest economies in Eurozone and are proven to be stable through years. As our average measure is GDP-weighted, the countries with highest GDP tend to ‘lead’ the rest.
Source: Eurostat
Note: The solid lines on the charts represent the ratio of public debt to GDP of the respective countries. The dotted lines stand for the average of this ratio weighted by GDP level across 11 European countries studied.
We finish our public debt-to-GDP analysis with countries demonstrating high levels of the ratio. All the countries from PIIGS excluding Spain exhibit high and growing level of sovereign debt. However, this maintains over the last decade and more for Italy and Greece, which suggests separating these countries into a different subgroup. Although Italy displays a more stable situation, being in the top five largest European economies, the situation in
Figure 3.Countries with relatively high level of government public debt
0 30 60 90 120 150 2 0 0 0 2 0 0 1 2 0 0 2 2 0 0 3 2 0 0 4 2 0 0 5 2 0 0 6 2 0 0 7 2 0 0 8 2 0 0 9 2 0 1 0 2 0 1 1 2 0 1 2 % o f GDP
Ireland
Europe average 0 30 60 90 120 150 2 0 0 0 2 0 0 1 2 0 0 2 2 0 0 3 2 0 0 4 2 0 0 5 2 0 0 6 2 0 0 7 2 0 0 8 2 0 0 9 2 0 1 0 2 0 1 1 2 0 1 2 % o f GDPPortugal
Europe average 0 30 60 90 120 150 180 2 0 0 0 2 0 0 1 2 0 0 2 2 0 0 3 2 0 0 4 2 0 0 5 2 0 0 6 2 0 0 7 2 0 0 8 2 0 0 9 2 0 1 0 2 0 1 1 2 0 1 2 % o f GDPGreece
Europe average 0 30 60 90 120 2 0 0 0 2 0 0 1 2 0 0 2 2 0 0 3 2 0 0 4 2 0 0 5 2 0 0 6 2 0 0 7 2 0 0 8 2 0 0 9 2 0 1 0 2 0 1 1 2 0 1 2 % o f GDPBelgium
Europe average 0 30 60 90 120 150 2 0 0 0 2 0 0 1 2 0 0 2 2 0 0 3 2 0 0 4 2 0 0 5 2 0 0 6 2 0 0 7 2 0 0 8 2 0 0 9 2 0 1 0 2 0 1 1 2 0 1 2 % o f GDPItaly
Europe averageGreece is close to catastrophic with a public debt-to-GDP ratio reaching almost 180% in 2014. Continuous money tranches and other measures aimed to save the Greek economy are not providing expected results. The Greek government implemented a set of reforms to fight corruption and tax evasion and to improve tax collection procedures, but the outcomes are still far below anticipated. However, the ECB has expectations of economic climate improvement during the following years due to further stimulating measures that will be applied to Greece if the new government will reach an agreement with the EU to restructure its debt.
Portugal and Ireland have crossed the average margin after the global recession of 2008, which triggered sovereign debt crisis in the majority of European countries. Another factor of surging public debt level relatively to other countries is the decreasing GDP growth in Portugal and Ireland during recent years.
In conclusion, to highlight once again the importance of relative comparison, we provide absolute and related to economy size figures of public debt within the selected sample of European countries as of the year 2012.
5. Hidden government debt. The Portuguese case
We continue our research with a broader concept of government debt, namely by estimating hidden debt, in the following sections. Apart from direct public debt, the debt of governments may also consider all government liabilities, both on- and off-balance sheet. The latter includes debt arising from Public-Private partnerships financing needs, implicit commercial debt, operations with currency and interest rate swaps, complex schemes with pension liabilities etc. Hidden debt might result into inaccurate evaluation of country’s solvency and creditworthiness, and also into decreasing transparency of tax income usage. Due to scarce amount of previous research and data available we focus on the first two cases. We believe that the conclusions would remain qualitatively the same even after a deeper analysis. 104 191 200 313 378 426 927 1,389 1,834 1,988 2,158 0 500 1000 1500 2000 2500 € B il. 53 117 121 162 100 71 88 90 90 127 82 0 30 60 90 120 150 180 F in lan d Ire lan d P o rtu g al Gre e ce Be lg iu m Ne th erlan d s S p a in UK F ra n c e Ita ly Ge rm an y % o f GDP
Figure 4. Absolute and relative levels of government public debt across European countries for the year 2012
A Public-Private partnership (PPP) arises when a business or a service is operated and financed through a partnership of one or more private entities with government. Typically, the technical and operational risks are transferred to the private venture, whereas the financial risks are split between both sides of the partnership. In the PPPs related to creation of public goods, the private party often receives support and incentives, including grants, subsidies and tax deductions. On the one hand, commonly, such partnerships are also beneficial to government. Private companies, experienced in particular service or business, bring the efficiency which would otherwise be lacking. On the other hand, the implicit return of the private venture is typically higher than the yield on government bonds, even though most of the risks related to revenues are carried by the public sector. As a result, it makes the taxpayers pay less compared to the situation if solely the government financed the project. Additionally, there are projects, in which the final users, not the taxpayers, pay the costs of service. In these cases, the financing of such projects remains off balance sheet for the government, resulting in hidden debt, which is the main issue in our research.
Another type of hidden debt considered in the dissertation is the commercial debt of the governments, which we define as a sum of intermediate consumption and other current expenditures times the average time delays on payments in fraction of years. The delay in payments creates short-term liabilities which are off the country’s balance sheet.
We start our research with the Portuguese example and, as in case of public debt, we analyze hidden debt relatively to GDP to elude the effect of size of the economy. Figure 5 presents the evolution of hidden debt arising from commercial and PPP constituents.
Figure 5. Evolution of hidden debt in Portugal
Source: Eurostat
Note: Om the upper panel of the figure the red bars represent the ratio of commercial debt to GDP and the blue bars stand for the ratio of accumulated PPPs’ financial needs to GDP. The dotted line indicates the fraction of commercial and PPP hidden debts in total government debt. The lower panel of the figure represents investments in PPPs in percentage of GDP by year. The figures of PPPs’ financial needs were unavailable for the year 2012, so the total level of hidden debt might be different.
The PPPs in Portugal has been a widely spread way to fund and operate public services. The number and the size of PPP deals during the last two decades are the third largest in Eurozone (approximately 7% of total market), being behind Spain and the UK (Campra et al., 2014). Between 1995 and 2013, 45 PPP projects, totally almost EUR 21 bn. worth, have reached financial close in Portugal – 25 in the road sector (almost 92% in value), 9 in the utility sector, 6 in the health sector and 4 in other sectors (European Investment Bank). 2.0 3.3 3.7 3.7 4.4 4.5 4.7 4.6 6.9 8.3 9.9 10.0 10.4 0.6 1.6 1.6 1.5 1.5 1.5 1.5 1.8 1.6 1.4 0.0 3.0 6.0 9.0 12.0 15.0 2 0 0 0 2 0 0 1 2 0 0 2 2 0 0 3 2 0 0 4 2 0 0 5 2 0 0 6 2 0 0 7 2 0 0 8 2 0 0 9 2 0 1 0 2 0 1 1 2 0 1 2 % o f GDP PPP debt Comercial debt % of total debt 2.01 1.42 0.57 0.88 0.25 0.34 0.16 2.34 1.33 1.81 0 0.5 1 1.5 2 2.5 2 0 0 0 2 0 0 1 2 0 0 2 2 0 0 3 2 0 0 4 2 0 0 5 2 0 0 6 2 0 0 7 2 0 0 8 2 0 0 9 2 0 1 0 2 0 1 1 2 0 1 2 % o f GDP
As an advantage of such partnerships, one should consider that many major projects, such as highways, hospitals and bridges would not be possible, leaving the final consumers without needed quality services. However, the complexity of the long term decision-making processes, regulative and legislative framework, makes such projects needed to be planned very carefully. The lack of experience with PPP deals and insufficient risk transfer to private entities often resulted into constant delays and budget overruns.
The commercial debt in Portugal stayed on a stable level of 1.5-1.8% of GDP during last decade. This number is also high in relation to other countries of Eurozone, making Portugal a country with a high level of total hidden debt. To illustrate this fact, we present Figure 6.
Figure 6. Fraction of hidden debt in total government debt of Portugal compared to European average weighted by GDP level
Source: Eurostat
One should notice that the recent decrease of hidden debt level for Portugal is a result of not uniformly distributed financial closes of PPP deals over time (for example, in 2011 there were no closing deals at all). However, we still can observe an increasing pattern.
0.0 5.0 10.0 15.0 2 0 0 0 2 0 0 1 2 0 0 2 2 0 0 3 2 0 0 4 2 0 0 5 2 0 0 6 2 0 0 7 2 0 0 8 2 0 0 9 2 0 1 0 2 0 1 1 2 0 1 2 % o f GDP
If to this number we could add the hidden debt arising from other sources than PPPs and commercial debt, the fraction of it would be even more significant for the Portuguese economy.
6. International comparison
After a detailed analysis of Portuguese case, in this section we focus on the hidden debt of other European countries. In line with the section devoted to public debt, we split the countries into sub-samples based on their PPP and commercial hidden debts to GDP ratio (See Figures 7-9).
Source: Eurostat
Note: The red bars represent the ratio of commercial debt to GDP and the blue bars stand for the ratio of accumulated PPPs’ financial needs to GDP. The dotted line indicates the fraction of commercial and PPP hidden debts in total government debt. The figures of PPPs’ financial needs were unavailable for the year 2012, so the total level of hidden debt might be different.
As anticipated, the sub-group with low relative level of hidden debt consists of highly developed countries of Central and Northern Europe. High level of GDP, transparency of the economy, relatively high level of taxes and a strong regulatory base are not exclusive reasons for this phenomenon. Low level of PPP activity in these countries is most likely caused by the ability of the governments to fund and operate public services using internal funding, mainly coming from taxes, without participation of private parties. Overall, during the last
Figure 7. Countries with relatively low level of hidden government debt
0.0 0.5 1.0 1.5 2.0 2 0 0 0 2 0 0 1 2 0 0 2 2 0 0 3 2 0 0 4 2 0 0 5 2 0 0 6 2 0 0 7 2 0 0 8 2 0 0 9 2 0 1 0 2 0 1 1 2 0 1 2 % o f GDP
Germany
PPP debt Commercial debt 0.0 0.5 1.0 1.5 2.0 2 0 0 0 2 0 0 1 2 0 0 2 2 0 0 3 2 0 0 4 2 0 0 5 2 0 0 6 2 0 0 7 2 0 0 8 2 0 0 9 2 0 1 0 2 0 1 1 2 0 1 2 % o f GDPFinland
PPP debt Commercial debtdecade, the level of hidden debt in these developed countries never reached 1% of GDP and hardly surpassed 1% of total debt level in case of Finland.
Source: Eurostat
Note: The red bars represent the ratio of commercial debt to GDP and the blue bars stand for the ratio of accumulated PPPs’ financial needs to GDP. The dotted line indicates the fraction of commercial and PPP hidden debts in total government debt. The figures of PPPs’ financial needs were unavailable for the year 2012, so the total level of hidden debt might be different.
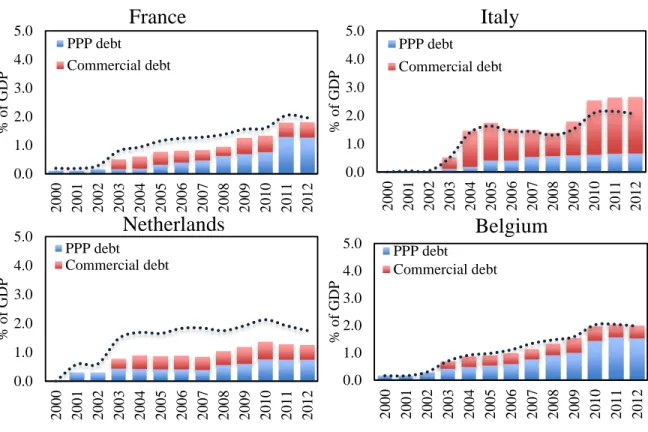
Likely to the previous subgroup, countries with strong, healthy economies, like France, Belgium and Netherlands are the members of the ‘moderate risk’ group. However, the hidden part of government debt is still considerably higher in these countries. Italy is clearly a country with higher level of unreported debt in this subgroup, which puts it on the margin of high hidden debt level. This is mainly caused by larger amount of PPP deals and, therefore, relatively higher levels of outstanding financing liabilities.
Figure 8.Countries with moderate level of hidden government debt
0.0 1.0 2.0 3.0 4.0 5.0 2 0 0 0 2 0 0 1 2 0 0 2 2 0 0 3 2 0 0 4 2 0 0 5 2 0 0 6 2 0 0 7 2 0 0 8 2 0 0 9 2 0 1 0 2 0 1 1 2 0 1 2 % o f GDP
Belgium
PPP debt Commercial debt 0.0 1.0 2.0 3.0 4.0 5.0 2 0 0 0 2 0 0 1 2 0 0 2 2 0 0 3 2 0 0 4 2 0 0 5 2 0 0 6 2 0 0 7 2 0 0 8 2 0 0 9 2 0 1 0 2 0 1 1 2 0 1 2 % o f GDPFrance
PPP debt Commercial debt 0.0 1.0 2.0 3.0 4.0 5.0 2 0 0 0 2 0 0 1 2 0 0 2 2 0 0 3 2 0 0 4 2 0 0 5 2 0 0 6 2 0 0 7 2 0 0 8 2 0 0 9 2 0 1 0 2 0 1 1 2 0 1 2 % o f GDPNetherlands
PPP debt Commercial debt 0.0 1.0 2.0 3.0 4.0 5.0 2 0 0 0 2 0 0 1 2 0 0 2 2 0 0 3 2 0 0 4 2 0 0 5 2 0 0 6 2 0 0 7 2 0 0 8 2 0 0 9 2 0 1 0 2 0 1 1 2 0 1 2 % o f GDPItaly
PPP debt Commercial debtSource: Eurostat
Note: The red bars represent the ratio of commercial debt to GDP and the blue bars stand for the ratio of accumulated PPPs’ financial needs to GDP. The dotted line indicates the fraction of commercial and PPP hidden debts in total government debt. The figures of PPPs’ financial needs were unavailable for the year 2012, so the total level of hidden debt might be different.
We observe a different picture in the countries which were strongly affected by the sovereign debt crisis. Including Portugal, all PIGS members have the hidden debt level on average twice or more higher compared to the countries from the previous sub-group. However, during recent years, low PPP activity efforts to reduce delays on commercial payments in Ireland significantly decreased the ratio. From the results obtained in this section, we can conclude that our estimated level of hidden debt for European countries is a better proxy of general health of the economy compared to public debt figures. The only exception to this consistent pattern is the UK which is in the ‘high risk’ group. The reason for that, however, is that the PPP market in the UK is extremely large, accounting for over 53% of all deals within total European market during last two decades (Campra et al., 2014).
0.0 2.0 4.0 6.0 8.0 10.0 2 0 0 0 2 0 0 1 2 0 0 2 2 0 0 3 2 0 0 4 2 0 0 5 2 0 0 6 2 0 0 7 2 0 0 8 2 0 0 9 2 0 1 0 2 0 1 1 2 0 1 2 % o f GDP
Ireland
PPP debt Commercial debt 0.0 2.0 4.0 6.0 8.0 10.0 2 0 0 0 2 0 0 1 2 0 0 2 2 0 0 3 2 0 0 4 2 0 0 5 2 0 0 6 2 0 0 7 2 0 0 8 2 0 0 9 2 0 1 0 2 0 1 1 2 0 1 2 % o f GDPGreece
PPP debt Commercial debt 0.0 2.0 4.0 6.0 8.0 10.0 2 0 0 0 2 0 0 1 2 0 0 2 2 0 0 3 2 0 0 4 2 0 0 5 2 0 0 6 2 0 0 7 2 0 0 8 2 0 0 9 2 0 1 0 2 0 1 1 2 0 1 2 % o f GDPSpain
PPP debt Commercial debt 0.0 3.0 6.0 9.0 12.0 15.0 2 0 0 0 2 0 0 1 2 0 0 2 2 0 0 3 2 0 0 4 2 0 0 5 2 0 0 6 2 0 0 7 2 0 0 8 2 0 0 9 2 0 1 0 2 0 1 1 2 0 1 2 % o f GDPUnited Kingdom
PPP debt Commercial debtNonetheless, to observe the full picture, the analysis of other sources of hidden debt is required, which can be a topic for future researchers.
7. Conclusions
Government debt is without a doubt one of the key indicators of financial health of the country. However, as we made it clear earlier, the notional value itself does not say much and is a rather poor indicator, when comparing financial burdens across different countries. Moreover, as growth is usually accompanied by the increase in financing needs, growing nominal debt can reflect positive trend for a particular country or region, reflecting its expansion is on the right track. To avoid taking misleading conclusions, we have estimated public debt relative to GDP instead of looking only into nominal amounts as it gives a better picture of financial solvency of the country. The results we obtained enabled us to distinguish European countries into three buckets relatively to the average government Debt to GDP levels of Europe as a whole: relatively low (below 80% of GDP), moderate (between 80% and 110%) or high levels (above 110%) of public debt. Out of 11 countries we analyzed, 4 were classified as having relatively low levels of debt (Spain, UK, Finland and the Netherlands) that were able to balance their financing needs by introducing measures of austerity like tax hikes or social expenditure cuts. The second bucket consists of Germany, France, Portugal and Italy where levels were mostly in line with the European average over the past years. The last, but not the least – third bucket of relatively high levels of public debt includes Greece, Belgium and Italy. Aside from that we have noted that the European Sovereign Debt crisis was a game changer for some of the countries within each of the buckets. Greece, Portugal, Spain and Ireland were forced to expand the amounts of their liabilities, as they were unable to finance their needs within the revenues generated within
the country. However, the final goal of the dissertation was to see if the hidden debt is material within the European Union and whether the levels of it vary across the countries and may provide relevant information to measure financial viability of a particular state. We have used commercial government debt and PPP (Public-Private Partnerships) accumulated financing needs as a proxy for hidden debt as they are not accounted as the balance-sheet items, yet they represent cash outflows that the government is committed to cover, thus deteriorating financial solvency of the sovereign. After analyzing hidden debt we have noticed that the constituents of the buckets slightly changed and were more in line with our initial expectations. Countries with stronger economies, more transparency of government expenditures and relatively high tax rate stayed in- or moved to the buckets of relatively low or moderate debt levels, namely with hidden debt below 1% and below 2.5% of GDP respectively. At the same time, southern-European countries (with Italy on the margin between subgroups) including Portugal were among the lagging ones. This can be explained by the fact that infrastructure of those sovereigns was poorly developed, comparing to their northern- and central-European peers, and by the fact that after joining the EU they got access to relatively cheap financing sources. On the back of this, numerous of PPPs rose in those countries to initiate projects that are required by the society, yet generate low returns making them not attractive for private companies (highways, healthcare projects, bridges). The level of hidden debt within the PIGS is at least twice of what the rest of the sample has. Such developments in those countries deteriorated fiscal conditions even further causing the governments to move forward with the austerity measures (tax hikes, spending cuts etc.) in order to be able to service the debt and avoid going default.
References
1. Almenberg, Johan, and Artashes Karapetyan. Hidden Costs of Hidden Debt. Review of Finance. 2013.
2. Blejer, M. I., & Cheasty, A. (1991). The measurement of fiscal deficits: analytical and methodological issues. Journal of Economic Literature, 1644-1678.
3. Bourne, Ryan. How to defuse Britain’s £1.45 trillion public-debt time-bomb. The Spectator. 29 October 2014.
4. Campra, M., Oricchio, G., Braja, E. M. and Esposito, P. Sovereign Risk and Public-Private Partnership During the Euro Crisis, The Palgrave Macmillan, 2014.
5. Chang, Euisoon, and Hadi Salehi Esfahani. On the Determinants of Hidden Public Debt. University of Champagne-Urbana, Illinois. 2013.
6. Daniel, J., Davis, J., & Wolf, A. Fiscal Accounting of Bank Restructuring. IMF Paper on Policy Analysis and Assessment. PPAA/97/5, Washington, DC. 1997.
7. Easterly, William.. "When is Fiscal Adjustment an Illusion?" Economic Policy, 14: 55-86. 1999.
8. EIB. PPP Units and Related Institutional Framework, 2014. Available at: http://www.eib.org/epec/resources/Portugal_PPP_Unit_and_Related_Institutional_F ramework.pdf.
9. Esfahani, Hadi Salehi, and Hoe Joeng Kim. Hiding public debt. Economic Research Forum for the Arab Countries, Iran and Turkey, 2002.
10. Fratianni, M. “Government debt, reputation and creditors' protections: the tale of San Giorgio”. Review of Finance, 10(4), 487-506. 2006.
11. Government of the United Kingdom. Overseas Business Risk – Spain. Foreign and Commonwealth Office. (2014).
12. Greve, Carsten, and Graeme Hodge. "Public-Private Partnerships: Observations on Changing Forms of Transparency." In Paper to the Transatlantic Conference on Transparency Research, Utrecht University, pp. 7-9. 2012.
13. Grimsley, D.; Lewis, M. K.. Public private partnerships - the worldwide revolution in infrastructure provision and project finance. Cheltenham: Edward Elgar Publishing, 2004.
14. Heald, David, and George Georgiou. "The Substance of Accounting for Public‐ Private Partnerships." Financial Accountability & Management 27, no. 2 2011): 217-247.
15. Hodge, William L. The Public Debt, the Currency, Specie Payments, and National Banks. Intelligencer printing house, 1867.
16. Jurzyca, Eugen, and Peter Goliaš. "Solutions to Public Debt Crises in the EU: Seek Returns on That Investment (Views from Slovakia)." PISM Strategic Files 39 (2014): 01-08.
17. Kharas, H., & Mishra, D. Fiscal Policy, Hidden Deficit, and Currency Crises. In World Bank Economists’ Forum Vol. 1, 2001. pp. 31-48.
18. Laeven, Luc, and Fabián Valencia. "Systemic Banking Crises Database: An Update", International Monetary Fund. 2012.
19. Lipton, M. “World Depression by Third World Default?: The need to link debt guarantees to tri‐cycling”. The IDS Bulletin, 12(2), 45-54. 1981.
20. Loxley, J. Public-private partnerships after the global financial crisis: Ideology trumping economic reality. Studies in Political Economy, 89, 7-37. 2012.
21. Mayer, Thomas, and Barbara Böttcher. "Euroland’s hidden balance-of-payments crisis." Deutsche Bank Research 26 2011.
22. Parker, J. S. "The True Meaning of" Pay-As-You-Go" in Financing Old Age Retirement." The Social Service Review 1942): 75-85.
23. Paul, Laurent, and Christophe Schalck. "Transfers to the government of public corporation pension liabilities: The French case study." In MNB Conference Volume, vol. 1, no. 1, pp. 72-80. Magyar Nemzeti Bank the central bank of Hungary), 2007. 24. Porzecanski, A. “When Bad things Happen to Good Sovereign Debt Contractors: The
Case of Ecuador”. Law & Contemp. Probs., 73, 251. 2010.
25. Reinhart, Carmen M., and Kenneth S. Rogoff. From financial crash to debt crisis. No. w15795. National Bureau of Economic Research, 2010.
26. Reinhart, C. M., & Rogoff, K. S. The Forgotten History of Domestic Debt. The Economic Journal, 121552), 319-350 2011.
27. Salvemini, Gaetano. "Twelve Years of Fascist Finance." Foreign Affairs 13, no. 3 1935): 473-482.
28. Sarmento, Joaquim Miranda, and Luc Renneboog. "Public-Private Partnerships: Risk Allocation And Value For Money." 2014.
29. Slay, B. “The Polish Economic Transition”. East-Central European Economies in Transition, 463-479. 1995.
30. Story, Louise, Landon Thomas Jr, and Nelson D. Schwartz. "Wall St. Helped to Mask Debt Fueling Europe’s Crisis." New York Times 14 2010.
31. Tardos, Agnes. "The story told by debt indicators and the hidden truth." IFC Bulletins chapters 36 (2013): 351-365.
32. The Economist. “An overdue move: What a decision by Italy’s caretaker government says about the euro crisis.” The Economist, Apr 13 (2013).
33. The Economist. “State Capitalism in the Dock: The performance of state-owned enterprises has been shockingly bad.” The Economist, Nov 22. (2014).
34. Valencia, Fabian, and Luc Laeven. Systemic banking crises: a new database. International Monetary Fund, 2008.
35. Von Hagen, Jürgen, and Guntram B. Wolff. "What do deficits tell us about debt? Empirical evidence on creative accounting with fiscal rules in the EU."Journal of Banking & Finance 30, no. 12 2006): 3259-3279.
36. Whiteside, Heather. "From turbulence to entrenchment: P3 policy evolution and innovation after the global financial crisis." 2014.