PRODUCTION AND CHARACTERIZATION OF HYDROPHOBINS WITH POTENTIAL FOR ORAL MEDICINE APPLICATIONS
Thesis presented to Escola Superior de Biotecnologia of the Universidade Católica Portuguesa to achieve the Master of Science level in Applied Microbiology
by
Catarina Fardilha Fernandes
I
PRODUCTION AND CHARACTERIZATION OF HYDROPHOBINS WITH POTENTIAL FOR ORAL MEDICINE APPLICATIONS
Thesis presented to Escola Superior de Biotecnologia of the Universidade Católica Portuguesa to achieve the Master of Science level in Applied Microbiology
by
Catarina Fardilha Fernandes
III RESUMO
Hidrofobinas são proteínas produzidas apenas por fungos (Ascomycetes e Basidiomycetes) que são capazes de se auto-organizar numa membrana anfipática, na interface, alterando assim a natureza das superfícies. Embora as hidrofobinas de diferentes espécies possuam baixa homologia de sequência, apresentam padrões de hidropatia aproximados, são ricos em cisteína e podem ser distinguidos em duas classes: classe I e classe II.
O objectivo geral deste estudo inclui a produção e caracterização de hidrofobinas com potencial uso na medicina oral.
Três estirpes, isolados fúngicos L7 e C1.1 da coleção do laboratório, e Bjerkandera sp. BOS55 (L3), também da coleção de laboratório, foram testados a partir da produção de hidrofobinas. A amplificação e sequenciação da zona ITS fúngica permitiram a identificação das espécies L7 e C1.1 isoladas, respectivamente, Mucor circinelloides e Hypocrea lixii (Trichoderma harzianum).
As hidrofobinas a partir das três estirpes, foram produzidas, extraídas e ainda caracterizadas.
Para a caracterização bioquímica, foi testado o fluido extracelular de todos os isolados para a estabilidade da espuma e o teste de espalhamento de óleo e de tensão superficial. Para todos os isolados a avaliação da hidrofobicidade de conídios foi realizada por suspensão do mesmos e a molhabilidade do micélio foi testada na superfície das hifas.
O fluido extracelular do isolado Hypocrea lixii (Trichoderma harzianum) obteve melhor desempenho do que os outros, e também apresentou o micélio mais impermeável, evidenciado no ensaio de molhabilidade da superfície. O Mucor circinelloides foi aquele que exibiu os conídios mais hidrofóbicos. Observações no SEM parecem indicar que todos os isolados possuem hidrofobinas de superfície classe I. Todas as misturas de hidrofobinas obtidas apresentaram alguma atividade anti-microbiana, bem como eficácia na inibição da formação de biofilme de Candida albicans. A caracterização da mistura de hidrofobinas concentradas por HPLC evidenciou dois picos com características hidrofóbicas os quais serão caracterizados em trabalhos futuros. Assim, foi possível isolar hidrofobinas com eficácia na proteção de
IV adesão e crescimento de microrganismos, demonstrando potencial de aplicação na saúde oral.
V ABSTRACT
Hydrophobins are proteins produced only by fungi (Ascomycetes and Basidiomycetes) that are able to self-assemble into an amphipatic membrane at an interface thus changing the nature of surfaces. Although hydrophobins from different species have low sequence homology, they present approximate hydrophaty patterns, are rich in cysteine and can be distinguished in two classes, class I and class II.
The general objective of this research was the production and characterization of hydrophobins with potential use in oral medicine.
Three strains, fungal isolates L7 and C1.1 from the laboratory collection and Bjerkandera sp. BOS55 (L3) also from the laboratory collection were tested for hydrophobin production. Fungal ITS amplification and sequencing allowed the identification to species of L7 and C1.1 isolates, respectively, Mucor circinelloides and Hypocrea lixii (Trichoderma harzianum).
Hydrophobins from all three strains were produced, extracted and further characterized.
For biochemical characterization of all three isolates, the extracellular fluid of all isolates was tested for foam stability, oil spreading assay and surface tension. The assessment of conidial hydrophobicity was performed for conidial suspension and mycelium wettability was tested in surface hyphae.
Extracellular fluid of isolate Hypocrea lixii (Trichoderma harzianum) showed better performance than the others, and also presented the most impermeable mycelia, as observed by surface wettability assay. Mucor circinelloides presented the most hydrophobic conidia. SEM observations seem to indicate that all three isolates possess class I surface hydrophobins. All hydrophobin mixtures obtained presented anti-microbial, as well as efficient inhibition of biofilm formation by Candida albicans.
The characterization of concentrated hydrophobin mixtures by HPLC showed two peaks with hydrophobic characteristics, which will be characterized in future studies. So, within this work was possible to isolate hydrophobins with efficacy on the protection of biofilm formation and inhibition of microbial growth, demonstrating a potential for oral medicine applications.
VII ACKNOWLEDGEMENTS
I’m grateful to Escola Superior de Biotecnologia - Universidade Católica Portuguesa for have given to me all the conditions for the practical realization of my master's thesis.
I would like to thank all the patience and friendship of my master coordinators, Prof. Dr. Manuela Pintado and Prof. Dr. Patrícia Moreira. Thank you for all the advice and guidance for the realization of my thesis.
I thank all my colleagues in the lab by the friendship environment and mutual help. In particular I want to thank Fatima Leite, Eduardo Costa and Manuela Amorim for assistance in laboratory practice.
I dedicate this phase of my life to Jorge Aleixo and my family for all the support and love.
IX
TABLE OF CONTENTS
RESUMO………...……III ABSTRACT……….V ACKNOWLEDGEMENTS……..………..VII LIST OF FIGURES………..XI LIST OF TABLES……….……XIII LIST OF ABBREVIATIONS……….…XV 1. INTRODUCTION ... 1 1.1. Hydrophobins ... 1 1.2. Molecular Structure ... 51.3. The interfacial self-assembly ... 7
1.4. Special properties ... 10
1.4.1. Surface-activity and surface adhesion ... 10
1.4.2. Foam formation ... 10
1.4.3. Rodlet formation ... 11
1.5. Applications ... 12
1.6. Objectives ... 15
2. MATERIAL AND METHODS ... 16
2.1. Microorganisms isolation and identification ... 16
2.2. Culture media ... 16
2.3. Hydrophobins production and extraction ... 16
2.4. Total fungal DNA extraction ... 17
2.5. Hydrophobin biochemical characterization ... 18
2.5.1. Foam stability ... 18
2.5.2. Oil spreading assay ... 18
2.5.3. Test for mycelium wettability ... 18
2.5.4. Assessment of conidial hydrophobicity ... 19
2.5.5. Surface tension ... 19
2.5.6. Scanning electron microscopy (SEM) ... 20
2.6. Total protein quantification ... 21
X
2.8. Microtiter-plate test for biofilm inhibition ... 22
2.9. Hydrophobin purification ... 22
3. RESULTS AND DISSCUSSION ... 24
3.1. Hydrophobins production and extraction ... 24
3.1. Total fungal DNA extraction ... 24
3.2. Hydrophobin biochemical characterization ... 27
3.2.1. Foam stability ... 27
3.2.2. Oil spreading assay ... 28
3.2.3. Test for mycelium wettability ... 29
3.2.4. Assessment of conidial hydrophobicity ... 31
3.2.5. Surface tension ... 31
3.2.6. Scanning electron microscopy ... 32
3.3. Total protein quantification ... 34
3.4. Hydrophobin purification ... 34
3.5. Determination of antimicrobial activity... 36
3.6. Microtiter-plate test for biofilm inhibition………...………43
4. CONCLUSIONS ... 44
5. FURTHER WORK... 47
XI LIST OF FIGURES
Figure 1.1. Structure of the HFBII hydrophobin from T. reesei. ... 6
Figure 1.2. Self-assembly of hydrophobins that results in modification of the nature of a surface ... 8
Figure 1.3. Self-assembly of hydrophobins and changes in its conformation. ... 9
Figure 1.4. Atomic force microscopy (AFM) & A surface membrane of HFBI ... 12
Figure 3.1. DNA amplification with ITS4 and ITS5. ... 24
Figure 3.2. Stability of the foam obtained from the extracellular fluid ... 27
Figure 3.3. Evaluation of wettability of the surface of strain Hypocrea lixii (Trichoderma harzianum) (C1.1). ... 29
Figure 3.4. Evaluation of wettability of the surface of strain Bjerkandera sp. (L3). ... 30
Figure 3.5. Evaluation of wettability of the surface of strain Mucor circinelloides (L7). ... 30
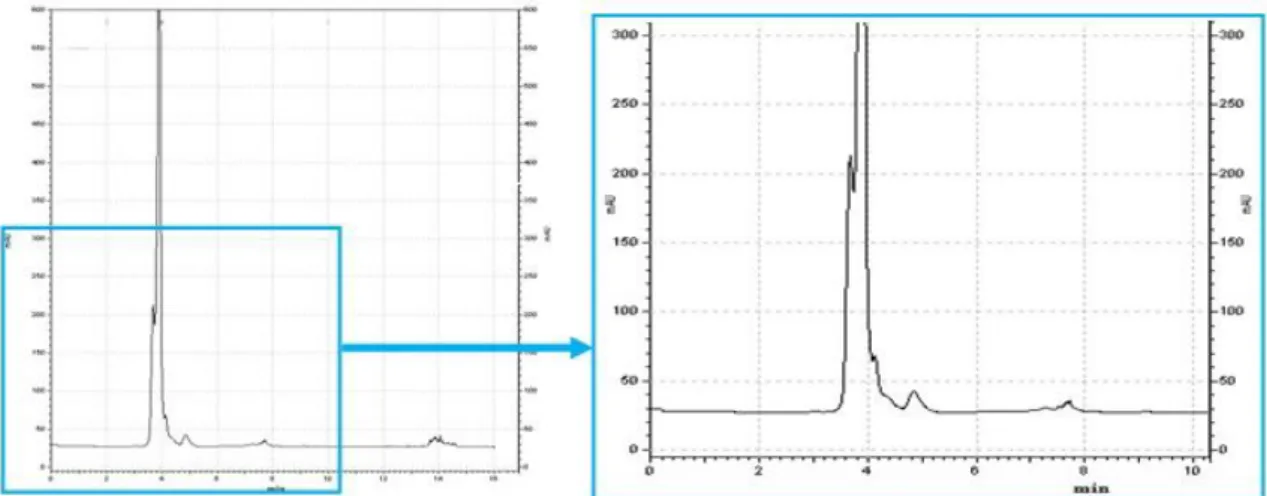
Figure 3.6. Chromatogram of the hydrophobin mixture from Bjerkandera sp. BOS55 (L3) measured at 280 nm. ... 35
Figure 3.7. Chromatogram of the hydrophobin mixture from Mucor circinelloides (L7) measured at 280 nm. ... 35
Figure 3.8. Chromatogram of the hydrophobin mixture from Hypocrea lixii (Trichoderma harzianum) (C1.1) measured at 280 nm. ... 36
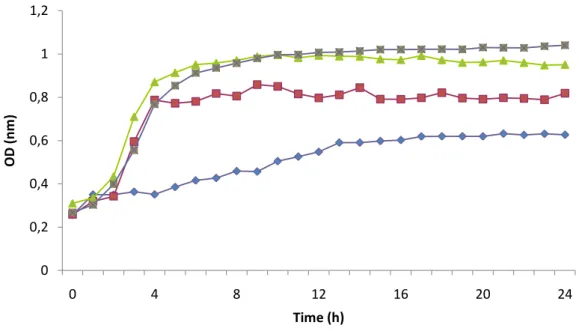
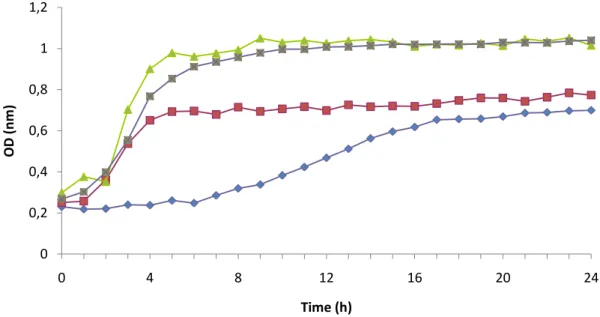
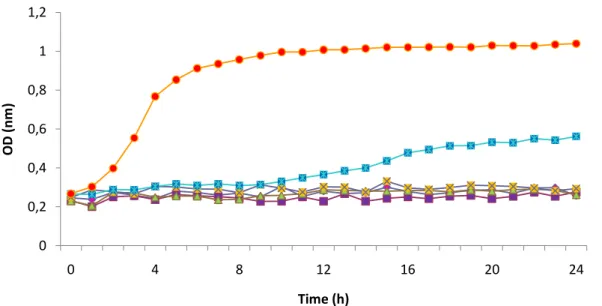
Figure 3.9. Inhibition growth curves obtained for different percentages of hydrophobin mixture from Bjerkandera sp. BOS55 (L3) (0.2 mg.ml-1) upon C. albicans ... 37
Figure 3.10. Inhibition growth curves obtained for Mucor circinelloides (L7) upon C. albicans. ... 38
Figure 3.11. Inhibition growth curves obtained for hydrophobin mixture from Hypocrea lixii (Trichoderma harzianum) (C1.1) upon C. albicans ... 38
Figure 3.12. Inhibition growth curves obtained for control sample (Quitoral elixir) upon C. albicans ... 39
Figure 3.13. Inhibition growth curves for Bjerkandera sp. BOS55 (L3) (0.2 mg.ml-1) and Quitoral elixir upon C. albicans ... 40
Figure 3.14. Inhibition growth curves obtained for hydrophobin mixture from Mucor circinelloides (L7) (0.2mg.ml-1) and Quitoral elixir upon C. albicans ... 40
Figure 3.15. Inhibition growth curves obtained for Hypocrea lixii (Trichoderma harzianum) (C1.1) (0.2mg.ml-1) and Quitoral elixir upon C. albicans ... 42
XII Figure 3.16. Inhibition of biofilm formation for Candida albicans with hydrophobin mxtures from the three isolates. ... 43
XIII LIST OF TABLES
Table 1.1. Class I hydrophobins identified in Basidiomycetes. ... 2
Table 1.2. Class I hydrophobins identified in Ascomycetes ... 3
Table 1.3. Class II hydrophobins identified in Ascomycetes ... 4
Table 1.4. Possible applications of hydrophobins in Biotechnology ... 14
Table 3.1. BlastN results for Identification of L7 fungal isolate by molecular biology (full sequence). ... 25
Table 3.2. BlastN first two results for identification of L7 fungal isolate by molecular biology (Trimmed equence). ... 25
Table 3.3. Blast N first two results for identification of C1.1 fungal isolate by molecular biology (trimmed sequence). ... 26
Table 3.4. Displacement of oil medium for each strain... 28
Table 3.5. Surface tension measurements for fungal isolates... 32
Table 3.6. Spores, mycelia and individual hyphaes surfaces characteization ... 33
XV LIST OF ABBREVIATIONS
ATM Atomic force microscopy
ATR FT-IR Attenuated total reflectance Fourier-transform infrared spectroscopy
BSA Bovine serum albumin
CD Circular dichroism spectropolarimetry
CDB Czapek-Dox broth
DNA Deoxyribonucleic acid
EDTA Ethylenediamine tetraacetic acid
FA Formic acid
MALDI-TOF Matrix-assisted laser desorption ionization – Time of flight-mass spectrometry
MIC Minimum inhibitory concentration
NMR Nuclear magnetic resonance spectroscopy
PCR Polymerase Chain Reaction
PDA Potato dextrose agar
PDB Potato dextrose broth
SDS Sodium Dodecyl sulfate
SDS-PAGE Sodium Dodecy sulfate - Polyacrylamide gel electrophoresis SEM Scanning electron microscopy
TFA Trifluoroacetic acid
1 1. INTRODUCTION
1.1. Hydrophobins
In 1991 Wessels identified, for the first time, a group of proteins, called hydrophobins, which immediately raised great interest due to their ability to change the nature of surfaces (Lutterschmid et al., 2011). In his work, when studying genes highly expressed in filamentous fungi, he found these proteins associated with those genes (Linder, 2009; Sunde et al., 2008).
Hydrophobins are a group of small proteins (10-15 kDa) produced only by fungi (Ascomycetes and Basidiomycetes). Some evidence suggests that they are also found in zygomycetes, however is not clear if they are actually occurring in the chytridiomycetes (Wösten, 2000; Wösten, 2001; Scholtmeijer et al., 2001).
Hydrophobins can be secreted out to the surroundings or into the fungal structures (Linder, 2009; Sarlin et al., 2012) and are found in the surface of fruiting bodies and aerial hyphaes (Linder, 2009). These proteins are characterized by the capacity to self-assemble at hydrophobic-hydrophilic interfaces into an amphipathic membrane (Wösten & Vocht, 2000; Scholtmeijer & Wösten, 2001; Hektor & Scholtmeijer, 2005; Vigueras et al., 2008; Litlejoh et al., 2012). Although they show low sequence homology, hydrophobins have approximate hydrophaty patterns, solubility profiles and are rich in cysteine. These proteins possess eight conserved cysteine residues with conserved spacing that form four disulfide bridges (Sarlin et al., 2012; Kirkland et al., 2011; Janssen et al., 2003). However, their amino acid sequences differ. The length of the N-terminal sequence preceding the first cysteine residue is also variable, and may contain 17 to 158 amino acids (Scholtmeijer et al., 2004).
In accordance with their characteristics of stability and hidrophaty patterns, these proteins can be distinguished in two classes, class I and class II. Both hydrophobin´s classes are both found in Ascomycetes, but class I is only found in Basidiomycetes (Linder, 2009; Wösten, 2001; Akanbi et al., 2010; Sarlin et al., 2012).
Class I integrates very insoluble hydrophobins, that are only dissolved in strong acids such as formic acid and TFA (Mosbach et al., 2011; Lunkenbein et al., 2011; Wohlleben et al., 2010; Scholmeijer et al., 2004). Proteins belonging to this class form the resulting rodlet layer that coats the surface of spores of filamentous fungi. Schizophyllum commune is a wood-rotting fungus that secrets a protein named SC3 which is the best studied hydrophobin belonging to the class I hydrophobins (Kirkland et al., 2011; Wösten, 2001, Akanbi et al., 2010; Scholtmeijer et al., 2004; Teertstra, W., 2009).
2 Class II hydrophobins layers are dissociated in some organic solvents (such as ethanol) and detergents (SDS) and could also be dissociated applying pressure or by lowering the temperature (Kirkland & Keyhani, 2011; Winterburn et al., 2011; Mosbach et al., 2011; Lunkenbein et al., 2011; Scholmeijer et al., 2004). The most studied hydrophobins in class II are HFBI and HFBII from Trichoderma reesei (Kirkland & Keyhani, 2011).
The main attribute of hydrophobins is the reduction of the surface tension of water, helping the fungi to escape from an aqueous environment and allowing spores to be hydrophobic for easier dispersion of conidiospores. So, the hydrophobicity of the individual hyphae is modified through the coating of these proteins allowing them to grow through from the wet substrate into the air. Another important function is its pathogenic role in wall structure, such as controlling evasion of immune responses in pathogenic species (Litlejohn et al., 2012).
Certain fungi have more than one hydrophobin connected to different stages of fungal development (Hakanpӓӓ et al., 2006; Wohlleben et al., 2010). Schizophillum commune, Coprinus cinerus, Aspergillus nidulans, Agaricus bisporus and Plerotus ostreatus are a few examples of these (Wohlleben et al., 2010).
In the GenBank sequence database (www.ncbi.nlm.nih.gov) around 140 hydrophobins can be found (Sarlin et al., 2012). Tables 1.1, 1.2 and 1.3 systematize the list of hydrophobins that have been identified and published till present.
Table 1.1. Class I hydrophobins identified in Basidiomycetes.
Hydrophobins Strain Gene References
Class I- From Basidiomycetes
H. jecorina
(Schizophyllum commune)
SC1 Dons et al., 1984; Ohn, et al., 2010;
SC3 Schuren & Wessels, 1990;De Vocht et al., 2000; Klimes et al., 2008; Cox & Hooley, 2009; Akanbi et al., 2010; Vejnovic et al., 2010; Wohlleben et al., 2010; Wang et al., 2010; Kirkland & Keyhani, 2011; Pedersen et al., 2011
SC4 Schuren & Wessels, 1990;Klimes et al., 2008 SC6 Mulder et al., 1988
Agaricus bisporus ABH1/HYP
A
De Groot et al., 1996; Lugones, et al., 1996; Cox & Hooley, 2009; Lunkenbein et al., 2011
ABH2/HYP C
De Groot et al., 1996; Lugones, et al., 1996
ABH3 Lugones et al., 1998; Lunkenbein et al., 2011 HypB De Groot et al., 1999; Lunkenbein et al., 2011
Pleurotus ostreatus POH1 Asgeirsdóttir et al., 1998; Wessels, 2000; Lunkenbein et al., 2011
3
POH3 Asgeirsdóttir et al., 1998; Vejnovic et al., 2010; Lunkenbein et al., 2011
VMHI Larraya et al., 1999 VMH3 Larraya et al., 1999 FBH1 Peñas et al., 1998;
Coprinus cinereus COH1 Lunkenbein et al., 2011
COH2 Asgeirsdóttir, et al., 1997; Wessels, 2000; Lunkenbein et al., 2011
Lentinula edodes Le.Hyd1 Lunkenbein et al., 2011
Le.Hyd2 Ng et al., 2000
Agrocybe aegerita Aa-Pri2 Lunkenbein et al., 2011
Pisolithus tinctorius
Hyd-Pt1 Tagu et al., 1996 Hyd-Pt2 Tagu et al., 1996 Hyd-Pt3 Wessels, 1997
Ustigalo maydis Hum1 Wessels, 1997
Hum2 Wessels, 1997 Dictyonema glabratum DGH1 Trembley et al., 2002 DGH2 Trembley et al., 2002 DGH3 Trembley et al., 2002 Flammulina velutipes FVH1 Lunkenbein et al., 2011 FvHID1 Linder et al., 2005
Pholiota nameko PNH1 Tasaki et al., 2004
PNH2 Tasaki et al., 2004 PNH3 Tasaki et al., 2004
Grifola frondosa HGFI Yu et al., 2008; Wang et al., 2010; Pedersen et al., 2011
Dictyonema glabratum
DICH1 Lunkenbein et al., 2011 DICH2 Lunkenbein et al., 2011 DICH3 Lunkenbein et al., 2011
4 Table 1.2. Class I hydrophobins identified in Ascomycetes
Hydrophobins Strain Gene References
Class I- from Ascomycetes
Magnaporthe grisea MPG1 Martin et al., 1999; Kershaw et al., 2005; Lunkenbein et al., 2011; Mosbach et al., 2011
Aspergillus nidulans
RodA Aimanianda et al., 2009; Seidl-Seiboth et al., 2011; Lunkenbein et al., 2011; Pedersen et al., 2011
DewA Seidl-Seiboth et al., 2011; Lunkenbein et al., 2011; Pedersen et al., 2011
Aspergillus fumigatus
Hyp1 Lunkenbein et al., 2011 RODB Seidl-Seiboth et al., 2011
Metarhizium
anisopliae SsgA Seidl-Seiboth et al., 2011; Lunkenbein et al., 2011
Xanthoria
estaneoides XEH1 Scherrer et al., 2000
Xanthoria parietina XPH1 Scherrer et al., 2000
Cladosporium fulvum
Hcf1 Lunkenbein et al., 2011 Hcf2 Lunkenbein et al., 2011
Hcf3 Lunkenbein et al., 2011; Mosbach et al., 2011 Hcf6 Nielsen et al., 2001; Lunkenbein et al., 2011
Neurospora crassa EAS Seidl-Seiboth et al., 2011; Kirkland & Keyhani, 2011;
Lunkenbein et al., 2011; Litlejohn et al., 2012
Cladosporium
herbarum HCH1 Weichel et al., 2003
Aspergillus orysae
ROLA Wessels, 1997
HYPB Linder et al., 2005
Paracoccidioides brasiliensis
PbHYD1 Albuquerque et al, 2004 PbHYD2 Albuquerque et al, 2004
Gibberella moniliformis
HYD1 Fuchs et al., 2004 HYD2 Fuchs et al., 2004
HYD3 Fuchs et al., 2004; Seidl-Seiboth et al., 2011
Beauveria bassiana Hyd2 Kirkland & Keyhani, 2011
Talaromyces
thermophilus TT1 Vejnovic et al., 2010
Paecilomyces
5 Table 1.3. Class II hydrophobins identified in Ascomycetes
Hydrophobins Strain Gene Reference
Class II- From Ascomycetes
Claviceps fusiformis
CFTH1_I Lunkenbein et al., 2011 CFTH1_II De Vrie et al., 1999 CFTH1_III De Vrie et al., 1999
Trichoderma harzianum
TRI1 Hakanpӓӓ et al., 2006 TRI2 Hakanpӓӓ et al., 2006 TRI3 Hakanpӓӓ et al., 2006
Qid3 Lora et al., 1994; Hakanpӓӓ et al., 2006 SrH1 Hakanpӓӓ et al., 2006
Cryphonectria
parasítica Cry Hakanpӓӓ et al., 2006
Trichoderma reesei
HFBI
Nakari-SetäLä et al., 1996; Hakanpӓӓ et al., 2006; Wang et al., 2010; Valo et al., 2011; Kirkland & Keyhani, 2011; Pedersen et al., 2011; Litlejohn et al., 2012
HFBII
Hakanpӓӓ et al., 2006; Valo et al., 2011; Vejnovic et al., 2010; Wohlleben et al., 2010; Kirkland & Keyhani, 2011; Winterburn et al., 2011; Lutterschmid et al., 2011; Litlejohn et al., 2012 HFBIII Hakanpӓӓ et al., 2006; Valo et al., 2011
Ophistoma
novo-ulmin and O.novo-ulmin CU
Bowden et al., 1994; Hakanpӓӓ et al., 2006; Lunkenbein et al., 2011
Cryphonectria
parasitica CRP Zhang et al., 1994
Magnaporthe grisea
Mag Hakanpӓӓ et al., 2006 MPH1 Lunkenbein et al., 2011 MGP Sunde et al., 2008
Verticillium dahlia VDH1 Klimes et al., 2008
Fusarium culmorum FcHyd5p Stübner et al., 2010; Lutterschmid et al., 2011; Pedersen et al., 2011;
Claviceps purpurea
CPPH1_I Hakanpӓӓ et al., 2006 CPPH1_II Hakanpӓӓ et al., 2006 CPPH1_III Hakanpӓӓ et al., 2006 CPPH1_IV Hakanpӓӓ et al., 2006 CPPH1_V Hakanpӓӓ et al., 2006
Gibberella moniliformis (Fusarium verticillioides)
HYD4 Sunde et al., 2008
HYD5 Mosbach et al., 2011
Neurospora crassa NCU08192.
6 1.2. Molecular Structure
Different techniques were used in the past to obtain a complete description of the molecular structure of hydrophobins and their assembly. Circular dichroism spectropolarimetry (CD), attenuated total reflectance Fourier-transform infrared spectroscopy (ATR FT-IR), peptide digestion and hydrogen/deuterium exchange, X-ray crystallography and nuclear magnetic resonance spectroscopy (NMR) were the principal experimental techniques (Sunde et al., 2008). Although of low resolution results, the techniques indicated above gave insights of certain aspects of the structure of hydrophobins. A better resolution of the biophysical studies has been difficult because of a peculiar physical property of these proteins: their natural ability to aggregate and self-polymerize, as well as the presence of disorder in the soluble state, is an obstacle to obtain crystals suitable for X-ray crystallography (Sunde et al., 2008).
In 2004, Hakanpӓӓ and coworkers obtained the crystalized protein of HFBII from T.reesei by careful screening of crystallization conditions. In molecular level, the first crystallographic structure of hydrophobins gave a new basis for understanding of how this type of proteins works (Linder et al., 2005; Linder, 2009).
Generally the shape of the molecule is globular (Zhang et al., 2011; Linder, 2009), the molecular weight is approximately 7 kDa (Linder, 2009; Cox & Hooley, 2009) and it has a diameter of about 3nm (Linder, 2009). It has a central β structure comprised of two β-hairpins (Sunde et al, 2008; Linder, 2009). One β-hairpin is located close to the N-terminus and the other one close to the C-terminus. These hairpins connect with each other to form one anti-parallel sheet and consequently form a barrel-like structure. In a middle of the two β-hairpins there is one α-helix (Linder, 2005). The α-helix is connected to the outside of the barrel through a disulfide bond, and another one disulfide bond operates to crosslink the two strands of each of the two β-hairpins. Those last two disulfide bonds are restricted by the barrel and are located at opposite ends, offering a high stability to the structure. The four disulfide bonds links the N-terminal loop to the core β-barrel (Sunde et al, 2008; Linder, 2009). This structure is schematically visible in Fig. 1.1 - A.
7 Figure 1.1. Structure of the HFBII hydrophobin from T. reesei. (A) Scheme of the secondary structure of HFBII. A central β sheet structure formed by two β hairpins and the two loops of the hairpins form most of hydrophobic patch are observed and they are indicated with an arrow. (B) A space-filling model of the structure in the same scale and orientation shows the hydrophobic patch in green, the rest of the surface in yellow, except for the N- and C-termini that are indicated in blue and red , respectively (Adapted from Linder et al., 2005).
In the surface of hydrophobin HFBII there is a large patch consisting of hydrophobic aliphatic residues (Sunde et al., 2008; Linder et al., 2005; Hakanpӓӓ et al., 2006; Wang et al., 2010). The hydrophobic patch is formed of side-chain residues of leucine, valine, and alanine. The surface is a plane and comprises about 20% of the total surface area of the protein (Sunde et al., 2008; Wang et al., 2010; Zhang et al, 2011). The structure looks like a surfactant with one hydrophobic and one hydrophilic part, but the size and structural details are quite different (Linder, 2009).
Crystallographic studies of hydrophobins were limited for a long time to the HFBII structure and this structure was for long the only one placed in the Protein Data Bank (Hakanpӓӓ et al. 2006). More recently, another class II hydrophobin, HFBI from T. reesei have been reported, and an NMR study of a class I hydrophobin EAS from Neurospora crassa has been described too (Hakanpӓӓ et al. 2006; Linder, 2009).
At first, EAS was determined to be largely unstructured in solution but then it was re-examined and found to share a similar fold as that of HFBII (Hakanpӓӓ et al., 2006; Linder, 2009). But, in the NMR structure of EAS, the α-helix is missing and to occupy this region it has two short β-strands (Hakanpӓӓ et al., 2006). The disulfide bridges are formed by the eight conserved cysteine residues in the same way to that of HFBII (Hakanpӓӓ et al., 2006; Linder, 2009). The zone which corresponds to the hydrophobic patch in the HFBII
8 structure is either disordered or could not be defined in the NMR structure of EAS (Hakanpӓӓ et al., 2006; Linder, 2009).
1.3.The interfacial self-assembly
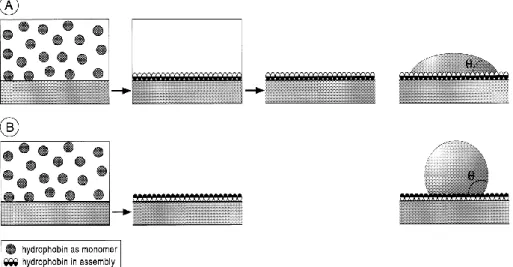
Hydrophobins self-assemble at hydrophilic-hydrophobic interfaces into amphipathic films (Wösten et al., 2000; Wösten, 2001; Scholtmeijer et al., 2001; Scholtmeijer et al., 2004; Stübner et al., 2010; Valo et al., 2011), even under in vitro conditions (Wohlleben et al., 2010). They self-assemble between water and air, water and oil, water and hydrophobic solid (Teflon) and can change the nature of surfaces (Fig. 1.2) (Wösten & Vocht, 2000; Cox & Hooley, 2009), resulting in an inversion of the surface polarity (Wohlleben et al., 2010; Valo et al., 2011).
Figure 1.2. Self-assembly of hydrophobins that results in modification of the nature of a surface. (A) A hydrophobic solid surface is coated with an approximately 10 nm thick. The coating is achieved by immersing the surface in a hydrophobin solution followed by washing; the surface becomes wettable after coating, with the resulting water contact angle ranging between 22º and 63º. (B) A hydrophilic solid surface coated with a hydrophobin film. The coating is achieved by drying down a hydrophobin solution on the surface; the surface becomes hydrophobic after coating, resulting in a water contact angle of 110º (Figure taken from Wang, X., 2004).
Some of the experiments with hydrophobins showed that they form various types of aggregates (Linder, 2005) and that their properties can be solely attributed to their amino acid sequences (Wösten, 2001; Scholtmeijer et al., 2001).
9 The best characterised class I hydrophobin, SC3 of Schizophyllum commune, and the other members of the class I hidrophobins have similar properties. Upon contact with hydrophilic-hidrophobic interfaces, SC3 monomers self-assemble into a 10 nm thick amphipathic film (Scholtmeijer et al., 2004). One side of the hydrophobin membrane is moderately to highly hydrophilic (water contact angles ranging between 22º and 63º), while the other side exposes a surface as hydrophobic as Teflon or paraffin (water contact angle 110º) (Wösten et al., 2000; Wösten, 2001).
Self-assembly of hydrophobins is accompanied by changes in its conformation (Wösten, 2001; Scholtmeijer et al., 2004). Class I and class II hydrophobins, formed only by a polypeptide chain, are rich in β-sheet structure. At the water-air interface, class I hydrophobins are in β-sheet state, achieving more β-sheet structure, while at the interface between water-hydrophobic solid is observed the α-helical state because there is an increase in the α-helix form. The α-helical state seems to be an intermediate of self-assembly, whereas the β-sheet state is the stable end-form. At the water-air interface, monomers of class I hydrophobins obtain the α-helical state, very fast, within seconds, but the conversion to the β-sheet state is much slower and has a delay of minutes to hours. At the water-solid interface, the protein obtained easily reaches the α-helical state, but is believed to be arrested in this intermediate state. The β-sheet end state can only be reached by applying a combination of heat and diluted detergent. Both forms of the assembled hydrophobin have an amphipathic nature and can be dissociated with TFA, which unfolds the protein. After removing the solvent and dissolution in water, class I hydrophobins refold to the same monomeric structure that was observed before purification or TFA treatment and the process of self-assembly can be repeated (Fig. 1.3). It is not yet known which structural changes accompany self-assembly of class II hydrophobins. However, self-assembly and disassembly of class II hydrophobins can also be repeated even after dissociation of the membrane by TFA. This shows that both classes of hydrophobins are highly resilient to this type of treatment (Wösten, 2001).
10 Figure 1.3. Self-assembly of class I hydrophobin and changes in its conformation. (A) Interface air-water. (B) Interface water -hydrophobic solid
1.4.Special properties
Hydrophobins appear to be ubiquitous in the Kingdom Fungi (Wang, X., 2004; Table 1, 2, and 3). They all have special properties that make them unique. Nature has produced several hydrophobins with small differences, but hydrophobins could also be modified by chemical cross-linking or genetic engineering as well (Wosten et al., 2000).
1.4.1. Surface-activity and surface adhesion
Hydrophobins belong to the most surface active molecules group (Linder, 2009; Wösten & Vocht, 2000; Stübner et al., 2010; Rieder et al., 2011). With a maximal lowering of the water surface tension from 72 mJ m-2 to 24 mJ m-2 at 50µg ml-1, SC3 is the most surface active protein known. Other hydrophobins are also highly surface active (Wösten & Vocht, 2000) and their surface activity is similar to that of traditional biosurfactants such as glycolipids, lipopeptides/lipoproteins, phospholipids, neutral lipids, substituted fatty acids and lipopolysaccharids used in a wide range of industrial applications such as in emulsions and dispersions. Surface activity of hydrophobins is solely caused by the amino acid sequence and
11 is thus not dependent on a lipid molecule as in a traditional surfactant (Wösten & Vocht, 2000; Scholmeijer et al., 2004).
Hydrophobins have been extensively studied, due to their surface adhesion capabilities (Szilvay, 2007; Wang et al., 2010). It was found that hydrophobins were capable to recruit enzymes to solid surfaces and thereby accelerate the degradation of a solid substrate (Wang et al., 2010). These proteins have been described as mediators for adhesion of hyphae and spores on host surfaces like an insect cuticle for example (Rocha-Pino et al., 2011) and this type of adhesive attitude may be related to features of hydrophobins as aiding fungal adhesion when pathogenic fungi colonize their hosts (Szilvay, 2007; Wang et al., 2010).
1.4.2. Foam formation
Another property that seems unique to hydrophobins is the tendency to form highly stable foams, which is connected with the high surface elasticity of hydrofobin membranes (Linder, 2009). The foam stability is due essentially to self-assembly of hydrophobins on the bubbles surface, forming a film with a high surface dilatational elasticity delaying the disproportionation, which is the diffusion of gas from small to large bubble due to a difference in Laplace pressure (Winterburn et al., 2011).
The foaming competence of hydrophobins has been known already for some time and the foaming tendency for Class I members may be weaker than class II members. Cox et al. (2008) found that the foams and bubbles of HFBII from T. reesei were stable for at least 4 months, and even up to several years in some cases, where the concentrations of protein used was relatively low (0,1 % wt.). HFBII confers a special stability to colloidal dispersions such as foams and emulsions because to properties of the protein surface (Winterburn et al., 2011).
A different concept that has raised considerable attention is the relation between gushing of beer and hydrophobins. The gushing foam consists in foaming formation very effectively and instantly, however is not exceptionally stable. Gushing is likely to be related with hydrophobins who act as nucleation sites for the formation of CO2 bubbles (Linder, 2009).
Sarlin et al. (2005) showed that there is a clear connection between the phenomenon and the presence of hydrophobins (Linder, 2009; Sarlin et al., 2012). A small amount of this protein is sufficient for gushing to occur and the gushing approached by Sarlin isn’t the same thing as the foam stability described by Cox (Linder, 2009).
Zapf et al. (2006) cloned hydrophobin genes from Fusarium culmorum, that are widespread in causing gushing problems and found that hydrophobins in gushing foam belong
12 to class II, which may indicate that gushing is also more related to class II than class I members (Linder, 2009)
1.4.3. Rodlet formation
A thin layer of rodlets coats surface conidia. The proteins existent in the cell wall of fungal aerial structures responsible for this rodlets are hydrophobins (Paris et al., 2003). This was observed on the surface of class I hydrophobin assemblages but not of their class II (Linder, 2009; Kudo et al., 2011).
The rodlets of class I hydrophobins have a characteristic appearance (Fig. 1.4). They are very similar to the fibrils that compose amyloid proteins (Wösten & Vocht, 2000; Wang, W., 2004; Linder, 2009; Wang et al., 2010).
Several aggregates of class II hydrophobins have been also described as needles or fibrils, but their size and solubility are different (Sunde et al., 2008). The formation of those classes is done differently. Class II aggregates are much larger than class I and found in the solution, the class I rodlets form when a surface membrane gets mature. The aggregates of class II may originate from the surface of the membrane which is ruptured by shear and rearranged (Linder, 2009).
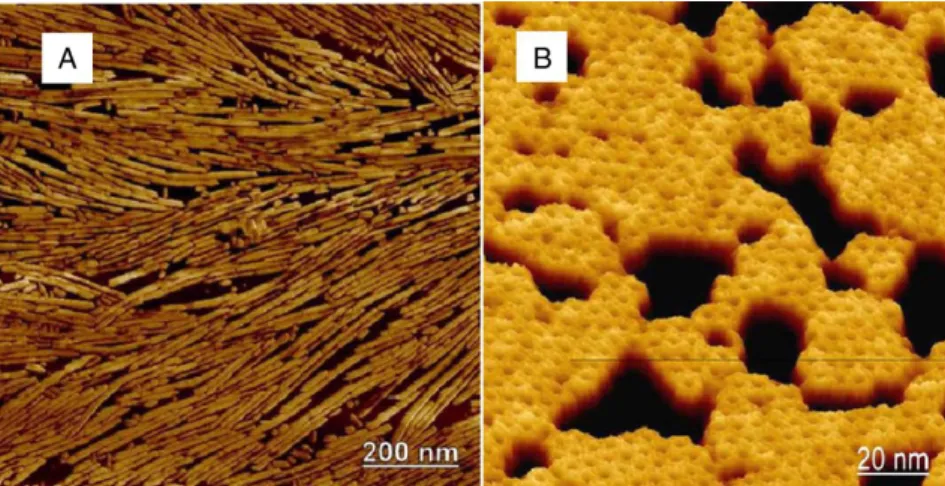
Figure 1.4. Atomic force microscopy (AFM) & A surface membrane of HFBI (A) Atomic force microscopy (AFM) image of rodlets formed by the HGFI hydrophobin from Grifola frondosa. Rodlet formation is characteristic of class I hydrophobins. The rodlets were formed at the air–water interface by multiple compressions and lifted on a solid support for imaging. (B) A surface membrane of HFBI imaged by AFM showing an organized structure. The film was formed at the air–water interface and lifted onto a mica support (Figure taken from Linder, 2009).
13 Rodlets of class I hydrophobins are made up of 4-6 protofilaments with similar diameters, have a large number of β-sheet structures, are protease resistant, self-assemble by means of intermediates, and just aggregate above a critical concentration.
The rodlets typically are formed in the air-water interface when a solution of hydrophobins is dried over a solid surface (Linder, 2009). Class I form self-assemble rodlets soluble in trifluoroaceticacid (TFA) and formic acid (FA) (Linder, 2009; Rocha-Pino et al., 2011), whereas class II are easily dissolved in ethanol or sodium dodecyl sulfate (SDS) (Rocha-Pino et al., 2011).
1.5. Applications
The several specific surface related properties of hydrophobins make them of high interest in biotechnology, having a huge potential in various practical applications (Hektor and Scholtmeijer, 2005).
Considering all their characteristics, hydrophobins have several possible applications (Schmol et al., 2010; Pedersen et al., 2011) in different areas of study such as anti-foulings (Hektor & Scholtmeijer, 2005; Hakanpӓӓ et al., 2006; Bimbo et al., 2011; Rieder at al., 2011), biomaterials and medical applications (Stübner et al., 2010; Kirkland & Keyhani, 2011; Rieder et al., 2011), personal care (Vic, G., 2003; Hakanpӓӓ et al., 2006) and emulsions (Linder et al., 2005; Winterburn et al., 2011; Pedersen et al., 2011; Kirkland & Keyhani, 2011), biosensors (Akambi et al., 2010; Pedersen et al., 2011) and electrodes (Hektor & Scholtmeijer, 2005), separation technologies (Kirkland & Keyhani, 2011) and gushing factor detection (Linder et al., 2005; Stübner et al., 2010).
As already mentioned before, hydrophobins can modify the surface binding properties, making them of interest in anti-foulings application (Bimbo et al., 2011). The window panes and cars suffer from fouling and the growth of undesirable microorganisms in ships represents a problem. Coating with hydrophobins could be the solution, thus increasing the hydrophobicity of the surfaces in contact. Coatings may also be used to immobilize growth-inhibiting compounds (Hektor & Scholtmeijer, 2005).
The antifouling capability of hydrophobins can be exploited in the field of biomaterials reducing non-specific protein binding and due to better hydrophilicity of the surface can also improve cell adhesion (medical implants biocompatibility is an important factor by using hydrophobins) (Janssen et al., 2002; Bimbo et al., 2011).
14 Hydrophobins can also be used to prevent growth in medical applications by lowering the hydrophobicity of surfaces. A problem with catheters, for example, is the occurrence of bacterial infections (Scholtmeijer et al., 2001).
Personal care has a common problem where products intended to treat hair don’t adhere or absorb well enough and are easily removed upon shampooing. Hydrophobins can prolong the residence time and may therefore be a good additive to hair care products, surviving several shampoo washes (Vic, G., 2003). Alternatively, hydrophobins can be used to stabilize emulsions (Wösten et al., 1994; Linder, 2009) in creams and ointments. It is known that the assembly of hydrophobins at the interface between hydrophobic and hydrophilic liquids can stabilize emulsions. This property might also be convenient for pharmaceutical and food industry, which both required stable emulsions for certain formulations and ingredients (Hektor & Scholtmeijer, 2005).
Hydrophobins can be used to prevent denaturation when immobilizing enzymes and to improve the quality of the biosensor and activity is also maintained for extended periods of time (Chakarova & Carlson, 2004).
Hydrophobins are also useful in electrodes without enzymes. It has been demonstrated that hydrophobins can control the access of compounds from the solution to the electrode surface, therefore increasing the specificity and sensitivity of the electrode (Bilewicz et al., 2001).
These proteins can also be exploited in separation technologies. They can be extracted from the detergent phase by the addition of ethylene oxide-propylene oxide, resulting in hydrophobin purification. A protein of interest can be fused to the hydrophobin and will be co-purified (Linder et al., 2001).
The stabilization of foam can be used in certain food applications but it can also cause problems (Talbon, N.J., 2001).
All of these mentioned applications require the production and purification of large amounts of hydrophobin, which has proved difficult so far (Askolin et al., 2001; Schmoll et al., 2010). Hydrophobins are available from natural resources only in milligram amounts (Wohleben et al., 2010). It would be necessary to increase the levels of production of hydrophobins significantly, particularly in the food industry, before the application of hydrophobins. If the production levels and price become acceptable to the food industry, the advantage of hydrophobins is that several are considered to be food-grade surfactants (Hektor & Scholtmeijer, 2005).
15 Table 1.4. Possible applications of hydrophobins in Biotechnology
Applications Examples References
Anti-fouling Prevent fouling in window panes and cars Linder et al., 2005; Hektor & Scholtemeijer 2005; Hakanpӓӓ et al., 2006;Rieder et al., 2011;
Prevent growth of unwanted organisms on ships Hektor & Scholtemeijer, 2005;
Biomaterials and medical applications
Prevent the occurrence of bacterial infections in catheters;
Scholtemeijer et al., 2001; Hakanpӓӓ et al., 2006; Linder, 2009; Stübner et al., 2010; Rieder et al., 2011; Kirkland & Keyhani, 2011;
Improvement of the biocompatibility of implants; Janssen et al., 2002; Bimbo et al., 2011
Improve bioavailability of hydrophobic drugs Bimbo et al., 2011 Emulsions Stabilize emulsions in creams and ointments for certain
formulations and ingredients in pharmaceutical and food industry applications
Scholtmeijer et al., 2001; Hektor & Scholtemeijer 2005; Kirkland & Keyhani, 2011;
Use as emulsifying agents; Scholtmeijer et al., 2001; Talbon, N.J., 2001; Kirkland & Keyhani, 2011, Linder, 2009
Biosensors Prevent the denaturation of the proteins in enzimatic immobilization
Chakarova & Carlson, 2004; Linder et al., 2005; Hakanpӓӓ et al., 2006; Kirkland & Keyhani, 2011;
Eletrodes Control the access of compounds from the solution to the electrode surface
Hektor & Scholtemeijer, 2005; Linder, 2009;
Separation technologies Efficient purification system Hektor & Scholtemeijer, 2005;
Gushing factor
detection
Stabilization of foam in food industry Hektor & Scholtemeijer 2005; Hakanpӓӓ et al., 2006;
Personal care Prolong the residence time and additive to hair care products
Vic, G., 2003; Hankanpӓӓ et al., 2006; Stübner et bal., 2010
Nanotechnology Pattern different molecules on a surface with nanometre accuracy
Scholtmeijer et al., 2001;
No hydrophobin applications were found for oral medicine in scientific literature. The search for hydrophobin patentes syielded a high number of hydrophobin application but, none-related to oral medicine were found (Appendix I, Table 1).
The use of hydrophobins in oral medicine could have many benefits once these proteins are capable of coating and changing surfaces. Furthermore, many
surface-16 active molecules are toxic due to interaction with cell membranes. But hydrophobins are non-toxic proteins because in their assembly is not expected to diffuse through the cell wall neither interacts with the plasma membrane (Wösten, 2001). They are generally considered safe for human consumption due to their natural presence in widely consumed foods such as the common button mushroom, Agaricus bisporus (Winterburn et al., 2011).
The potential application of hydrophobins in dentistry and the lack of extensive research on this topic make this study interesting and innovative.
1.6. Objectives
The general objective of this research effort are the production and characterisation of hydrophobins with potential use for hydrophobic coating in oral medicine, namely in intracanal formulations. The specific objectives of this work were:
Hydrophobin production at laboratory scale from selected fungal strains;
Hydrophobin purification through bubble production, trifluoroacetic acid treatment and diverse chromatography, electrophoreses and filtration techniques;
Scanning electron microscopy for preliminary characterization of isolated or polymerized hydrophobins;
Characterization of superficial tension changes of hydrophobin solutions;
Biochemical characterization of the hydrophobins obtained, namely, molecular weight and amino-acid sequence analysis by MALDI-TOF.
17
2. MATERIAL AND METHODS
2.1. Microorganisms isolation and identification
Previously to this work, carphosphores were collected from decaying wood of hybrid black poplar trees from Escola Superior de Biotecnologia gardens (41°10’37’’N; 8°36’23’’W), located in Porto, Portugal. The filamentous fungi growing in that substrate were selected using traditional methodologies for fungal growth on solid medium. Their differentiation was accomplished based on color and texture of the colony, growth rate and aerial hyphae. Isolates were selected for taxonomic identification and evaluation of potential production of hydrophobins and the selection criteria were based on morphology, growth, production of aerial hyphae and sample origin. All isolates obtained were kept in the laboratory collection. For this research effort two strains referred as C1.1 and L7 from the aforementioned isolation procedure were used.
The strain identified as Bjerkandera sp. BOS55 from the laboratory collection was also tested, due to lack of information on the production of hydrophobins in this genus.
Isolates C1.1, L7 and Bjerkandera sp. BOS55 were further selected as potential producers of hydrophobins and tested for their specific characteristic.
2.2.Culture media
Czapek-Dox broth (CDB, Oxoid) supplemented with 5.0 g.l-1 of yeast extract (YE, BactoTM) was used as liquid medium (CDBYE) for production of fungal mycelia as well as extra cellular fluid for hydrophobin isolation.
Potato Dextrose Agar (PDA, Difco) supplemented with 4.0 g.l-1 of agar (Agar, Liofilchem) was used as solid medium for mycelia maintenance and production for the 3 selected strains.
2.3. Hydrophobins production and extraction
The 3 selected strains were inoculated in 250 ml of CDBYE medium with 6 plugs of mycelia grown with approx.1 cm of diameter during 21 days at 30 ºC with or without agitation (80 rpm).
The extracellular fluid was separated from the mycelia by gravity filtration with Whatman Nº1 filters followed by vacuum filtration with 0.45 µm or 0.22 µm filters
18 (Millipore).
For the extraction of hydrophobins, the extracellular fluid filtrate was subjected to stirring with an ultraturrax homogeniser (Ultraturrax ® T18 basic IKA®)at maximum speed for 5 min. The foam obtained was collected, its volume was measured after liquefaction and immediately frozen at -80 ºC and further lyophilized.
For every 5 ml of sample, 20 ml of methanol, 5 ml chloroform and 15 ml of sterile water were added. Between each addition, samples were stirred and centrifuged at 9000 rpm for 30 min. The aqueous phase was removed and an extra 5 ml of methanol in proportion to the sample volume was added. After centrifugation at 9000 rpm for 20 min the supernatant was discharged. The resulting pellet was dried in a Rotational-Vacuum-Concentrator RVC 2-18 CD (CHRIST) with a chemical resistant Diaphragm Vacuum Pump (Vacuumbrand) and then, 20 µl of Trifluoroacetic acid (TFA) was added. After evaporation with a nitrogen gas flow, the sample was redissolved in 50 mM phosphate buffer pH 7.0.
2.4. Total fungal DNA extraction
Full identification of L7 and C1.1 isolates required total fungal DNA. The mycelium was collected by gravity filtration with Whatman Nº1 filters, washed with sterilised water, quickly frozen with liquid nitrogen and stored at – 80 ºC till further use. For DNA extraction, it was first grounded to powder with a sterile mortar and pestle at 4 ºC.
The total DNA extraction followed the method of Pitcher, Saunders and Owen (1989) with small modifications. The quality and purity of the DNA was evaluated spectrophotometrically at 260 and 280 nm, and by electrophoresis in TAE buffer on 1% agarose gel.
Total fungal DNA was amplified with primers ITS4 (5’- TCC TCC GCT TAT TGA TAT GC-3’) and ITS5 (5’- GGA AGT AAA AGT CGT AAC AAG G- 3’).
PCRs were performed using 1 µl of each primer (ITS4 and ITS5), 12.5 µl of NZYTaq 2x Green Master Mix (Nzytech), 2.5 µl of total fungal DNA and 8 µl of nuclease free H2O, up to a total volume of 25 µl. Amplification in a TECHNE TC512
thermocycler was performed for 35 cycles, with a 5 min of pre-denaturation step at 95 ºC, followed by cycles of 1 min denaturation at 95 ºC, 1 min annealing at 50 ºC, and 1 min extension at 72 ºC and with a final extension at 72 ºC for 5 min. DNA sequencing
19 was performed at Macrogen Inc. (Korea). Identification of strains was performed with analysis of BLASTn results obtained in the NCBI server http://www.ncbi.nlm.nih.gov/.
2.5. Hydrophobin biochemical characterization 2.5.1. Foam stability
For determination of the foam stability of unpurified hydrophobins mixtures, the method of Lutterchmid, Muranyi, Stübner, Vogel and Niessen (2011) was followed with some modifications. Mycelium was removed from the growth medium by filtration as described before. Two 150 ml aliquots of extracellular fluid were placed in sterile flasks. One of the aliquots was heat treated by incubation in boiling water for 1 h, while the other one remained untreated. After cooling down to room temperature, both treated and untreated aliquots were foamed up by mixing with an ultra turrax disperser (Ultraturrax® IKA® T18 basic) at 24000 rpm for 1 min. Foam formation and subsequent degradation was observed and the time it took to total foam fading was recorded.
2.5.2. Oil spreading assay
Surface activity of unpurified hydrophobin mixtures was measured with the oil spreading assay method (Rivardo, F. et al., 2009). Assay consisted of the formation of a thin membrane with 20 µl of Motor Oil 10 W-40 (GM- General motors) deposited onto the surface of 20 ml of distilled water in a Petri dish (90 mm in diameter). Twenty µl of extracellular fluid (as obtained from section 2.3) in 50 mM phosphate buffer (pH 7.0) were gently put onto the center of the oil membrane. Diameters of clearly formed oil displaced circles were measured to determine the presence of biosurfactant activity.
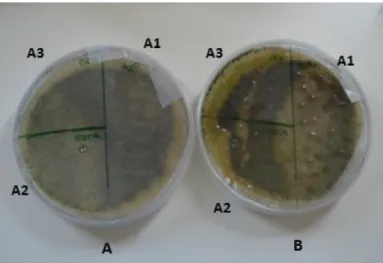
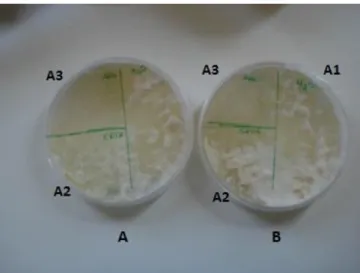
2.5.3. Test for mycelium wettability
Test for mycelium wettability was performed according to Mosbach, Leroch, Mendgen and Hahn (2011), using PDA culture medium for mycelia growth. A spore suspension was obtained adding 4 ml of 50 mM phosphate buffer (pH 7.0) to the surface of 7 days of growth PDA petri dish, stirred gently and collected - No spore counting was performed. PDA plates were inoculated with 4 ml of the spore suspension and incubated during 12 days at ambient light and room temperature, obtaining
20 sporulating mycelium.
To produce non sporulating mycelium PDA medium were incubated during 4 days in the dark. Aerial mycelia were covered with 20 µl droplets evenly distributed containing 50 mM EDTA and 2% (v/v) SDS, and incubated for up to 24h. Tests were performed in duplicate.
2.5.4. Assessment of conidial hydrophobicity
Conidial hydrophobicity of each selected isolate was assessed using the method of Shan, Wang, Ying and Feng (2010) trough suspension in 10 mM phosphate buffer (pH 7.0). Conidia were suspended in 50 mM phosphate buffer (pH 7.0) containing 0.02% (v/v) Tween 80 and a standardized the spore suspension of 2 x 10⁷ conidia.ml-1. Liquid paraffin was added to spore suspension in proportion to 40 µl in 40 ml. The solution was stirred for 2 min in a decanting funnel. When the solution was separated into two phases, three samples from the aqueous phase were pipetted to Neubauer chambers and conidia were counted in a microscope. Tests were performed in duplicate.
2.5.5. Surface tension
For surface tension measurements between hydrophobin mixture samples and air, a protein solution was prepared in 50 mM phosphate buffer (pH 7.0). The same phosphate buffer was used for calibration. One point five milliliters of hydrophobin mixtures were used for each measurement at ambient temperature on a Kruss Model K6 apparatus. The ring was placed just below the surface of the solution, and the force to move the ring from the liquid phase to the air phase was determined in duplicate (Rivardo, F. et al. 2009).
For this experiment in particular, the hydrophobin samples were extracted in three different ways. In addition to the extraction made as described in section 2.3, we tested two other ways. Production of bubbles for extraction of hydrophobins was also performed using dry ice. To each solution was added small amount of dry ice and on contact with the solution bubbling was formed and the foam collected. Bubbling was also obtained with a perforated tube dipped into the solution under a nitrogen gas flow that allowed the production of foam.
21 2.5.6. Scanning electron microscopy (SEM)
Spores, hyphae and individual hyphae from Bjerkandera sp. BOS55, L7 and C1.1 isolates, were observed with scanning electron microscope (SEM) in order to evaluate hydrophobin production potential. The procedure was adapted from Castillo (2005) and Patricia Reis (2011, personal communication).
A spore suspension from each isolate was prepared by covering the Petri dishes with 4-5 ml of sterile water and 1 drop of 20 µl of Triton-X. The plates were stirred to enable the release of spores and the spore suspension was carefully aspirated with a sterile Pasteur pipette. The suspension was placed on an open eppendorf and water evaporated in a heating plate at 60 ºC inside the fume hood.
Individual hyphae were prepared by placing a 0.45 µm filter (Millipore), with numerous small pores obtained using a sterile needle, on the surface of a petri dish with PDA medium. Each sample was inoculated with mycelia with an inoculating loop and a new similar filter, also perforated, was placed on top of the inoculum. After fungal growth for 7 days at 30 °C, individual hyphae were removed with the help of an inoculating loop and placed in sterile eppendorfs with 1 ml sterile water.
Aggregates of hyphae were prepared from mycelial grown in Potato dextrose broth (PDB, Difco) liquid medium. The mycelium was filtered through a Whatman filter Nº1, washed with sterile water and small samples (20 mm2) were cut with a sterile scalpel.
For each isolate, three samples were obtained and placed in eppendorfs. One sample was suspended in 2% (v/v) SDS for 10 min, a second sample was placed in 2% (v/v) SDS for 10 min followed by 2 h in cold formic acid with constant stirring. The third sample was used as control. All samples were then washed with sterile water, neutralized with 45% NaOH on ice and suspended in cold TFA for 30 min. The TFA was finally removed with a nitrogen gas flow.
Samples were placed into a 2.5% glutaraldehyde solution in 0.1 M sodium cacodylate (pH 7.2) and left overnight at 20 °C. One drop of Triton-X was added to each sample and the sections were washed three times with 0.1 M cacodylate buffer pH 7.2 during 10 min. Dehydration was performed with an ethanol series of 10, 30, 50, 70, 80, 90, and 100%, with 15 min steps. Between fixation and dehydration steps, the samples were centrifuged for 10 to 15 min at 15000 rpm at room temperature.
22 tape and coated with gold/palladium using a Sputter Coater (Polaron, Bad Schwalbach, Germany) and images were recorded by Scanning Electron Microscopy (SEM) using a JEOL-5600 Lv microscope (Tokyo, Japan). SEM was operated at the high vacuum mode, using a spot size of 36-37 and a potential of 20-22 kV. All analyses were performed at room temperature (20 ˚C).
2.6. Total protein quantification
Standard unpurified mixtures of hydrophobins for use in steps described in sections 2.7, 2.8 and 2.9 were obtained through the concentration of the extracted samples obtained as detailed in section 2.2 with ultrafiltration against 50 mM phosphate buffer pH 7.0 using an Amicon Ultra centrifugal filter device (Millipore) 3kDa and 30kDa cut-off and subsequently diluted to 0.2 mg.ml-1 in the same buffer.
Determination of total protein concentration was carried out with BCA® Protein Assay Kit (Pierce) adapted for hydrophobic proteins according to the manufacturer’s instructions.
2.7. Determination of antimicrobial activity
Determination of minimum inhibitory concentration (MIC) was performed according to Clinical and Laboratory Standards Institute guidelines (2007). Briefly, an inoculum of 0.5 MacFarland (1.5 x 10⁸ CFU.ml-1) of Candida albicans was prepared from overnight cultures in Yeast Malt Broth and inoculated in Yeast Malt Broth (Oxoid, Hampshire, England) with hydrophobin concentrations ranging from 0.025 mg.ml-1 to 0.2 mg.ml-1 previously prepared in 10 mM phosphate buffer (pH 7.0). Two controls were simultaneously performed: one with 0.2 mg.ml-1 hydrophobin but without inoculum, and another where the hydrophobin mixture was replaced by sterile water and inoculated. An oral elixir formulation that has been shown to possess good results in reducing antibacterial activity was selected for standard comparison of MIC. This formulation includes 60% water and 40% chitosan mixture. The chitosan mixture was formed with 1% low molecular weight chitosan and 1% high molecular weight chitosan (Costa el al., 2012).
Samples were incubated 24 h at 37 ºC in a microplate reader (FlUOstar, OPTIMA, BGM Labtech) with optical density being recorded at 660 nm. The MIC was determined by observing the lowest concentration of hydrophobin which would inhibit
23 C. albicans growth. All assays were performed in duplicated (Costa, et al., 2012).
2.8. Microtiter-plate test for biofilm inhibition
Quantification of biofilm production in batch and fed-batch was carried out by adapting the protocol of Stepanovic et al. (2000). In a flat bottom 96 microplate wells were filled with 200 µl of test solutions with hydrophobin added at 0.1 mg.ml-1 of half the maximum concentration value tested in the MIC assays. Biofilms from C. albicans were formed by incubation of the plate at 37 ºC for 48 h. All assays were performed in triplicate in Yeast Malt Broth (YMB,Difco) with 5% sucrose.
To visualize biofilms, the contents of each well were discarded and then washed 3 times with sterile deionized water in order to remove non-adherent cells. The remaining attached C. albicans were fixed with 200 µl of ethanol for 15 min. Ethanol was discarded and the wells were air dried. After that, 200 µl of crystal violet solution was added to the wells for 5 min and the excess stain removed by rising the plate under tap water followed by air drying. Adherence was quantified by measuring the OD at 630 nm using a microplate reader (FLUOstar, OPTIMA, BGM Labtech).
Optical density values from wells with only YMB (Difco) were used as negative controls. A positive control with sterile deionised water for each bacterium was also used.
Results for this test were given as percentage of biofilm formation inhibition applying the following formula (Costa, et al., 2012):
% biofilm formation inhibition = 100 – (OD assay / OD control) x 100
2.9. Hydrophobin purification
Purification of hydrophobin proteins was carried out by analytic HPLC with a reversed phase column Vydac 214-TP C4 column (240 mm x 4.6 mm, 5 µm) (Grace Vydac). The injection volume was 30µl and a linear gradient with 80% B and 20% A (flow rate: 1 ml.min-1; A: H2O with 0.1% (v/v) TFA; B: acetonitrile with 0.1% (v/v)
TFA) was carried out for 20 min. The HPLC system consists of a Beckman Coulter System Gold 508 Autosample, a Beckman Coulter System Gold 126 Solvent Module
24 and a Beckman Coulter System Gold 168 Detector. Data were collected and analyzed using the Beckman Coulter, INK 32 Karat Software.
Elution of protein was monitored at 260 and 280 nm. Collection of protein was performed when the protein was detected to be eluted from the system.
25 3. RESULTS AND DISSCUSSION
3.1. Hydrophobins production and extraction
Following the incubation period determined, enough mycelium was produced and thus hydrophobins were potentially secreted into extracellular medium. Very small volumes (approx. 20 ml in total) of mixtures of hydrophobins were obtained after extraction and collection of the target poteins. However, it has been already previously described the difficulty of producing and extraction large quantities of hydrophobins (Askolin et al., 2001; Scholtmeijer et al., 2002; Hektor & Scholtmeijer).
3.1. Total fungal DNA extraction
Strains were characterized macro and microscopically and were tentatively assigned to genera of fungi. One of the strains was already identified as Bjerkandera sp. BOS55 and for a reliable identification of the other strains, molecular techniques were used. Strains L7 and C1.1 were subjected to DNA amplification for identification of the ITS region (Fig. 3.1).
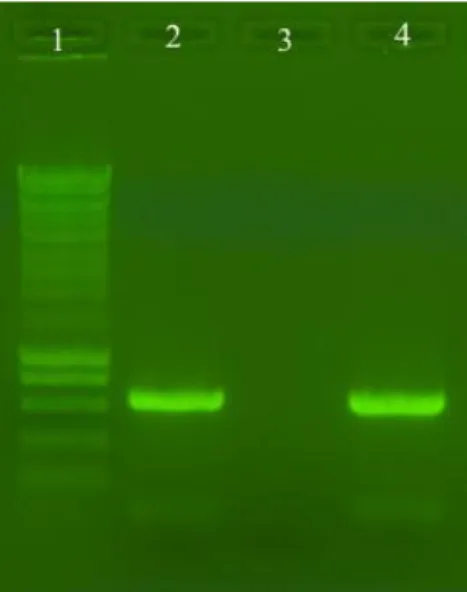
Figure 3.1. DNA amplification with ITS4 and ITS5. 1: Molecular Weight marker (Smartladder, Eurogentec); 2: L7 strain; 4: C1.1 strain
For both strains L7 and C1.1, a very clear, high intensity band at aprox. 650 bp with absence of contamination was obtained.
26 The samples were purified and sequenced by Macrogen Inc, Korea. Two fungal strains were identified (Table 3.1). The quality of the sequence is good as evaluated in the chromatogram provided by the company (Appendix II, Fig. 1 and 2). The results also presented very low Expected values (E) and the percentage of identities was 99%, giving confidence in the results obtained by the nucleotide blast performed. However L7 was only identified to the genus and C1.1 was not assigned any identification at all.
Table 3.1. BLASTn results for identification of L7 fungal isolate by molecular biology (full sequence).
Strain Identification Quality of sequence E value Identities Match Total PCT (%) L7 Mucor sp. Good 0.0 608 614 99 C1.1 Without identification Good 0.0 599 605 99
Strain L7, as we already suspected due to its morphologic characteristics was identified as a Mucor sp. and the results were as expected, since this fungus has been associated with trees and our strain was isolated from a tree from Escola Superior de Biotecnologia gardens.
After analyzing the chromatogram we decided to remove 48 nucleotides from the beginning of the sequence and from nucleotide 630 inclusive to the end (630-655 nucleotides). We also eliminated a G nucleotide due to error and/or external contamination.
The new blast performed with a smaller but better quality sequence enable the species determination (Table 3.2).
Table 3.2. BLASTn first two results for identification of L7 fungal isolate by molecular biology (trimmed sequence).
Strain Identification Quality of sequence E value Identities Match Total PCT (%) L7 Mucor circinelloides Good 0.0 569 569 100 L7 Mucor circinelloides Good 0.0 570 571 99
27 The results indicate that L7 is an isolate of Mucor circinelloides first identified in CBS and Centre National de Référence Mycologie et Antifongiques (CNRMA) (Schwarz et al., 2005).
Otherwise strain C1.1 was isolated and sequenced previously in other research works but has not been fully characterized yet.
By analysis of the chromatogram, we decided to re-take the blast of the obtained sequence but without the extremities, that presented much background noise. Nucleotides were removed from the beginning of the sequence up to nucleotide 26 (inclusive) and from nucleotide 606 to the end of the sequence (606-632 nucleotides). The BLASTn performed with the trimmed sequence allowed species level identification for C1.1 isolate (Table 3.3).
Table 3.3. BLASTn first two results for identification of C1.1 fungal isolate by molecular biology (trimmed sequence).
Strain Identification Quality of sequence
E value Identities
Match Total PCT(%)
C1.1 Hypocrea lixii Good 0.0 578 579 99
C1.1 Trichoderma
harzianum
Good 0.0 579 580 99
The results indicate that C1.1 is an isolate of Hypocrea lixii for the first time isolated and identified in Facultad de Agronomía, Universidad Nacional de Colombia (Hoyos-Carvajal et al. 2009) or Trichoderma harzianum that was identified for the first time in Systematic Botany and Mycology Lab, USA (Chaverri et al. unpublished work). Both are the same fungal species, however T. harzianum is asexual (or anamorphic) and the sexual stage (or teleomorph) has been described as Hypocrea lixii (Druzhinina I.S. et al., 2010).
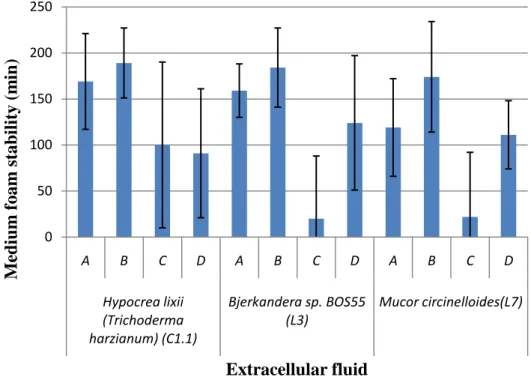
3.2. Hydrophobin biochemical characterization 3.2.1. Foam stability
In order to characterize biochemically the hydrophobin mixtures obtained, the stability of the foam was tested in triplicate with the extracellular fluid of each fungal strain grown for 7 days with different treatments. The influence of agitation and heat