ii ABSTRACT
Following the trend of private label (PL) growth across Europe, many retailers already introduced different tiers such as premium private labels (PPLs) that offer shoppers quality equal or even higher to National Brands (NBs). For managers, it is important to understand consumer-specific factors that influence the purchase intention of PPLs.
After conducting an online experimental survey (four different stimuli), this research’s findings indicate that quality perceptions between NBs and PPLs have become blurred. This research additionally contributes to existing literature by accounting for hedonic and utilitarian dimensions of PPLs by comparing two different product types with no significant differences in the perception of these products found.
Furthermore, the influence of different variables on purchase intention such as involvement, previous experience, and perceived quality has been studied.
For involvement, the results showed that the level of involvement negatively influenced the quality perception and the purchase intention for PPLs. Perceived quality was the most important factor influencing purchase intention Additionally, the results showed that positive previous experience with PLs positively influenced the perceived quality and positive cross-branding learning effects exist between regular PLs and PPLs. Furthermore, the research found a positive correlation between previous experience and satisfaction with PLs.
To this end, this research recommends managers to expand their PL portfolio to categories with low involvement, with good and popular pre-existing regular PLs and to continue to invest in measures that enhance the quality perception of PLs as well as PPLs.
SUMÁRIO
Acompanhando o crescimento da tendência das marcas brancas (MBs), muitos retalhistas têm introduzido as marcas brancas de qualidade superior (PMB). Estas oferecem uma qualidade igual ou mesmo superior à das marcas nacionais (MN). Para os gestores, é importante compreender os fatores específicos dos consumidores que influenciam a intenção de compra das PMBs.
Após a realização de uma pesquisa experimental online (quatro estímulos diferentes), os resultados desta pesquisa indicam que as perceções de qualidade entre as MNs e as PMB tornaram-se indefinidas. Adicionalmente, esta pesquisa contribui para a literatura existente ao contabilizar as dimensões hedónicas e utilitárias das PMBs, comparando dois tipos de produtos diferentes sem diferenças significativas na perceção destes produtos encontrados.
Foi estudada a influência de diferentes variáveis na intenção de compra, como o envolvimento, a experiência anterior e a qualidade percecionada.
Relativamente ao envolvimento, os resultados mostraram que o nível de envolvimento influenciou negativamente a perceção de qualidade e a intenção de compra dos PMBs. Os resultados mostraram que a experiência anterior positiva com MBs influenciou positivamente a qualidade percepcionada e que existem efeitos positivos de aprendizagem cruzada entre MBs regulares e PMBs. Adicionalmente, a pesquisa encontrou uma correlação positiva entre a experiência anterior e a satisfação com as MBs.
Para tal, esta pesquisa recomenda aos gestores que expandam a sua carteira de MBs para categorias com baixo envolvimento, com boas e populares MBs regulares e pré-existentes e que continuem a investir em medidas que melhorem a perceção de qualidade das MBs e das PMBs.
iv ACKNOWLEDGEMENTS
I would like to express my gratitude to my supervisor Professor Paulo Romeiro for his guidance and his feedback which was always very helpful.
Also, I would like to thank all the respondents of my survey for investing their time and effort to collect data for this thesis. Furthermore, I want to thank my fellow seminar students for their support in the last couple of weeks.
I also want to thank my friends for their help and support. I want to thank my good old friends supporting me to come to Portugal and for always having my back. I also want to thank the new friends that I met in Lisbon for the great time that I will never forget. A special thanks to Kevin, who also shared stressful times with me and supported me in endless ways.
Last but not least I want to thank my parents for giving me the opportunity to get an outstanding education. Thank you for your patience, for teaching and listening to me, thank you for your endless support and for your love and understanding. I can always count on you and I am more than grateful to have you.
TABLE OF CONTENTS
ABSTRACT ... II
SUMÁRIO ... III
ACKNOWLEDGEMENTS ... IV
TABLE OF CONTENTS ... V
TABLE OF FIGURES ... VIII
TABLE OF TABLES ... IX
GLOSSARY ... X
CHAPTER 1: INTRODUCTION ... 1
1.1BACKGROUND AND PROBLEM STATEMENT ... 1
1.2PURPOSE STATEMENT AND RESEARCH QUESTIONS ... 3
1.3RELEVANCE ... 4
1.4RESEARCH METHODS ... 4
1.5DISSERTATION OUTLINE ... 4
CHAPTER 2: LITERATURE REVIEW AND CONCEPTUAL FRAMEWORK ... 6
2.1PURCHASE INTENTION ... 6
2.2STANDARD PL,PREMIUM PL AND NATIONAL BRANDS ... 6
2.2.1 Differences in Price ... 7
2.2.2 Differences in Quality ... 7
2.2.3 Brand Competition ... 7
2.3CATEGORY-SPECIFIC FACTORS ... 8
2.3.1 Hedonic vs. Utilitarian Value ... 8
2.4CONSUMER-SPECIFIC FACTORS ... 9
2.4.1 Perceived Quality ... 10
2.4.2 Involvement ... 10
2.4.3 Involvement and Previous Experience ... 11
2.5PREVIOUS EXPERIENCE WITH PL ... 12
2.6CONCEPTUAL MODEL ... 14
CHAPTER 3: METHODOLOGY ... 15
vi
3.3PRIMARY DATA ... 16
3.3.1 Survey Research Design ... 16
3.3.2 Choice of Retailer and Products ... 16
3.3.3 Data Collection ... 18
3.3.4 Measurements ... 19
3.3.5 Data Analysis ... 21
CHAPTER 4: RESULTS AND DISCUSSION ... 22
4.1SAMPLE CHARACTERIZATION ... 22
4.2MEASURE RELIABILITY ... 24
4.3MANIPULATION CHECK ... 25
4.3.1 Hedonic/Utilitarian Measure – Measure reliability ... 25
4.4HYPOTHESIS 1A –PERCEPTION OF PPLS AND NBS ... 26
4.5THE ROLE OF INVOLVEMENT ... 27
4.5.1 Personal Involvement Inventory – Measure reliability ... 27
4.5.2 Involvement and Purchase Intention (Hypothesis 3a) ... 28
4.5.3 Involvement Levels and PPL Purchase Intentions (Hypothesis 3b & 3c) ... 28
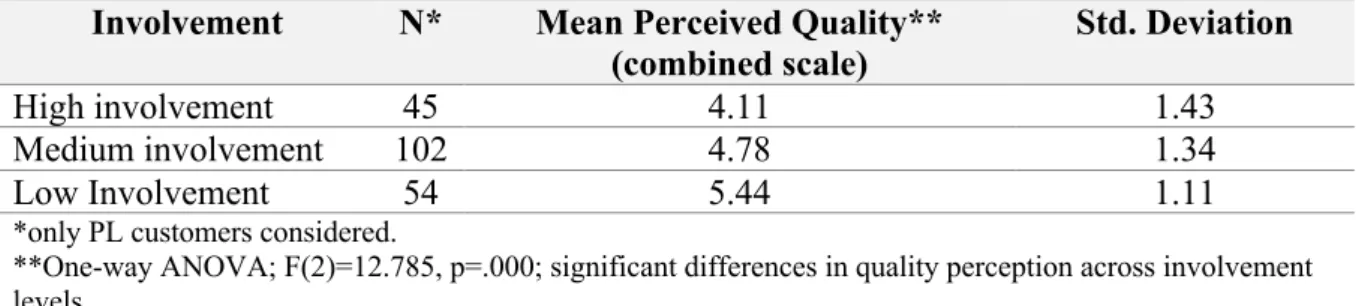
4.5.4 Involvement and Perceived Quality (all products) - Hypothesis 3d ... 30
4.5.5 Involvement and Perceived Quality PPLs – Additional Analysis ... 30
4.6PERCEIVED QUALITY ... 31
4.6.1 Perceived Quality by Product Type (Hypothesis 1b) ... 31
4.7PREVIOUS EXPERIENCE ... 33
4.7.1 Influence of PL Experience on PPL Purchase Intention ... 33
4.7.2 Additional Analysis: PL Satisfaction Differences ... 34
4.7.3 Additional Analysis: Customer Groups for PL Experience & Satisfaction (H4a continued) ... 34
4.7.4 Previous Experience & Quality Perception PPLs ... 35
4.7.5 Involvement and previous experience (H3c) ... 36
4.8MEDIATION ANALYSIS PROCESSMODEL 6 ... 37
4.9REGRESSION MODELS ... 38
4.10OVERVIEW HYPOTHESES TESTING ... 40
4.11DISCUSSION ... 40
CHAPTER 5: CONCLUSIONS AND LIMITATIONS ... 42
5.2MANAGERIAL /ACADEMIC IMPLICATIONS ... 43
5.3LIMITATIONS AND FURTHER RESEARCH ... 44 REFERENCE LIST ... I
APPENDICES ... VII APPENDIX 1:MEASUREMENTS –CONSTRUCT &RELIABILITY ANALYSES ... VII APPENDIX 2:DETAILS SAMPLE CHARACTERIZATION ... VIII APPENDIX 3:FACTOR ANALYSIS HED/UTSCALE ... IX APPENDIX 4:SPSSOUTPUTS HYPOTHESIS 1A ... XI APPENDIX 5:FACTOR ANALYSIS INVOLVEMENT ... XII APPENDIX 6:ADDITIONAL ANALYSIS –ANOVAPII OF DIFFERENT STIMULI ... XIII
APPENDIX 7:INVOLVEMENT AND PURCHASE INTENTION –CORRELATION AND REGRESSION
... XIV APPENDIX 8:INVOLVEMENT LEVELS AND PPLPURCHASE INTENTIONS (HYPOTHESIS 3B&3C) ... XVI APPENDIX 9:INVOLVEMENT LEVELS AND PERCEIVED QUALITY (HYPOTHESIS 3D) ... XVIII
APPENDIX 10:PERCEIVED QUALITY ACROSS PRODUCT STIMULI (HYPOTHESIS 1B) ... XIX
APPENDIX 11:PERCEIVED QUALITY AND PURCHASE INTENTION (HYPOTHESIS 2)
-REGRESSION ... XX
APPENDIX 12:ADDITIONAL ANALYSIS:PREVIOUS EXPERIENCE AND PLSATISFACTION
DIFFERENCES ... XXII
APPENDIX 13:ADDITIONAL ANALYSIS CUSTOMER GROUPS PLEXPERIENCE &SATISFACTION
... XXIII APPENDIX 14:PREVIOUS EXPERIENCE &QUALITY PERCEPTION PPL ... XXIII APPENDIX 15:PREVIOUS EXPERIENCE (PL_CUSTOMER TYPES) AND QUALITY PERCEPTION
PPLS ... XXIV APPENDIX 16:PROCESS MODEL 6–MEDIATION ANALYSIS ... XXV
APPENDIX 17:REGRESSION ANALYSIS (PPL) ... XXVII APPENDIX 18:REGRESSION ANALYSIS ... XXVIII APPENDIX 19:QUALTRICS SURVEY ... XXIX
viii TABLE OF FIGURES
Figure 1 Conceptual Model ... 14 Figure 2 Mediation Model all variables for Purchase Intention PPLs ... 38 Figure 3 Regression Model (PPLs) ... 39
TABLE OF TABLES
Table 1 Stimuli/Products ... 18
Table 2 Construct Measurement Overview ... 21
Table 3 Sample Characteristics ... 23
Table 4 Construct reliability analysis (Cronbach's Alpha) ... 24
Table 5 Comparison of Means for Hedonic and Utilitarian Values across product and branding types. ... 26
Table 6 Involvement across stimuli – Descriptive Statistics ... 27
Table 7 Descriptive Statistics for Involvement Levels ... 29
Table 8 ANOVA Purchase Intent across Involvement levels ... 29
Table 9 One-way ANOVA - Involvement Level and Perceived Quality. ... 30
Table 10 Perceived Quality across Product Types ... 31
Table 11 Descriptive Statistics Experience Values General and LIDL specific ... 33
Table 12 Customer Groups for PL Experience & Satisfaction ... 35
x GLOSSARY DV Dependent Variable H Hypothesis HED Hedonic IV Independent Variable NB National Brand PI Purchase Intention
PII Personal Involvement Inventory
PL Private Label
PPL Premium Private Label
RQ Research Question
SB Store Brand
SD Standard Deviation
UT Utilitarian
VIF Variance Inflating Factor
CHAPTER 1: INTRODUCTION
1.1 Background and Problem Statement
Private labels (PLs) continue to grow across Europe and many larger retailers have developed an own private label (PL) in almost every product category (Geyskens, Gielens, & Gijsbrechts, 2010). According to the latest analysis of PL performance by the company IRI, PLs are even outperforming national brands (NBs) in the majority of markets in terms of unit share (IRI, 2018). Euromonitor’s Global Consumer Trends Survey of 2013, for example, states that 89% of the shoppers buy PL products and only a small percentage of 11% claim never to do so (Euromonitor International, 2013). According to Nielsen information across more than 60 countries, PL products will continue to gain share across all major geographies (Nielsen, 2018). Other companies do not predict any downturn to the increase of PL as well (see Euromonitor International, 2013; IRI, 2018).
Reasons for the popularity of PLs among consumers is the price advantage compared to NBs (e.g. Pauwels & Srinivasan, 2004) and the increase in quality (IRI, 2018) which has been highlighted by many academic scholars as the most important success factor of PLs (Bao, Bao, & Sheng, 2011; Kumar & Steenkamp, 2007; Steenkamp, Van Heerde, & Geyskens, 2010). In the last decade, PLs have changed and transitioned to brands with similar rights and strategic implications for the retailer (Ailawadi & Keller, 2004; Keller, Dekimpe, & Geyskens, 2016; Kumar & Steenkamp, 2007). This also means that different PL tiers emerged that can be distinguished based on the level of quality: economy or best value PLs, standard PLs and premium PLs with the highest quality (Kumar & Steenkamp, 2007; Steenkamp et al., 2010; Ter Braak, Geyskens, & Dekimpe, 2014).
Because more retailers consider to move from a single-standard PL line to a more elaborated PL portfolio, research in this field has never been more important (Ailawadi & Keller, 2004; Geyskens et al., 2010; Kumar & Steenkamp, 2007; Pauwels & Srinivasan, 2004; Ter Braak et al., 2014).
Retailers started to introduce premium private labels (PPL) that offered shoppers quality that equaled or surpassed that offered by NBs about 15 years ago (Kumar & Steenkamp, 2007). PPLs are priced similar to or sometimes even higher than NBs (Ailawadi & Keller, 2004; Dawes & Nenycz-Thiel, 2013; Kumar & Steenkamp, 2007) because consumers still desire occasional indulgences and are willing to pay a little extra for premium quality. PPLs usually have a unique packaging (ter Braak, Dekimpe, & Geyskens, 2013; Ter Braak et al., 2014) and can sometimes
2 2016). Some authors even argue that PPLs might be more comparable to NBs than regular PLs (Nenycz-Thiel & Romaniuk, 2016) as they are often placed next to a NB and the product is superior to a regular PL, a common feature that is said to be a differentiation factor of NB (Nenycz-Thiel & Romaniuk, 2016).
Nowadays, the company's knowledge and understanding of the consumer is a key element in the development of successful strategies. Thus, it is especially important for retail managers to understand the consumer specific factors that influence purchase intentions. There has been extensive research on private labels in general (e.g. Dawes & Nenycz-Thiel, 2013; Ipek, Aşkin, & Ilter, 2016; Pauwels & Srinivasan, 2004; Steenkamp et al., 2010), but the substantial differences of PPLs and regular PLs imply to research the two kinds separately.
The main purpose of this research is therefore to address consumer-specific factors that influence the purchase intention of premium private labels.
One effect that has been researched as having an influence on consumer decision processes is involvement (e.g. Cowley & Mitchell, 2003; Laurent & Kapferer, 1985). Research on the role of involvement indicated that in conditions of high involvement, consumers are willing to pay a price premium for NB over PL (Steenkamp et al., 2010). As Lichtenstein, Bloch, and Black (1988, p.246) argue, “people who are highly involved in a product associate important functional, social, and psychological outcomes with the product. Therefore, highly involved consumers care more about product quality”.
The fact that PPLs are positioned at the top end of the market, and deliver quality similar to or higher than premium-quality NBs (Geyskens et al., 2010) suggests to research this phenomenon for PPLs once again. Since quality becomes less of a differentiator for NB compared to PPLs and the product aspects of PPLs (packaging, price, labeling etc.) indicate high quality (e.g. through labeling such as “Finest”, “Deluxe”, superior packaging, etc.), high involved consumers could value these facets of PPLs and to some extent even prefer PPLs over NBs, thus, the influence of involvement on purchase intention for PPL will be examined within the scope of this research.
Past research on PPLs revealed that the quality perceptions have become blurred between NBs and PPLs (Nenycz-Thiel & Romaniuk, 2016) and that the PPLs’ quality perception depends on the level of PL market maturity. Steenkamp et al. (2010) for example found out that the more mature PLs are, the fewer consumers are willing to pay a price premium for NBs over PLs. Because consumers transfer experiences with PL from one category to another, cross-category
learning effects are an important consideration for PLs (Szymanowski & Gijsbrechts, 2012). In particular, it is possible to argue that positive experiences with private labels might have a positive spillover effect for PPL.
Emotional involvement in the consumption of even simple products has been part of research on the concept of hedonism and utilitarianism (Hirschman & Holbrook, 1982) for many years already. Hedonic and utilitarian consumption can vary in typical purchase situations (Okada, 2005) and product categories can be distinguished based on their hedonic and utilitarian value. Brands within a product category, however, can vary on their hedonic and utilitarian dimension (R. Dhar & Wertenbroch, 2000; Okada, 2005; Voss, Spangenberg, & Grohmann, 2003). Both hedonic and utilitarian goods offer benefits to the consumer: hedonic goods in the form of experiential enjoyment through multisensory facets of the products (e.g. packaging, colours or scent), the latter in practical functionality (Batra & Ahtola, 1991; Hirschman & Holbrook, 1982; Okada, 2005). Different products can be high or low in both hedonic and utilitarian attributes (Voss et al., 2003). Previous research found that brands which are highly valued on the hedonic dimension are better able to charge a higher price and can increase purchase intention of consumers (R. Dhar & Wertenbroch, 2000; Voss et al., 2003). Therefore, retailers might also be interested in understanding whether PPLs are perceived differently in utilitarian and hedonic value.
1.2 Purpose Statement and Research Questions
The purpose of this dissertation is to advance the understanding of consumer-specific factors influencing the purchase intention for premium private labels, in specific:
RQ1: What is the impact of involvement on purchase intention for PPLs?
RQ2: Are there perceived quality differences between PPLs and NBs and, if so, how do they influence purchase intention for PPLs?
RQ3: Does previous experience with regular PLs influence the perception of PPLs and even purchase intention?
4 1.3 Relevance
From an academic perspective, the research topic is of importance due to its recency. Within the topic of PLs, lots of research has been conducted within the economy or medium tier of PL (e.g. Chintagunta, Bonfrer, & Song, 2002; S. K. Dhar & Hoch, 1997) indicating that shoppers somehow “trade down” to PLs and that NBs are still perceived as a superior tier (Nielsen, 2018). Past research, however, demonstrated that consumers perceive PPL distinctive from regular PL (Nenycz-Thiel & Romaniuk, 2016) which indicates that it is not possible to make generalizations about consumption behavior patterns based on research focusing on regular PLs. Furthermore, as stated by other researchers such as Sethuraman & Gielens (2014), “few studies have estimated how the effects of store brand (PL) drivers systematically vary with product characteristics such as functional versus hedonic, durable versus nondurable" (Sethuraman & Gielens, 2014, p.149). Therefore, existing research needs to be validated or rejected for PPLs.
From a managerial perspective, this research is relevant because PPLs are a trend in the retail industry and among consumers. The ‘hybrid consumers’, who are price conscious but still willing to pay a little extra for premium quality (Euromonitor International, 2013) and the consumption behavior regarding PPLs are important for retailers to understand on a micro-level since it may influence the positioning and branding strategies of PPL as well as for brand manufacturers who need to find new points of differentiation in order to stay competitive. 1.4 Research Methods
To answer the research questions, secondary data, primarily journal articles, and primary data in form of an online survey for data collection were used. An extensive literature review enabled hypothesis testing. The survey included an online experiment with different conditions (four different product stimuli, two PPLs, and two NBs). The primary statistical analyses used to answer the RQs and understand differences were different kinds of t-tests, correlations to identify relationships and regressions to understand those relationships. European retail consumers have been this study’s population of interest.
1.5 Dissertation Outline
The following chapter presents a literature review and the development of the hypotheses guiding the study. The literature review assesses and describes relevant and impactful variables influencing the purchase intent for PPLs. The third chapter will describe the methodology with
the constructs that were the body of the questionnaire, the procedure and the statistical tests applied to the obtained data. The fourth chapter will analyze the results of the questionnaire as well as considerations for the effective meaning of the results. The final chapter concludes the dissertation and highlights the limitations and areas for further research.
6 CHAPTER 2: LITERATURE REVIEW AND CONCEPTUAL FRAMEWORK
The following chapter aims to present a framework of theories and topics related to the research questions and study purpose. In the first part, the concept of purchase intention as the dependent variable is presented, followed by a distinction between (standard) PLs, premium PLs and NBs, and a review of related variables. Previous academic research on involvement, perceived quality and familiarity mainly focused on standard private labels. Given that the positioning of PLs is to some extent different from the positioning of PPLs, the role of several factors has to be reconsidered and it is only partly possible to draw conclusions for PPLs because they are at the top end of the market and deliver quality equal to that of premium-quality NBs (Geyskens et al., 2010). Thus, this chapter will discuss previous findings on PLs, PPLs and, for some relationships, reciprocal findings. The topics were explored using previous studies and empirical results from various academic journals as well as industry reports. The chapter concludes with presenting the conceptual framework which summarizes the interdependencies between the variables.
2.1 Purchase Intention
Purchase intention is a concept widely used in marketing and management and often understood as the probability that a consumer will purchase a specific product (Morrison, 1979). According to Spears & Singh, (2004, p.56) purchase intention is “an individual’s conscious plan to make an effort to purchase a brand” while O’Brien (1971) defines purchase intention as an extended commitment to a potential action. In other words, purchase intention can be described as personal action tendency to actually buy a product.
Fishbein and Ajzen (1975) with their "Theory of Reasoned Action" argue that behavioral intentions are generated by an attitude towards behavior and subjective norms that lead to actual behavior according to the accessibility of resources and possibilities. Following this theory, purchasing intentions are often used to predict actual consumer behavior (e.g. Laroche, Kim, & Zhou, 1996; Spears & Singh, 2004)
2.2 Standard PL, Premium PL and National Brands
Originally, PLs were introduced as no-name products (Keller et al., 2016). In literature, the terms primarily and interchangeably used to describe non-advertised products directly and exclusively sold from retailers are ‘store brands’(e.g. Ailawadi & Keller, 2004; Hoch & Banerji, 1993), ‘retailer brands’ or ‘private labels’.
The specific ranges of premium products among private labels (PPL) are most common in elaborated markets such as the UK, Germany and the US, as they require the largest marketing investments (Euromonitor International, 2013) and PLS, are more common in those countries (IRI, 2018).
2.2.1 Differences in Price
Usually, standard PLs are priced between 20-50% lower than NBs (Ailawadi & Keller, 2004; Dawes & Nenycz-Thiel, 2013; Kumar & Steenkamp, 2007), while PPLs are priced higher than standard PLs and similar to NBs. The price advantage compared to NBs (Pauwels & Srinivasan, 2004) is one reason for the popularity of standard PLs and many authors (e.g. Hansen, Singh, & Chintagunta, 2006) find correlations in household's preferences for PL and their price sensitivity across categories. However, a meta-analysis of several studies by Sethuraman and Gielens (2014) stressed the belief that PLs are purchased by low-income or large households and this assumption could not be validated. Since PPL prices are more or less equal to NB, price-related purchase drivers will not be researched within the scope of this research.
2.2.2 Differences in Quality
It is generally believed that the objective quality of PLs has improved and is close to, if not equal to comparable NBs (Euromonitor International, 2013; IRI, 2018; Nielsen, 2018). PPLs are vertically and horizontally differentiated from standard PLs. Positioned at the top end of the market, they deliver higher quality than standard PL and are comparable to NBs (ter Braak et al., 2013). Additionally, PPLs sometimes offer unique features such as ingredients, flavors, or packaging that cannot be found elsewhere (horizontal differentiation) (Kumar & Steenkamp, 2007). It is important to highlight that the objective quality may differ from consumer’s
perceived quality, the latter will be assessed in detail in a subsequent chapter.
2.2.3 Brand Competition
According to Nenycz-Thiel & Romaniuk (2016), there are two direct competitors for PPLs: One is the mid/premium manufacturer, the other one is the regular PLs. Kumar and Steenkamp (2007, p.41 ) point out that the emergence of ‘premium’ [PL] is “one of the hottest trends in retailing” and Schreijen (2011) believes that the increases in PPLs will enhance competition between NBs.
8 PLs are said to be a source of customer loyalty due to the exclusiveness at the retailer (Ailawadi & Keller, 2004; do Vale, Verga Matos, & Caiado, 2016) while PPLs in specific offer stores a possibility to cater the heterogeneous preferences of consumers, especially in categories where PL offer high quality that is comparable to NBs (S. K. Dhar & Hoch, 1997). However, there are indications that consumers consider PLs to be similar across retailers (Ailawadi & Keller, 2004; Chintagunta et al., 2002). With increasing numbers of private labels on all product categories (Euromonitor International, 2013), it is important to see for which type of consumers, premium-tier private labels are a better alternative and under which circumstances they are preferred.
2.3 Category-specific Factors
For regular PLs, there has been extensive research explaining the success of this type of brand focusing on product- or category-specific factors such as for example marketing and manufacturing efforts (Steenkamp et al., 2010), product lifecycle stages, competition and store brand penetration (Hoch & Banerji, 1993).
Research by Hoch & Banerji (1993) also found significant differences in store-brand penetration across categories in the United States which leads to hypothesize that category-specific factors could be dominant in the choice for PL. The wide variance in the performance of private labels, in general, begs the question of what decides the success of private label offerings across product categories.
In the retail environment, product categories allow the classification of products and are typically created by a firm or industry organization to organize products. In research, product categories are often differentiated by their utilitarian or hedonic value.
2.3.1 Hedonic vs. Utilitarian Value
According to Batra and Athola (1991, p.159) “consumers purchase goods and services and perform consumption behavior for two basic reasons: (1) consummatory affective (hedonic) gratification, and (2) instrumental, utilitarian reasons”. While the hedonic dimension relates to pleasantness, the utilitarian dimension relates to the usefulness and instrumental value of a product (Batra & Ahtola, 1991). Both, hedonic and utilitarian goods offer benefits to the consumer, the former primarily in the form of experiential enjoyment and the latter in practical functionality (Batra & Ahtola, 1991; Hirschman & Holbrook, 1982).
Brands within a product category, however, can vary on their hedonic and utilitarian dimension (R. Dhar & Wertenbroch, 2000; Okada, 2005; Voss et al., 2003). Previous research found that brands which are highly valued on the hedonic dimension are better able to charge a higher price and can increase purchase intention of consumers (R. Dhar & Wertenbroch, 2000; Voss et al., 2003). Sethuraman and Cole (1997) researching differences among NBs and PLs earlier found that national brands are more likely to command a price premium if they were higher on “consumption pleasure” (hedonic), instead of “functional”, but according to Batra and Sinha (2000, p.188), consumers buy fewer PLs if a category’s benefits require actual trial/experience instead of searching through package label information.
There are two controversies of PPLs. On one hand, packaging and positioning of PPLs try to stimulate the hedonic consumption. Hirschman and Holbrook (1982, p.29), argue that hedonic consumption „designates those facets of consumer behavior that relate to the multisensory, fantasy and emotive aspects of one’s experience with products“ and PPLs clearly try to relate to fantasy and emotive aspects with luxurious ingredients and sophisticated packaging. On the other hand, research on regular PLs argues that consumers are less likely to buy PLs if the category has many “experience” benefits (Batra & Sinha, 2000). It is therefore only reasonable to research the purchase intention for PPLs for a rather hedonic product and a rather utilitarian product. Since recent research highlighted blurred perceptions across PLs and NBs (Nenycz-Thiel & Romaniuk, 2016), the hypotheses are as following.
Hypothesis 1a: PPLs are not perceived significantly different from NBs in terms of hedonic and utilitarian value.
Hypothesis 1b: PPLs are not perceived significantly different from NBs in terms of quality.
Additionally, the concept of hedonism and utilitarianism has been associated with emotional involvement in the consumption of even simple products for many years already (Hirschman & Holbrook, 1982).
2.4 Consumer-specific Factors
Regarding the consumer-specific factors, a one-type characterization of the consumers or household buying PPLs is not possible since many factors influence a purchase decision. However, a few concepts emerging from research on standard PL will be tested for PPLs within this study.
10 Sethuraman and Gielens (2014) revealed that one can generalize that consumers will purchase PLs if they have the perception that the quality is high, the quality variation in the category is low, they have a positive image of PLs and they think that buying PLs is not risky (Sethuraman & Gielens, 2014).
2.4.1 Perceived Quality
For PLs, quality is said to be more important than price. In fact, many academic articles highlighted the importance of perceived quality from consumers as the most important success factor (Bao et al., 2011; Kumar & Steenkamp, 2007; Steenkamp et al., 2010) or the most important driver for PL share (Ailawadi & Keller, 2004). The authors Hoch and Banerji (1993) also identified quality to be more important than price and that PLs enjoy more success in categories where quality levels are high and variability low. Batra and Sinha's findings (2000) also showed that the likelihood of a PL purchase increases when quality perceptions increase. Findings on PL loyalty also reveal that perceived quality is the one factor only explaining consumer loyalty towards PLs (do Vale et al., 2016).
Since previous research highlighted the fact that the perceived quality had an influence on the purchase of PLs (e.g. Sethuraman & Gielens, 2014), it is reasonable to assume that consumers who have a good quality perception of PL will be inclined to buy them to the detriment of a national brand if such a difference in perceived quality has decreased.
Hypothesis 2a: Perceived quality has a strong impact on purchase intention.
Hypothesis 2b: High perceived quality has a strong impact on purchase intention for PPL. Hypothesis 2c: High perceived quality has a strong impact on purchase intention for NB.
2.4.2 Involvement
One factor that has often been researched as a moderator of consumer decision processes is involvement (Celsi & Olson, 1988). Laurent and Kapferer (1985, p.43) include in the term ‘involvement’ five facets or antecedents such as the perceived importance of the product, the perceived risk of consequences from a purchase mistake, the symbolic value and the emotional appeal (hedonic value). Zaichkowsky (1985, p.342) defines product involvement as "a person's perceived relevance of the object based on inherent needs, values, and interests". In over 10 years of research on this field, (Zaichkowsky, 1985) developed a context-free measure (“Personal Involvement Inventory”) that is applicable to involvement with products,
advertisements, and purchase situations. Starting from 20 items, the scale has been reliably reduced to ten items (Zaichkowsky, 1994). The personal relevance expressed in Zaichowsky's involvement construct is based on the precursors of involvement (e.g. Gardner, Mitchell, & Rusao, 1985) as well as the inherent needs, values, and interests (Zaichkowsky, 1985) and is evidenced by a person's knowledge, experience, and cognitive structure (Celsi & Olson, 1988) across the product category. This means that high-involvement consumers have strongly held needs, values and interests while low-involvement consumers have weakly held or even nonexistent needs, interests and values.
Differentiating between high and low involvement profiles has also become prominent in research on PL. Steenkamp et al. (2010) conducted a large study examining when consumers are willing to pay a price premium for NB over PLs. The results showed that in conditions of high involvement, consumers are willing to pay more for NBs over PLs. Lichtenstein et al. (1988, p.246) argue that “people who are highly involved in a product associate important functional, social, and psychological outcome with the product. Therefore, highly involved consumers care more about product quality”. On one hand, NBs often position themselves with a superior product quality, while on the other hand, every product aspect of PPLs (packaging, price, labeling etc.) indicate high or higher quality as well (e.g. through labeling such as “Finest”, “Deluxe”, superior packaging, etc.). Miquel et al. (2002) argue in this direction by stating that high involvement means greater knowledge which interrelates positively with the number of attributes and brands evaluated. With respect to private labels, they argue that this relationship can result in greater PL knowledge and, in turn, to a greater likelihood of a PL purchase. However, this greater knowledge can also create favorable perceptions towards a NB, especially when perceptions of differences occur due to involvement (Miquel et al., 2002). Involvement with a product or category might, therefore, influence two variables studied within the scope of this thesis: the degree of experience and the importance of product attributes such as perceived quality.
2.4.3 Involvement and Previous Experience
Similar to the concept that high involvement means greater knowledge of a category, Giese, Spangenberg, and Crowley's (1996) results suggest that highly engaged consumers are more motivated to process messages. Celsi and Olson (1988) claim that participation also plays a role in determining consumers' attention and understanding processes (Celsi & Olson, 1988). With regard to categories, research implies that low-involvement consumers are less willing and
12 interested in dealing with information about the category, so they have less knowledge in this category. By looking at NBs and private labels, it is possible that low-involvement consumers rely on heuristics such as choosing a NB to avoid purchase risk. According to Richardson, Jain and Dick (1996), the perceived risk is an important determinant of consumer’s propensity to favorably evaluate and purchase NBs. However, perceived risk, in turn, is also influenced by perceived quality. Batra and Sinha (2000) argue that higher perceived quality variability in brands creates greater uncertainty whether the lower prices PL is of good quality, resulting in a greater perceived likelihood of making a purchase mistake.
Hypothesis 3a: The level of involvement of consumers will positively influence the purchase intent of PPLs.
Hypothesis 3b: High-involved consumers have a higher purchase intention for PPLs. Hypothesis 3c: Low-involved consumers will have a lower purchase intention for PPLs. Hypothesis 3d: There will be a difference in the quality perception of high and low-involved consumers.
2.5 Previous Experience with PL
Consumers learn over time and attitude is also formed by experience. Perceived quality perception gaps, for example, can be reduced with marketing efforts or experience. The perceived quality of PLs, in turn, can be driven by the level of consumer education as well (Sethuraman & Gielens, 2014). Hoch and Banerji (1993) explain the dominance of quality as a purchase driver by arguing that in many categories, consumers have sufficient familiarity with product benefits and attributes to make quality judgments. In addition, Richardson et al. (1996) found that the most important single construct for predicting willingness to buy store brands was familiarity. Steenkamp et al. (2010) found out that the more mature PLs are, fewer consumers are willing to pay a price premium for NBs over PLs (Steenkamp et al., 2010). Similarly, Nenycz-Thiel & Romaniuk (2016) argue that richer knowledge allows experts to learn and categorize new information more accurately and that for those experts, PPL can be categorized in a distinct subcategory more effectively. This is supported by research from McNeill and Wyeth (2011, p.108) who concluded that PL brands are “beginning to be seen as brands in their own rights [and] the risk once associated with not choosing a branded product in particular categories is lessening”.
Nenycz-Thiel & Romaniuk's (2016) findings with inconsistent quality perceptions across categories revealed that quality perceptions have become blurred between NBs and PPLs.
Furthermore, the authors found evidence that the PPLs’ quality perception depends on the level of PL market maturity.
According to Erdem at al. (2004), one reason why European store brands (PLs) have a higher market share than US store brands can be explained by (in)consistent quality levels across categories.
When consumers experience products, the perception of product quality may change. Because consumers transfer experiences with PL from one category to another, cross-category learning effects are an important consideration for PLs (Szymanowski & Gijsbrechts, 2012). In particular, it is possible to argue that positive experiences with private labels might have a positive spillover effect for PPL. Generally speaking, consumers can use the experience with a brand to update their quality beliefs about the competing brand. Such cross-brand learning often appears between products of the same brand within the same category or in different categories (Erdem et al., 2006; Erdem et al., 2004).
For the purpose of this thesis, different levels of experience will be assessed: The familiarity with PLs in general and the nature of this experience in order to research potential positive spillover effects for PPL. A person might have bought PLs in the past, liked the experience with the products and is more inclined to favorably evaluate PPL. A person who was not satisfied with PL might behave differently.
Research by Nenycz-Thiel and Romaniuk (2016) compared regular PLs, PPLs and NBs on their perceived value for money, perceived trust and perceived quality. Interestingly, their study revealed that PPLs were often perceived to be better value for money than NBs, regardless of the price. Contrary, NBs in terms of trust, were perceived as more trustworthy than PPLs. With respect to quality, the findings were varied. For some categories, consumers viewed PPLs as higher quality brands than regular PLs and in most of the categories, NBs were more strongly associated with quality than PPLs (Nenycz-Thiel & Romaniuk, 2016). However, this was not the case for all categories tested. Since quality associations were not uniform across categories, it might be possible that category-specific characteristics and consumer attitudes moderate this perception.
Hypothesis 4a: Consumers with private label experience have a higher purchase intent for premium private labels.
Hypothesis 4b: The level of experience with PL will positively influence the quality perceptions of PPLs.
CHAPTER 3: METHODOLOGY
This chapter will present and explain the methodology used to reach conclusions about the hypotheses formulated in chapter two.
3.1 Research Approach
This research aims to address consumer-specific factors that influence the purchase intention of PPLs. To accomplish those objectives, different research methods and a mix of primary and secondary data were employed.
Out of the three research methods (exploratory, descriptive and explanatory), a mix of descriptive and explanatory methods was used (Saunders, Lewis, & Thornhill, 2009). The dissertation started with the explanatory method, to gain some insights, to clarify some concepts, to formulate the research problem and to establish the hypotheses through secondary data (primarily journal articles). Secondary data was mainly used in the development of the Literature Review, but also in the study itself by using measurements adapted from academic research. Subsequently, an explanatory method was used to confirm and explain potential causal relationships between the variables using primary data. The descriptive approach was used to test the differences for the different product and branding types (PPLs and NBs). The quantitative approach used a survey research strategy by collecting data about the variables, testing the proposed hypotheses and displaying models of the effects which were further analyzed quantitatively through statistical tests.
3.2 Secondary Data
For the previous literature review, secondary data has mainly been used in the form of scientific articles. The data was used to gain insights and knowledge about potential variables related to the problem to finally generate a conceptual model and justify the hypotheses and constructs for the study. In addition, secondary research was used to provide content for the primary data collection.
16 3.3 Primary Data
In order to obtain primary data, a quasi-experiment was conducted in form of an online questionnaire using Qualtrics which was distributed via social networks and other forms of online communication. The research set up a statistical experimental survey design with 2x2 conditions: a hedonic product category and a utilitarian product category, each with two branding versions: a NB and PPL. The respondents were automatically and evenly assigned to one of the 4 groups on a random basis.
3.3.1 Survey Research Design
The online questionnaire started with an introduction, assured the respondents’ anonymity of the results and informed about the approximate duration. As an additional motivation to fully complete the survey, 0,20€ were donated for a good cause. In the first part, the term PL was introduced and it was tested whether participants have purchased private labels in the past in general and at a specific retailer as well, and their experience with the respective private labels. After assessing the general PL knowledge and satisfaction, a picture of a Lidl store was displayed and respondents were asked if they have ever visited a Lidl store and purchased products there. Subsequently, brand names from the most frequently purchased private labels from Lidl were shown to recall potentially forgotten transactions and respondents were asked to indicate previous purchases experience with the products in the same matter as for their PL experience in general, in order to compare the groups.
Next, the respondents saw one of the four product types (hedonic PPL, hedonic NB, utilitarian PPL, or utilitarian NB) and were asked to indicate their involvement with the respective product category, their quality perception of the product and the purchase intent. Since the survey preselected two types of products based on prior research on their hedonic and utilitarian value, participants needed to rate the displayed products on a hedonic versus utilitarian scale.
In the last part of the survey, the respondents completed demographic information, such as age, household income, education, and nationality.
3.3.2 Choice of Retailer and Products
Retailer Choice
The retailer Lidl was chosen based on the high consumer familiarity in Europe. According to Lidl, they have the largest network of discount food markets in Europe (Lidl, n.d.). In Germany,
for example, Lidl reaches a familiarity level of almost 100% (EHI, n.d.) and in Portugal, Lidl is dominating the Portuguese discount market (Euromonitor International, 2018)
Choice of Product Types and NBs
The two products for the research were dish liquid and chips. Dish liquid has been studied and classified as a ‘typical’ utilitarian product by past research (e.g. Suh & Youjae, 2006; Voss et al., 2003). Furthermore, the well-known brand Palmolive is distributed under the same brand in almost every country in the world. Palmolive products are available for purchase at almost every Lidl store and enjoy a high degree of recognition. Dish liquid itself is mainly purchased for practical use and based on consumer’s needs, typical for utilitarian consumption (Hirschman & Holbrook, 1982). Potato chips were chosen as a hedonic product due to the suitability of salty potato chips in terms of multisensory consumption and experience consumption (e.g. smell, visual impression, sound while eating) which are clearly hedonic attributes. One of the most internationally well-known brands is ‘Lays’. Lays is often sold at Lidl and the brand also enjoys a high degree of recognition. Salty snacks and especially potato chips have also been widely studied in research as hedonic products (Batra & Sinha, 2000; Okada, 2005; Voss et al., 2003). For both product types, a premium private label that resembles the corporate design of the premium private label ‘Lidl Deluxe’ was created. The packaging inherits the same level of information, the prices are equal and the design elements were chosen to be similar.
Results from a convenience sample can be biased and cannot be generalized to the total population (Aaker, Kumar, & Day, 2008), but they can challenge current research and common views on PL and their generalizability for PPLs. Even though the sample might not be perfectly suitable to obtain representative data, some arguments can be found in favor of the sample. The distribution of PL-buyers (92,7%) and Non-PL-buyers (7,3%) is comparable to previous findings from Euromonitor International (2013) or IRI (2018). For every product type, more than 50 respondents answered the questionnaire. From previous research on willingness to pay a price premium for NB, Steenkamp et al. (2010) received, on average, 52 respondents on each product category in each country. Even though their total observations were larger than 70000, the individual results for specific product categories were relatively small. Furthermore, the revised personal involvement measure by (Zaichkowsky, 1994) was also only validated by 80 university students and has been found applicability in much subsequent research as well (e.g. Celuch & Taylor, 1999; McQuarrie & Munson, 1987).
In total, the survey yielded 263 recorded responses of which 218 completely finished the survey. The survey was active from November 25, 2018, until December 4, 2018.
3.3.4 Measurements
The following section describes the measurements for the constructs1.
Purchase Intention
Purchase intention was measured on a 3-item scale by Bao et al. (2011) who, in turn, adapted the scale from findings from other authors (Dodds, Monroe, & Grewal, 1991; Grewal, Krishnan, Baker, & Borin, 1998)
Hedonic/Utilitarian Product Dimension of the products (adopted from (Voss et al., 2003)) In order to measure hedonic and utilitarian dimensions of consumer attitudes toward product categories, the ten-item HED/UT scale by Voss et al. (2003) demonstrated solid performance in several psychometric tests and in multiple tests of criterion and discriminant validity. In order to run statistical tests, the scale was adapted to a 7-point scale.
Perceived Quality
20 To measure the respondents’ perceived quality, the 7-point semantic differential scales, a construct developed by Bao et al. (2011), was used. This scale was also based on previous quality perception research (Grewal et al., 1998; K. L. Keller & Aaker, 1992).
Category Involvement
Product category involvement measures were taken using the ten-item revised version of Zaichkowsky's (1985) Personal Involvement Inventory (PII) due to its generalized acceptance and known as ‘the revised personal involvement inventory' (Zaichkowsky, 1994).
PL Experience – Subjective Knowledge Measure
In order to test the familiarity and experience with PLs in general, an adapted scale by Cowley and Mitchell (2003) was used. The authors measured the subjective knowledge by self-reported measures of familiarity, product knowledge, and usage as well as objective measures such as questions regarding the products. For this study, only the subjective knowledge was collected. Respondents rated themselves on a 7-point scale anchored by “not very knowledgeable” and “very knowledgeable”, “not very familiar” and “very familiar”, and “not at all frequently” and “very frequently”. The coefficient alpha for the combined subjective and objective measures was .84, indicating a high degree of internal consistency. While the original scale was an 11-point scale this researched used a 7-11-point version. The terminology used in the subsequent analysis used will be ‘PL Experience’.
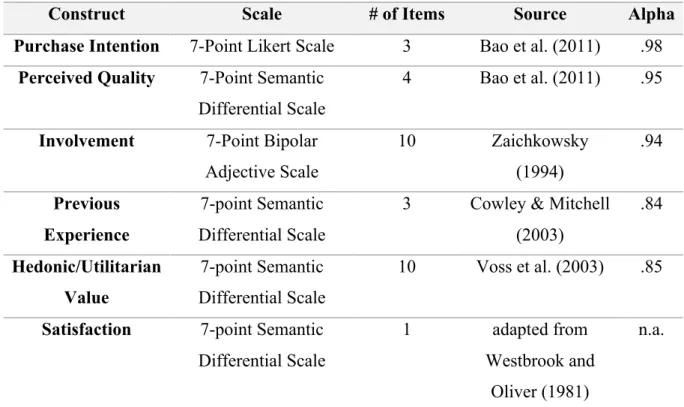
Construct Scale # of Items Source Alpha Purchase Intention 7-Point Likert Scale 3 Bao et al. (2011) .98
Perceived Quality 7-Point Semantic Differential Scale
4 Bao et al. (2011) .95
Involvement 7-Point Bipolar Adjective Scale 10 Zaichkowsky (1994) .94 Previous Experience 7-point Semantic Differential Scale
3 Cowley & Mitchell (2003) .84 Hedonic/Utilitarian Value 7-point Semantic Differential Scale 10 Voss et al. (2003) .85
Satisfaction 7-point Semantic Differential Scale
1 adapted from
Westbrook and Oliver (1981)
n.a.
Table 2 Construct Measurement Overview
3.3.5 Data Analysis
The quantitative data was analyzed using SPSS with prior preparation of the raw data including deletion of incomplete responses. Questions were non-mandatory, thus many incomplete answers needed to be deleted. Some variables were re-coded and transformed to prepare the variables for hypothesis testing. Most of the constructs were subjected to reliability analysis by Cronbach’s Alpha, and the constructs of the hedonic and utilitarian product settings were subjected to validity analysis by factor analysis. The tests used for the hypothesis testing are described in detail in chapter 4. Most of the tests conducted were either t-tests, one-way ANOVAs, regression or correlation analysis.
22 CHAPTER 4: RESULTS AND DISCUSSION
The following chapter presents and discusses the results of the survey. The first section includes a characterization of the sample, construct reliability tests and several tests to validate the stimulus manipulation. The subsequent analysis and paragraphs are structured as followed: First, the variables (Involvement, Perceived Quality, and Previous Experience) and the matching hypotheses stated in chapter 2 will be discussed, each according to the variable. For each variable, additional findings will also be presented in the same paragraph. Afterwards, the whole construct is tested, and the last part discusses the findings.
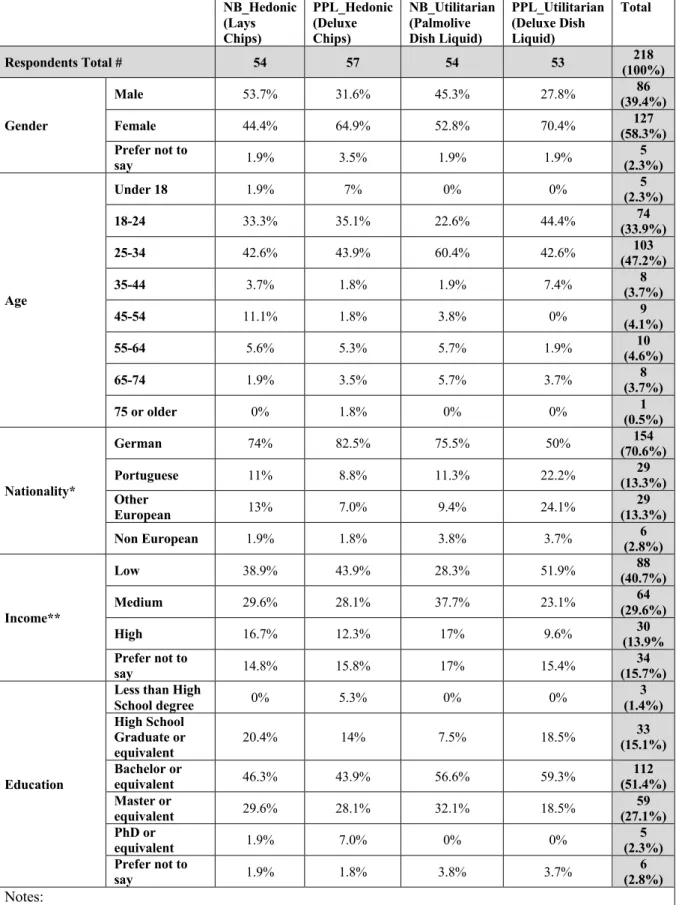
4.1 Sample Characterization
The characteristics of the valid 218 respondents are presented in the table below, split by their assignment to one of the four product stimuli. The total number of respondents was approximately evenly distributed among the stimuli. Due to convenience sampling, the majority of respondents were German, Graduates, younger than 34 and had a low or medium income. Additionally, 60% of the respondents were female and 40% were male. The population to be represented by the sample was not restricted by demographics or psychographics, thus, the sample had to be diverse in order to accurately picture the population. Since this is not the case, the sample cannot be considered representative. The following table shows that the demographics of the respondents across the four groups exposed to the different product stimuli are quite similar indicating that the groups are homogeneous. Due to the spread among the nationalities, respondents were grouped into four different groups of nationalities (German, Portuguese, Other European excluding Portugal and Germany and Non-European respondents). The different income levels were also grouped into low income (<1000€), medium (1001-2500) and high (above 2501). Please note that in some of the subsequent analyses, only PL customers were considered. NB_Hedonic (Lays Chips) PPL_Hedonic (Deluxe Chips) NB_Utilitarian (Palmolive Dish Liquid) PPL_Utilitarian (Deluxe Dish Liquid) Total Respondents Total # 54 57 54 53 218 (100%) PL Purchase Yes 50 54 49 49 202 (92.7%) No 4 3 5 4 16 (7.3%)
LIDL Visitor Yes 54 57 52 50 213 (97.7%)
NB_Hedonic (Lays Chips) PPL_Hedonic (Deluxe Chips) NB_Utilitarian (Palmolive Dish Liquid) PPL_Utilitarian (Deluxe Dish Liquid) Total Respondents Total # 54 57 54 53 218 (100%) Gender Male 53.7% 31.6% 45.3% 27.8% 86 (39.4%) Female 44.4% 64.9% 52.8% 70.4% 127 (58.3%) Prefer not to say 1.9% 3.5% 1.9% 1.9% 5 (2.3%) Age Under 18 1.9% 7% 0% 0% 5 (2.3%) 18-24 33.3% 35.1% 22.6% 44.4% 74 (33.9%) 25-34 42.6% 43.9% 60.4% 42.6% 103 (47.2%) 35-44 3.7% 1.8% 1.9% 7.4% 8 (3.7%) 45-54 11.1% 1.8% 3.8% 0% 9 (4.1%) 55-64 5.6% 5.3% 5.7% 1.9% 10 (4.6%) 65-74 1.9% 3.5% 5.7% 3.7% 8 (3.7%) 75 or older 0% 1.8% 0% 0% 1 (0.5%) Nationality* German 74% 82.5% 75.5% 50% 154 (70.6%) Portuguese 11% 8.8% 11.3% 22.2% 29 (13.3%) Other European 13% 7.0% 9.4% 24.1% 29 (13.3%) Non European 1.9% 1.8% 3.8% 3.7% 6 (2.8%) Income** Low 38.9% 43.9% 28.3% 51.9% 88 (40.7%) Medium 29.6% 28.1% 37.7% 23.1% 64 (29.6%) High 16.7% 12.3% 17% 9.6% 30 (13.9% Prefer not to say 14.8% 15.8% 17% 15.4% 34 (15.7%) Education
Less than High
School degree 0% 5.3% 0% 0% 3 (1.4%) High School Graduate or equivalent 20.4% 14% 7.5% 18.5% 33 (15.1%) Bachelor or equivalent 46.3% 43.9% 56.6% 59.3% 112 (51.4%) Master or equivalent 29.6% 28.1% 32.1% 18.5% 59 (27.1%) PhD or equivalent 1.9% 7.0% 0% 0% 5 (2.3%) Prefer not to say 1.9% 1.8% 3.8% 3.7% 6 (2.8%) Notes: *Consolidated Nationalities.
**Different levels were combined to create a consolidated table. Table 3 Sample Characteristics
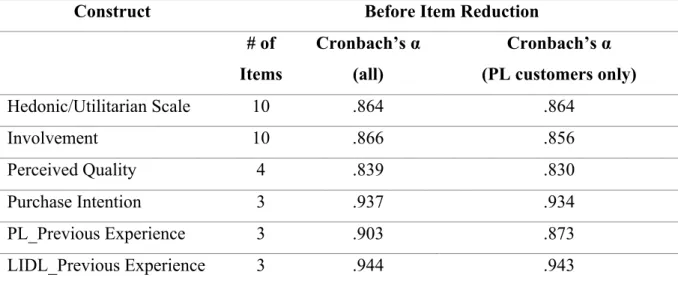
24 4.2 Measure Reliability
All items used in the survey were approved by previous literature and tested on the internal consistency reliability with a Cronbach’s alpha test. Before running a Cronbach’s Alpha test, the negative variables (disagreement) and the reversed items were recoded into positive variables (agreement) in order to make them comparable. The Cronbach’s Alpha for a constructs’ internal consistency reliability is considered satisfactory when the Cronbach’s Alpha coefficient is > 0.6, good when > 0.8, and excellent when > 0.9 (Gliem & Gliem, 2003). The results in the table below show that all the constructs have good internal reliability, and are therefore considered satisfactory.
Construct Before Item Reduction
# of Items Cronbach’s α (all) Cronbach’s α (PL customers only) Hedonic/Utilitarian Scale 10 .864 .864 Involvement 10 .866 .856 Perceived Quality 4 .839 .830 Purchase Intention 3 .937 .934 PL_Previous Experience 3 .903 .873 LIDL_Previous Experience 3 .944 .943
4.3 Manipulation Check
Before the hypotheses testing, manipulation checks verified commonalities among branding and product types.
4.3.1 Hedonic/Utilitarian Measure – Measure reliability
The 10 items of the hedonic/utilitarian scale developed by Voss et al. (2003) were subjected to principal components analysis using SPSS2. Prior, the suitability of data for factor analysis was assessed. Inspection of the correlation matrix revealed the presence of many coefficients of .3 and above. The Kaiser-Meyer-Olkin value was .856 exceeding the recommended value of .6 (Kaiser, 1974) and Bartlett’s Test of Sphericity (Bartlett, 1954) reached statistical significance, supporting the factorability of the correlation matrix. An inspection of the scree plot revealed a clear break after the second component, thus two components were retained for further investigation. Furthermore, an Oblimin rotation was performed and showed a number of strong loadings and all variables loading substantially on only one component. The interpretation of component 1 (utilitarian) and component 2 (hedonic) was consistent with the original research on hedonic and utilitarian product types, whereas utilitarian products loaded strongly on component 1 and hedonic on component 2 (Voss et al., 2003). This validates that the scale items measure what they are supposed to measure. There is a weak positive correlation between the two factors (r= .215). The results made it possible to combine the items into two new variables (5 utilitarian items and 5 hedonic items), ‘Utilitarian Value’ (sum of utilitarian items) and ‘Hedonic Value’ (sum of hedonic items). In order to make them comparable, the scales were transformed into (-3; -2; -1; 0, 1, 2, 3) for the hedonic variables and the other way around for the utilitarian variables.
26 4.4 Hypothesis 1a – Perception of PPLs and NBs
H1a: PPLs of the same product types (chips or dish liquid) are not perceived significantly different from NBs in terms of hedonic and utilitarian value.
H0: µ���������������� _ = µ���������������� _ = µ���������������� _ = µ���������������� _ H0: µ������������ _ = µ������������ _ =µ������������ _ = µ������������ _
The ������������ means of the chips (NB_HED and PPL_HED) were positive and the ���������������� means were negative, which indicates a hedonic product type. The means of the dish liquids (NB_UT and PPL_UT) were positive for ���������������� and negative for ������������ indicating a utilitarian product type.
Two one-way ANOVAs were conducted to reveal differences across the four product stimuli on ���������������� and ������������. The whole sample was taken into consideration. Tests of the assumption of normality for ���������������� and ������������ were tested using standardized residuals. Both normality distribution curves can be found in the Appendix. The Levene’s test was not significant indicating no violation of assumptions of homogeneity in
variances (� =.514; � =.738).
The ANOVAs revealed significant differences between the product (����������������: F(3)=30.013, p<.001; ������������: F(3)=30.139, p<.001), rejecting the null hypothesis of equal variances among the groups. H1a, however, cannot be rejected because the Tukey HSD post-hoc tests revealed that there were only statistically significant differences at p < .000 in utilitarian and hedonic value scores between the product types (UT vs. HED), but no significant results across the branding types. The full post-hoc test can be found in Appendix 4. In conclusion, there were significant differences between chips and dish liquids, but the two chips brandings were not perceived significantly different, neither were the two dish liquid branding types.
Stimulus N μ Ut. Value Std. Deviation μ Hed. Value Std. Deviation
NB_HED 54 -1,67* 6,58 4,05* 6,41
PPL_HED 57 -0,29* 6,12 2,87* 5,64
* no statistically significant difference found: àμUt. Value (NB_HED) = μUt. Value (PPL_HED) p=.648 * no statistically significant difference found: à μHed. Value (NB_HED) = μHed. Value (PPL_HED) p=.710
PPL_UT 54 6,72** 6,01 -4,48** 4,96
NB_UT 53 2,89** 5,94 -0,18** 6,13
** no statistically significant difference found: àμUt. Value (NB_UT) = μUt. Value (PPL_UT) p=.989 ** no statistically significant difference found: à μHed. Value (NB_UT) = μHed. Value (PPL_UT) p=.779 Table 5 Comparison of Means for Hedonic and Utilitarian Values across product and branding types.
4.5 The role of Involvement
This chapter will deal with the independent variable involvement. The first part will describe and test the used scale, the second part tests the hypotheses and afterwards, some additional analyses are presented.
4.5.1 Personal Involvement Inventory – Measure reliability
The 10-item scale of the personal involvement inventory (PII) (Zaichkowsky, 1994) was also subjected to a principal components analysis with the goal to obtain similar results to the original research. The inspections of the correlation (larger than .3 for many coefficients), KMO (.855) and Bartlett’s Test (significant, p=.000) were successful. The scree plot revealed a clear break after the second component, thus two components were retained for further investigation. Similar to Zaichkowsky's findings (1994), the items interesting, appealing, fascinating, exciting and involving loaded strongly on one item and the other items (important, relevant, valuable and needed) with the exception of ‘means a lot to me’ loaded strongly on the other factor. The first factor in PII was referred to as being of affective nature while the second one was referred to be the cognitive aspect. Since the analysis led to results similar to the original research, the scale is considered to be valid and appropriate for this research (Details on the analysis in the Appendix).
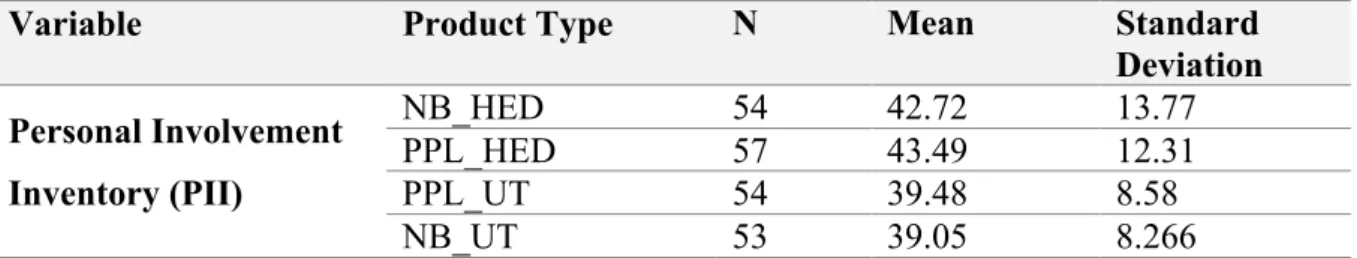
A comparison of means revealed that the NB_HED (� =42.72; SD=13.77) and the PPL_HED (� =43.49; SD=12.31) had higher means than NB_UT (� =39.05; SD=8.27) and PPL_UT (� =39.48; SD=18.58). When comparing the means with the theoretical mean of 40, all product types can be considered as rather low involvement products. An additional analysis (ANOVA) revealed no statistically significant differences between the groups (F(3)=2.250, p=.084). Since the Levene’s statistic was significant, the null hypothesis of homogeneity of variance needed to be rejected and the Brown Forsythe and Welch Test results were used. Both indicated no statistically significant difference in PII Means (Welch: p=.077; Brown-Forsythe: p=.082).
Table 6 Involvement across stimuli – Descriptive Statistics
Variable Product Type N Mean Standard
Deviation Personal Involvement Inventory (PII) NB_HED 54 42.72 13.77 PPL_HED 57 43.49 12.31 PPL_UT 54 39.48 8.58 NB_UT 53 39.05 8.266
28 4.5.2 Involvement and Purchase Intention (Hypothesis 3a)
H3a: The level of involvement of consumers will positively influence the PPL purchase intention
H0: bInvolvement<=0
As a first step to explore the proposed relationship, a Pearson correlation analysis was performed with prior preliminary analyses to ensure no violation of the assumptions of normality, linearity, and homoscedasticity. There was a medium, negative correlation between the two variables (����������� & ����ℎ��� ��������� ), r= -.439, N=103, p<.001, with high levels of ����������� associated with low levels of ����ℎ��� ��������� (Cohen, 1988). A linear regression was used to assess the ability of involvement to predict ����ℎ��� ��������� . Only PPL stimuli respondents were used. Preliminary analyses were
conducted to ensure no violation of the assumptions of normality, linearity, and homoscedasticity. ����������� predicts around 19% of the variance in ����ℎ��� ��������� (Rsquared=.193). The model reached statistical significance (Sig.=.000). The Beta of ����������� (-.439) indicated a large, significant contribution (p<0.05). The level of ����������� therefore negatively influences the ����ℎ��� ��������� , thus rejecting H3a.
4.5.3 Involvement Levels and PPL Purchase Intentions (Hypothesis 3b & 3c)
H3b: High-involved consumers have a higher purchase intention for PPLs. H3c: Low-involved consumers will have a lower purchase intention for PPLs. H0: µ�������ℎ������������ = µ�������ℎ������������
To test the hypotheses and in order to differentiate between different levels of ����������� quickly, a k-means cluster analysis was performed with three clusters (high, medium and low involvement)3. All respondents were considered.
Cluster and Description Mean PII # of Cases Std. Deviation
1: High involvement 56.86 45 6.29
2: Medium involvement 40.71 102 3.90
3: Low involvement 28.85 54 5.21
Table 7 Descriptive Statistics for Involvement Levels
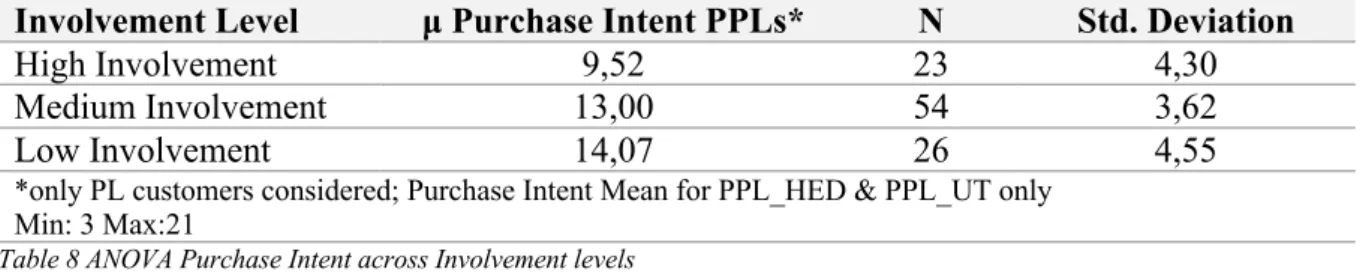
Interestingly, a comparison of means revealed that the ����ℎ��� ��������� (both products) varied across the different ����������� levels. High involvement respondents showed a lower ����ℎ��� ��������� than medium or low involved respondents, which was not expected. A one-way ANOVA revealed significant differences across the groups (F(2)=8.689, p=.000). The assumptions of homogeneity of variance were not violated (Levene’s statistic n.sign.). The Tukey HSD Posthoc tests showed that there were significant differences across
����������� (Mean=9.52) and ����������� (Mean=13.00) and
����������� (Mean=14.07). However, there were no significant differences across Medium and Low Involvement Groups.
Involvement Level μ Purchase Intent PPLs* N Std. Deviation
High Involvement 9,52 23 4,30
Medium Involvement 13,00 54 3,62
Low Involvement 14,07 26 4,55
*only PL customers considered; Purchase Intent Mean for PPL_HED & PPL_UT only Min: 3 Max:21
Table 8 ANOVA Purchase Intent across Involvement levels
Since the results of the hypothesis testing revealed a negative correlation instead of a positive correlation between Involvement and ����ℎ��� ��������� , Hypothesis 3b and 3c need to be rejected.
Additional analysis on PII in form of a one-way ANOVA did not detect differences of Involvement across product types (Appendix). Further analysis repeated the above-mentioned tests for NBs. For NBs, the involvement even explained 43.8% of variance in NB Purchase Intent. The correlation indicated a strong, negative relationship (r=-.662) and the Beta of Involvement of -.259 also implied a large contribution (p<0.05). The one-way ANOVA detected differences for the three involvement levels between all groups (F(2)=26.57). In conclusion, the same effects of involvement were detected for NB Purchase Intention as well.