CRISTINA CALVO-PORRAL [email protected]
Professor at Universidade da Coruña, Facultad de Economía y Empresa – Coruña, Spain
VALENTÍN-ALEJANDRO MARTÍNEZ-FERNÁNDEZ
Professor at Universidade da Coruña, Facultad de Economía y Empresa – Coruña, Spain
OSCAR JUANATEY-BOGA [email protected]
Professor at Universidade da Coruña, Facultad de Economía y Empresa – Coruña, Spain
ARTICLES
Submitted 07.15.2014. Approved 03.26.2015
Evaluated by double blind review process. Scientiic Editor: Felipe Zambaldi
INFLUENCE OF MANUFACTURER SIGNATURE
ON STORE BRANDS’ LOYALTY AND
PURCHASE INTENTION
Inluência da assinatura do fabricante na lealdade e intenção de compra de
marcas próprias de varejista
Inluencia de la irma del fabricante sobre la lealtad a las marcas blancas y la
intención de compra
ABSTRACT
With today’s trend toward higher store concentration, building strong store brands has become a priority for many retailing companies. This study aims to analyze the diferences in store brands’ purchasing likelihood between store brands with a manufacturer identiication – a manufacturer sig-nature – and store brands with no information about the manufacturer, as well as the moderating role of the manufacturer signature on store brands’ purchase intention. We carried out multiple group analysis through structural equation modeling. Our indings suggest that store brand image has the most signiicant inluence on loyalty and purchase intention for both types of store brands. Moreover, and contrary to our expectations, we did not ind empirical support for the moderating role of manu-facturer signature on store brands’ purchasing likelihood.
KEYWORDS | Store brand, purchase intention, loyalty, manufacturer, retailer.
RESUMO
Com a atual tendência a uma maior concentração das lojas, a construção de marcas próprias de varejista tornou-se uma prioridade para muitas empresas de varejo. O presente estudo destina-se a analisar as diferenças de propensão à compra de marcas próprias entre marcas próprias com identiicação de fabricante – assinatura do fabricante – e marcas próprias sem informações sobre o fabricante, bem como o papel moderador da assinatura do fabricante na intenção de compra de marcas próprias. Realizamos análises multigrupo através da modelagem de equações estruturais. Nossos achados sugerem que a imagem da marca própria exerce a inluência mais signiicativa sobre a lealdade e a intenção de compra para ambos os tipos de marcas próprias. Ademais, e contraria-mente a nossas expectativas, não encontramos apoio empírico para o efeito moderador do papel da assinatura do fabricante na propensão à compra de marcas próprias de varejistas.
PALAVRAS-CHAVE | Marca própria de varejista, intenção de compra, lealdade, fabricante, varejista.
RESUMEN
Debido a la tendencia actual hacia la mayor concentración en la distribución, la construcción de marcas fuertes del distribuidor se ha convertido en una prioridad para muchas empresas de dis-tribución. Este estudio trata de analizar las diferencias en la predisposición a comprar marcas del distribuidor, entre aquellas con identiicación del fabricante –irma del fabricante– y aquellas otras que no ofrecen información sobre el fabricante del producto; así como analizar el papel moderador de la irma del fabricante en su intención de compra. Se llevó a cabo un análisis multigrupo mediante un modelo de ecuaciones estructurales. Nuestros resultados sugieren que la imagen ejerce la mayor inluencia sobre la lealtad y la intención de compra de ambos tipos de marca del distribuidor. Además, y contrariamente a nuestras suposiciones, no hallamos suiciente evidencia empírica para conirmar el papel moderador de la irma del fabricante en la predisposición a comprar marcas del distribuidor.
INTRODUCTION
With today’s trend toward retailing internationalization, higher store concentration, global recession, and changing consumer habits, building strong retailer brands has become a marketing
priority for many retailing companies (Ailawadi & Keller, 2004;
Anselmsson, Johansson, & Persson, 2007). Industry reports conirm that the market share of store brands have risen around the world in the last decades, reaching signiicant levels across Europe and
North America (Kumar & Steenkamp, 2007; Manzur, Olavarrieta,
Hidalgo, Farías, & Uribe, 2011). Store brands, termed also private brands, retailer brands, wholesale brands, and distributor’s brands,
are brands developed and managed by retailers (Ailawadi & Keller,
2004; Bao, Bao & Sheng, 2011) which have been increasingly attracting the interest of managers and marketing scholars, in
parallel with their increasing market share (Karry & Zaccour, 2006).
There are many incentives for retailers to create and manage store brands, such as increasing customer loyalty, retailer performance, proit margins, and a high value ofering in the marketplace
(Corstjens & Lal, 2000; Diallo, 2012;Sudhir & Talukdar, 2004). Although store brands seem to ofer a better price-quality relationship than manufacturer brands, they are targeting and meeting a speciic consumer demand with a particular ofer,
pricing, and packaging (Ailawadi & Keller, 2004). Although previous
literature has stressed that store brands’ competitiveness comes
mainly from lower prices and less promotional expenses (Bao, Bao,
& Sheng, 2011), many authors now note that store brands ofer
quality levels similar to manufacturer brands (Grewal & Levy, 2009).
The present study aims to provide a more in-depth understanding of the variables inluencing store brands’ loyalty and purchase intention, as well as an assessment of the inluence of manufacturer signature – that is, an identification of the manufacturer on the package – on purchase intention. More speciically, the main contribution we expect to make with this study is threefold. First, the aim of the study is to investigate the inluence of manufacturer signature on consumers’ store brand loyalty and purchase intention. For this purpose, we will evaluate the impact of manufacturer identiication on store brands’ packages – the so-called manufacturer signature – since previous research has demonstrated the major importance of perceived risk on store brands purchase
behavior (Diallo, 2012; Liljander, Polsa, & Riel, 2009), although
little is known about the inluence of manufacturer identiication. Second, we attempt to examine the inluence of store image, store brands’ perceived quality, and store brands’ image on consumers’ behavioral intentions. Finally, we analyze the mediating inluence of store brand loyalty on the relationships considered in our proposed conceptual model. Our study provides some interesting insights for retail managers, since shedding light on consumer behavior
towards store-branded products allows a better understanding of the retailing market. This paper is structured as follows. In the irst section we develop a conceptual framework based on the intangible attributes of store brands. This is followed by a description of both the methodology adopted and the ieldwork. Subsequently, results are presented and discussed. Finally, major conclusions and some managerial implications are provided.
CONCEPTUAL FRAMEWORK
Store brands’ positioning and manufacturer
signature
Price plays an essential role in the coniguration of store brands’
proposition (Richardson, Jain, & Dick, 1996), since store brands
are characterized by a low-price positioning that comes from consumers’ perceiving store brands as a convenient price
option compared to manufacturer brands (Ailawadi, Pauwels, &
Steenkamp, 2008). Store brands’ initial positioning was based on ofering consumers a competitive price as an alternative to manufacturer brands, helping retailers to compete in the
price-sensitive segment (Corstjens & Lal, 2000). Purchasers of store
brands are generally value-conscious (Bao et al., 2011) and tend
to seek low prices for a certain quality, i.e., they do not purchase store brands because they are cheap, but rather because such
brands are good value for money (Hoch & Banerji, 1993). However,
recently, store brands have been developed with a stronger orientation towards quality, ofering a value proposition similar
to manufacturer brands (Hoch & Banerji, 1993).
In addition, diferent types of store brands are available in the marketplace: some retailers do not delete the manufacturer information from the product package, which allows manufacturer recognition; while other retailers do not provide information about the manufacturer of their store brand products. More speciically,
the term manufacturer signature (Inman, Shankar, & Ferraro, 2004)
refers, in the present study, to the manufacturer identiication on the package of a store brand product. Therefore, store brands
may or may not identify a particular product manufacturer (Huang
& Huddleston, 2009). Following Choi and Huddleston (2013), consumers hold a favorable, strong quality perception toward store brands when the manufacturer’s name is present. As prior research suggests, both store image and product signature induce positive
evaluations on consumers (Bao et al., 2011). Additionally, according
association or link between the product manufacturer and the store
brand, reducing purchase risk (Bao et al., 2011). Moreover, the
store brand with a manufacturer signature sends a strong signal to consumers about the product quality and image, perceptually
carrying a lower purchase risk (Bao et al., 2011;Batra & Sinha,
2000) compared with store brands with no manufacturer signature. That is, the manufacturer’s name and reputation are directly linked to the store brand product. Consequently, the present study proposes that consumers would have more favorable perceptions and a stronger purchase intention towards those store brands with a manufacturer identiication, considering that consumers will prefer the guarantee of a familiar manufacturer, rather than the risks linked with purchasing an unknown manufacturer
product (Baltas, 1997). In this vein, our study maintains that a
cue the retailer could employ to inluence store brands’ purchase intention is manufacturer signature.
Research questions and hypotheses
The present study aims to analyze how store brands’ loyalty and purchase intention are formed. To this end, we compare store brands with a manufacturer signature – that is, with a manufacturer identiication on the package – and store brands lacking that information. More speciically, we pose one major research question: “What are the inluences of store and brand image on customer loyalty and purchase intention in the case of store brands with a manufacturer signature, and in the case of store brands without a manufacturer signature?”.
The mediating role of store brand loyalty
One of the goals of the this study is to examine the mediating role of store brand loyalty and its inluence on purchase intention. According to previous research, store brand loyalty is inluenced
both by a store brand’s favorable image (Steenkamp & Dekimpe,
1997) and by a store brand’s perceived quality (Choi & Huddleston, 2013). However, not only does empirical evidence exists of the relationship between store brand image, perceived quality, loyalty,
and purchase intentions (Huang & Huddleston, 2009), but also
it has been demonstrated that store brand loyalty mediates the relationship between image, perceived quality, and the purchase
intention (Huang & Huddleston, 2009).
Store image
In the present study, the authors consider that store image is expressed in terms of a store’s attributes as assessed by consumers
(Devlin, Birtwistle, & Macedo, 2003). Moreover, following Beristain
and Zorrilla (2011), we assume two key dimensions of store image, namely store commercial image and store social image.
Store commercial image
Store image refers to the consumer’s global impression of a
retail store (Zimmer & Golden, 1988), and it is one of the main
sources of store value (Hartman & Spiro, 2005). Ailawadi and
Keller (2004) deine store image as the retailer’s image in the
mind of the consumer. According to Diallo (2012), store image
develops based on consumers’ perceptions learned over time. In this vein, retailer image is a key source of store value, and distributing a brand through an outlet with a good image will create a more favorable image than distributing it through an
outlet with a bad image (Zeithaml, 1988). Previous research
has demonstrated that store image perceptions positively
inluence store brand purchase intention (Liljander et al., 2009).
In addition, previous studies have demonstrated that store associations and evaluations can be generalized to store brands
(Beristain & Zorrilla, 2011; Collins-Dodd & Lindley, 2003;Vahie & Paswan, 2006).
On the other hand, store commercial image has generally been conceptualized as the way in which the store is deined in the consumer’s mind by functional attributes such as the quality of products ofered, product assortment, services provided to customers, physical facilities and layout, internal environment,
and good value-for-money relationship (Anselmsson et al., 2007;
Chowdhury, Reardon, & Srivastava, 1998). Therefore, we propose the following hypothesis:
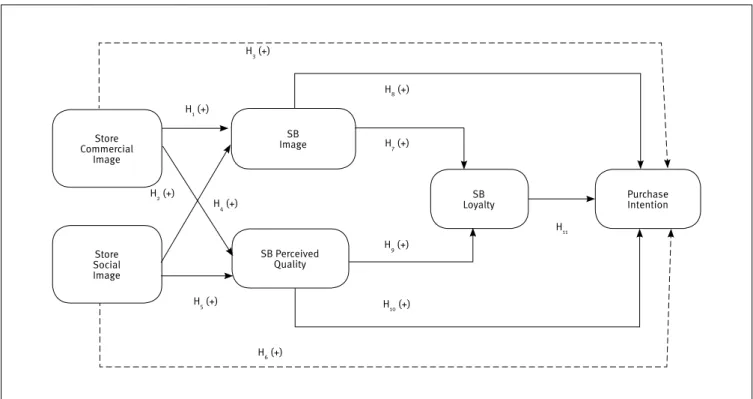
H1: Store commercial image has a positive inluence on store brand image.
Previous research has found that store image can have
signiicant positive efects on perceived quality (Dodds, Monroe,
& Grewall, 1991), and that retailer commercial image allows
consumers to infer the quality of the merchandise (Bao et al.,
2011). As a result, consumers perceive a store brand owned by a store with a good image to carry higher quality than a brand
from a store with a poor image (Bao et al., 2011); and a favorable
store image will have a positive impact on consumers’ behavior
towards the brand (Yu & Ramanathan, 2012). Moreover, previous
research shows that store image can be determining to product
quality (Smejn et al., 2004). Therefore, because store image
H2: Store commercial image has a positive inluence on store brand perceived quality.
Previous research has also demonstrated that store image perceptions can positively inluence store brand purchase
intention (Diallo, 2012; Liljander et al., 2009;Vahie & Paswan
2006). Thus, we propose the following research hypothesis:
H3: Store commercial image has a positive inluence on store brand purchase intention.
Store social image
Store social image is conceptualized as the store’s attributes
as perceived and assessed by consumers (Devlin et al., 2003).
According to Turban and Greenging (1996) and Brown and Dacing
(1997), consumers perceive a company by evaluating aspects such
as the company’s behavior and commitment to society (Higgins &
Bannister, 1992). In this vein, Keller and Aaker (1992) highlighted the key role of innovation capacity, which inluenced both the perceived quality and purchase intention of brands identiied
with the store’s name. Finally, Beristain and Zorrilla (2011) posited
that consumers who perceive a store as a competent irm, with know-how and experience, may also perceive it as developing high-quality own brands.
Accordingly, when consumers choose a store brand, they are inluenced partly by the retailer’s social reputation and
image (Choi & Huddleston, 2013). More speciically, stores can
be perceived as companies, whereby store image can be linked to aspects such social interest and commitment, and global
corporate strategy (Beristain & Zorrilla, 2011). In the present
study, we assume the social image of a store to derive from
its social behavior and corporate background (Schmidt, 1995).
Consequently, a store’s social image has a positive inluence on both the image and the purchase intention of its store brand
(Anselmsson et al., 2007; Beristain & Zorrilla, 2011).The following hypotheses are thus proposed:
H4: Store social image has a positive inluence on store brand image.
H5: Store social image has a positive inluence on store brand perceived quality.
H6: Store social image has a positive inluence on store brand purchase intention.
Store brand image
Store brand associations or image
Aaker (1991) deines brand associations – or image – as the information in the consumer’s mind linked to the brand that
creates favorable attitudes towards the brand. According to Yoo,
Donthu, and Lee (2000), brand associations consist of multiple images, ideas, instances, or facts that establish a solid network of brand knowledge, resulting in a higher purchase intention.
Following Beristain and Zorrilla (2011), store brand associations
are related to a certain type of consumer, as purchasing products or brands with a good value-for-money relationship lead to a smart buyer impression, and store brands ofer a better price-quality relationship than manufacturer brands, thus leading to store
brand loyalty and purchase intention (Martos-Partal &
González-Benito, 2011). Therefore, the following research hypotheses are proposed:
H7: Store brand image has a positive inluence on store brand loyalty.
H8: Store brand image has a positive inluence on store brand purchase intention.
Store brand perceived quality
According to Zeithaml (1988), perceived quality is conceptualized
as consumers’ global judgment of a brand or product overall excellence or superiority. Perceived quality is also related to consumers’ subjective perception of a product or brand attributes, and it constitutes a core brand value, as it is related with brand
purchase and brand choice (Aaker, 1991). Following Bao et al.
(2011), perceived quality is an intangible attribute speciic to a product category or a brand name in the marketplace.
Pappu, Quester, and Cooksey (2005) demonstrated that the higher the quality consumers perceive in a brand, the more likely they are to be loyal to it. Furthermore, the outcome of consumer’s associations and perceived quality can result in loyalty to a
speciic store brand (Choi & Huddleston, 2013). Consequently,
we hypothesize the following:
H9: Store brand perceived quality has a positive inluence on store brand loyalty.
Quality is one of the main determinants of brand purchase, and, additionally, quality perception is positively related with
store brand purchase intention (Grewal, Krishnan, Baker, &
Borin, 1998;Richardson et al., 1996). Perceived quality is so important that it can be dominant in determining consumers’
intention to purchase store brands (Jin & Suh, 2005; Bao et al.,
H10: Store brand perceived quality has a positive inluence on store brand purchase intention.
Store brand loyalty and purchase intention
According to Jacoby (1971), loyalty should be studied as a behavior, with emphasis on the fact that loyalty also has an attitudinal
component, present in the loyalty process. Moreover, Dick and Basu (1994) deine loyalty as the relationship between the relative
attitude toward a brand, product, or service and a patronage behavior. For this reason, the present study evaluates both attitudinal
and behavioral components of loyalty. Later, Oliver (1999) deines brand loyalty as a deeply held commitment to rebuy or repatronize
a preferred product or service consistently in the future, despite situational inluences, showing a strong inluence on purchase
intention. According to Aaker (1991) brand loyalty relects how likely a customer is to switch to another brand, especially when
that brand undergoes a change, either in price or features. Myers (2003) remarked a positive signiicant relationship between the
dimensions of store brand loyalty, brand preference, and purchase intention. Following Diallo (2012), the purchase intention could
be conceptualized as the consumer’s tendency to purchase a brand routinely and resist switching to other competing brands. In the present study, we refer to the purchase intention in order to operationalize the consumer purchase behavior toward store brands. Thus, this set of considerations leads us to propose this research hypothesis:
H11: Store brand loyalty has a positive inluence on purchase intention.
Following these theoretical considerations, we propose a model of formation of store brand loyalty and purchase intention as shown in Figure 1.
Figure 1.
Proposed Conceptual Model 1
Store Commercial
Image
Store Social Image
SB Image
SB
Loyalty PurchaseIntention
SB Perceived Quality H1 (+)
H3 (+)
H8 (+)
H7 (+)
H9 (+)
H10 (+)
H6 (+) H5 (+)
H4 (+) H2 (+)
H11
METHOD
Data collection
employees at small and medium size companies, all of whom were consumers residing in Spain. More speciically, we invited them to complete the online questionnaire, which included some information about the study. The questionnaires evaluated a particular store brand, and ive diferent types of questionnaires were prepared, each type covering the store brand of one of the ive major retailers in Spain – Carrefour, Mercadona, El Corte Inglés, Dia, and Eroski – while considering diferent retailing
formats. We deliberately did not ask participants to select the store
brand they had knowledge of or consumer experience with; each respondent was given a single questionnaire randomly chosen, and told that even if he/she had never shopped in that particular store, he/she would have perceptions or beliefs about the store’s image or the store brand’s quality or image. Finally, a sample of 374 consumers was gathered, totaling 326 valid responses (Eroski = 77, Carrefour = 74, El Corte Inglés = 74, Dia = 67 and Mercadona
= 69). Sampling error was 5.53%, with a conidence level of 95%
under the hypothesis p = q = 0.5.
The last part of the questionnaire contained several socio-demographic questions. With regard to sample proile, 36.1% of the respondents were aged from 31 to 45, while 32.8% were aged 46 to 60. A total 65.68% of the respondents were female. In terms of education level, over 38% of the participants had completed secondary education, while 17.5% had a higher education degree. Data also indicated that all of the respondents were frequent store brand purchasers, as the majority indicated purchasing store brands every week (44.7%) and 21.4% of the participants purchased store brands every ifteen days.
Variables and measurement scales
We followed two criteria in order to select the retailers for this study. Firstly, we considered Spain’s major retailers by total
revenue in 2012 (Worldpanel Distribución, 2012). Secondly, we
took into account retailers that named their store brands with their own names, including either the store name or logo on the packaging, except for Mercadona, which was selected due to its revenue alone, although its store brand name is not the same as the store’s, i.e., its store brands are called Hacendado, Bosque Verde, and Deliplus. Thus, we selected ive major popular retailers – Carrefour, Mercadona, Dia, Eroski, and El Corte Inglés. These store brands have a diferent manufacturer identiication on their package. More precisely, the store brands of Mercadona, Eroski, and El Corte Inglés (n = 219) identify the manufacturer of their store brand products in all product categories, so these store brands are considered manufacturer signature products, i.e., the products’ manufacturers are informed on the packages. On the other hand, the store brands of Carrefour and Dia (n = 143) exhibit
no manufacturer identiication on the packaging, providing only their social identiication code number.
All measures were adapted from, or developed based on, prior research, and a classic Likert-type 1-5 scale was used. Store commercial image was measured using three items adopted
from Chowdhury et al. (1998) and Beristain and Zorrilla (2011) in
order to assess consumers’ perception of the store from multiple perspectives, such as product ofer, service, and quality. Secondly, we used three items to measure store social image, which we
adopted from previous studies (Handelman & Arnold, 1999)
about the inluence of company experience and innovation on consumers’ perceptions. Store brand image was measured on
a 3-item scale comprising the items proposed by Aaker (1991)
and Netemeyer et al. (2004). Store brands quality perception
was measured with the scale proposed by Doods et al. (1991),
which assesses how the consumer globally evaluates the quality of a product or brand. To measure store brand loyalty, we used
two items proposed by Yoo et al. (2000) to determine whether
the consumer is considered loyal to a particular brand. Finally, purchase intention was measured on a 2-item scale that includes
items adopted from Netemeyer et al. (2004). Therefore, a brief
literature review was used to establish the conceptual framework and the variables used in our research (Table 1).
RESULTS
Analysis of the measurement model
Following Anderson and Gerbing’s (1988) methodological
proposal, the data analysis adopts a two-step approach. The irst stage involves assessing the measurement model, and the second stage proceeds to test the structural relationships and research hypotheses among the constructs. Structural equation model was carried out with Amos 18.0 in order to analyze the proposed model, using maximum likelihood estimation, thus providing a conirmatory factor analysis (CFA) to test the overall it of the measurement model. For this model, the comparative it index (CFI), root mean square error of approximation (RMSEA), Tucker-Lewis Index (TLI), and root mean square residual (RMR) all
complied with the threshold levels according to Hair et al. (1999).
All of the obtained it measures indicated that the structural model
was acceptable (X2/ df = 3.094; p < 0.000): RMSEA = 0.054; RMR
= 0.041; TLI = 0.959; and CFI = 0.972).
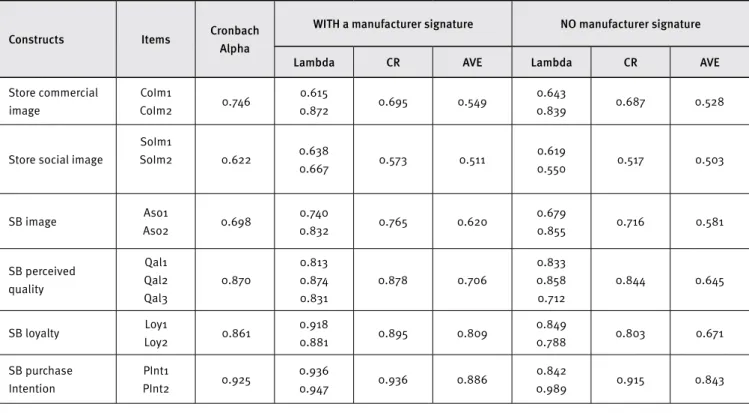
constructs, following Anderson and Gerbing (1988). With regard to reliability, we obtained Cronbach Alpha values from 0.622 to
0.925 (Table 2), which is acceptable according to Anderson and
Gerbing (1988) and Hair, Anderson, Tatham, and Black (1999). As a result, 13 items were retained for six constructs in the study, with all the constructs meeting the reliability level of 0.6. Then, composite reliability values (CR) were calculated, reaching the recommended level of 0.50, indicating that all measures had good
reliability (Baggozi & Yi, 1988; Hair et al., 1999). Moreover, average
variance extracted (AVE) was used to measure convergent validity. All constructs had values higher than the suggested 0.5 threshold,
suggesting the convergent validity of the scale (Fornell & Larcker,
1981). All the completely standardized factor loadings reached the level of signiicance, with a reliability level of 95%, and reached the 0.50 threshold, thus supporting a strong convergent validity
(Fornell & Larcker, 1981; Steenkamp & Trjp, 1991).
Table 1.
Variables and measurement scales
Constructs Indicators
Store commercial image
Chowdhury et al. (1998), Beristain and Zorrilla (2011)
CoIm 1 Store X ofers high quality products
CoIm 2 The store X ofers services I’m looking for (ex. Pay over time, product return, etc.)
Store social image
Handelman and Arnold (1999).
SoIm 1 Store X has a long experience in retailing
SoIm 2 X makes eforts to introduce new products and services to the market
SB image
Aaker (1991), Netemeyer et al. (2004)
Aso 1 I associate products of store brand X with positive characteristics (ex. good prices) Aso 2 Customers of products of store brand X know how to buy (purchasing with common sense)
SB perceived quality Doods et al. (1991)
Qal 1The products of store brand X are high quality products Qal 2 The products of store brand X are reliable/trustworthy
Qal 3 The products of store brand X give me the result I am looking for
SB loyalty Yoo et al. (2000)
Loy1 I consider myself a consumer loyal to store brand X’s products Loy2 I will keep on buying store brand X.
SB purchase intention Netemeyer et al. (2004)
PInt1 I would buy store brand X. PInt2 I am likely to buy store brand X.
Table 2.
Factor loadings of latent variables and indicators of internal consistency and reliability
Constructs Items Cronbach
Alpha
WITH a manufacturer signature NO manufacturer signature
Lambda CR AVE Lambda CR AVE
Store commercial image
CoIm1
CoIm2 0.746
0.615
0.872 0.695 0.549
0.643
0.839 0.687 0.528
Store social image
SoIm1
SoIm2 0.622 0.638
0.667 0.573 0.511
0.619
0.550 0.517 0.503
SB image Aso1
Aso2 0.698
0.740
0.832 0.765 0.620
0.679
0.855 0.716 0.581
SB perceived quality
Qal1 Qal2 Qal3
0.870
0.813 0.874 0.831
0.878 0.706
0.833 0.858 0.712
0.844 0.645
SB loyalty Loy1
Loy2 0.861
0.918
0.881 0.895 0.809
0.849
0.788 0.803 0.671
SB purchase Intention
PInt1
PInt2 0.925
0.936
0.947 0.936 0.886
0.842
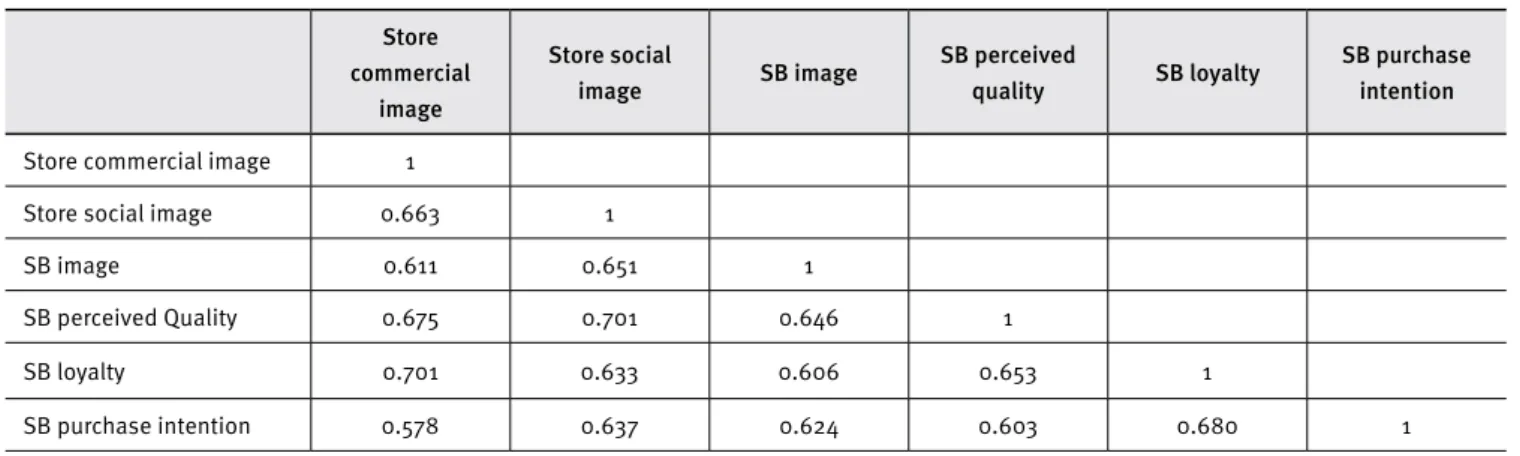
Finally, the discriminant validity of the scale was examined for all possible paired combinations of constructs. Correlation coeicients were calculated both for store brands with a manufacturer signature (Table 3) and store brands without it (Table 4), with strength ranging from low (0.245) to high (0.701), and signiicant at the 0.05 level. Each latent variable’s AVE was larger than the squared correlation between each pair of latent variables, thus demonstrating the good discriminant validity of the scale (Fornell & Larcker, 1981).
Table 3.
Correlations between constructs for store brands with a manufacturer identiication
Store commercial
image
Store social
image SB image
SB perceived
quality SB loyalty
SB purchase intention
Store commercial image 1
Store social image 0.663 1
SB image 0.611 0.651 1
SB perceived Quality 0.675 0.701 0.646 1
SB loyalty 0.701 0.633 0.606 0.653 1
SB purchase intention 0.578 0.637 0.624 0.603 0.680 1
Table 4.
Correlations between constructs for store brands with no manufacturer identiication
Store commercial
image
Store social
image SB image
SB perceived
quality SB loyalty
SB purchase intention
Store commercial image 1
Store social image 0.647 1
SB image 0.460 0.651 1
SB perceived Quality 0.611 0.588 0.705 1
SB loyalty 0.473 0.535 0.632 0.610 1
SB purchase intention 0.254 0.370 0.621 0.470 0.695 1
To test the models’ similarity across both groups – store brands with a manufacturer signature and store brands with no manufacturer signature – we conducted multi-group measurement invariance models: conigural invariance and metric invariance
(Steenkamp & Baumgartner, 1998). The metric invariance test provides support to the similar use of rating scales with respondents across both groups, so the diferences between values can be compared directly. Consequently, by comparing a restricted multiple group model with an unrestricted one, metric invariance assesses the extent to which factor loading estimates are equivalent across groups. The logic is the following: if a set of constraints is applied to a model and model it does not show a signiicant increase (meaning worse it from a less constrained
model), then the constraints can be accepted (Hair, Anderson,
Tatham, & Black, 1998). Following Satorra and Bentler (2001), both models were compared with a Chi-square diference test. Firstly, we calculated a non-restricted model in which the factor loadings of the six constructs were relaxed to vary across the two groups – i.e., store brands with a manufacturer signature and store brands without it; then, the equality of factor loadings between the two groups was assessed – the full-metric invariance
model (Steenkamp & Baumgartner, 1998). The non-restricted
model for all dimensions yielded a good it to data (Χ2 = 250.086,
df = 110, p < 0.001, RMSEA = 0.051, CFI = 0.961, and TLI = 0.944). Conigural invariance was supported, since satisfactory levels of it for the comparative it index (CFI) and Tucker-Lewis index (TLI), and root mean square error of approximation (RMSEA) were achieved
estimated by constraining factor loadings to be equal across both groups. The results of a Chi-square diference test between the non-restricted model and the full-metric invariance model for each construct showed that full metric invariance was supported for
both groups (Χ2 = 273.016, df = 117, p < 0.001, RMSEA = 0.051, CFI
= 0.958, and TLI = 0.944), although we found a decrease in model
it. Following Hair et al. (1998), if imposing this constraint does
not signiicantly increase model it – CFI decreased from 0.961 to 0.958 – then measurement model invariance can be assumed. Therefore, our indings provide strong evidence to support full
metric invariance (Steenkamp & Baumgartner, 1998). In addition,
evidence of a good model it, reliability, convergent validity, and discriminant validity indicates that the measurement model was appropriate to test the structural model.
Analysis of the structural model
Structural equation modeling was conducted to assess the statistical signiicance of the relationships we propose to exist between store brand purchase intention and its dimensions (Figure
1). Model it criteria suggested by Hu and Bentler (1995) were used
for both measurement and structural model: X2 / df, goodness of
it (GFI), adjusted goodness of it (AGFI), comparative it index (CFI), root mean square residual (RMR), and root mean square error of
approximation (RMSEA). Acceptable models should have X2 / df ≤
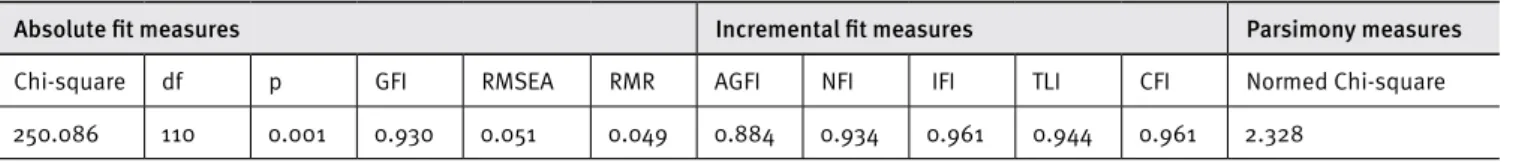
3, AGFI ≥ 0.80, RMR ≤ 0.1, RMSEA ≤ 1.0, and GFI and CFI higher than 0.90. All of the obtained it measures indicated that the structural
model was acceptable (X2/ df = 1.677; p < 0.000): RMSEA = 0.043;
RMR = 0.061; GFI = 0.898; AGFI = 0.855; CFI = 0.957) (Table 5).
Table 5.
Structural modeling adjustment indexes
Absolute it measures Incremental it measures Parsimony measures
Chi-square df p GFI RMSEA RMR AGFI NFI IFI TLI CFI Normed Chi-square
250.086 110 0.001 0.930 0.051 0.049 0.884 0.934 0.961 0.944 0.961 2.328
Analysis of the diferences between the two
types of store brands
The present study conducts a multi-group analysis to examine the diferences between store brands with a manufacturer signature and store brands with no manufacturer signature. Group comparisons were made between store brands with manufacturer identiication and store brands with no information regarding the manufacturer subsamples, using structural equation modeling.
Comparing the standardized coeicients obtained, the following results should be highlighted (Table 6). The results obtained report diferent results for both types of store brands. Firstly, we found that the variable with highest impact on consumers’ purchase intention was store brand loyalty for
brands with a manufacturer signature (β56 = 0.539**) and store
brand image for brands without a manufacturer identiication
(β36N = 0.492**). Secondly, in terms of efect size, the variables
that seem to contribute most to store brand purchase intention for brands with a manufacturer signature are store brand loyalty
(β56 = 0.539**), followed by store social image (β
26 = 0.537
**), store
brand perceived quality (β46 = 0.491**), and store commercial
image (β16 = 0.239**). However, store brand loyalty showed no
statistical signiicance on purchase intention (β45 = 0.105ns), as
this relationship was in the expected direction, but failed to reach statistical signiicance. Finally, the evaluation of store brands
without a manufacturer identiication showed that the variable with highest inluence on purchase intention was store brand
image (β36N = 0.492**), followed by store commercial image (β
16N
= 0.283**), and store social image (β
26N = 0.212
**), whereas no
signiicant evidence was found for the relationship between store
brand perceived quality and purchase intention (β46N = 0.076ns).
On the other hand, with regard to the antecedents of store brand purchase intention, it should be noted that all relationships
of store commercial image with store brand image (β13 = 0.326**;
β13N = 0.312*) and store brand perceived quality (β
14 = 0.632
**;
β14N = 0.457**) are signiicantly positive for both types of store
brand, showing a higher impact of store commercial image on store brand quality perception. In the same vein, regarding the impact of store social image, our indings highlight a positive signiicant relationship between this variable, store brand image
(β23 = 0.676**; β
23N = 0.848
**), and store brand perceived quality
(β24 = 0.380**; β
24N = 0.483
**) also for both types of store brand.
Thus, it can be airmed that the better and more favorable the store commercial and social image, the better the store brand image and quality perceived. Therefore, consumers rely on both store commercial and social images in order to reduce store brands’ purchase risk, regardless of whether the manufacturer is identiied or not on the product package.
exerts a positive inluence on customer loyalty both for store brands with a manufacturer signature (β35 = 0.688**) and store brands
with no manufacturer identiication (β35N = 0.583**). However, store brand perceived quality shows a positive signiicant inluence
on loyalty for store brands with no manufacturer signature (β45N = 0.215**); while perceived quality showed no statistical signiicance
for store brands with a manufacturer identiication (β45 = 0.105ns). See Table 7.
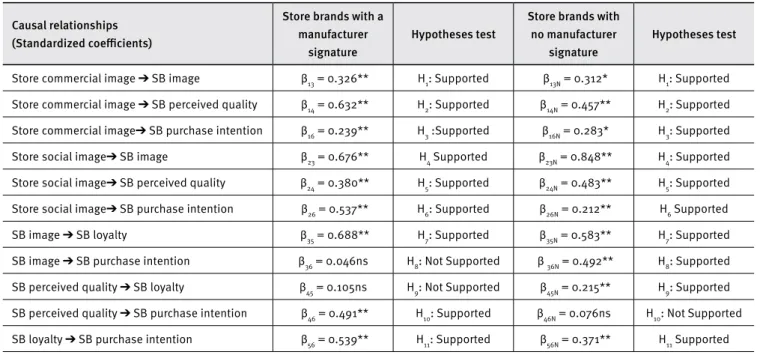
Table 6.
Results of the structural model (standardized coeicients)
Causal relationships (Standardized coeicients)
Store brands with a manufacturer
signature
Hypotheses test
Store brands with no manufacturer
signature
Hypotheses test
Store commercial image ➔ SB image β13 = 0.326** H1: Supported β13N = 0.312* H1: Supported
Store commercial image ➔ SB perceived quality β14 = 0.632** H2: Supported β14N = 0.457** H2: Supported
Store commercial image➔ SB purchase intention β16 = 0.239** H3 :Supported β16N = 0.283* H3: Supported
Store social image➔ SB image β23 = 0.676** H4 Supported β23N = 0.848** H4: Supported
Store social image➔ SB perceived quality β24 = 0.380** H5: Supported β24N = 0.483** H5: Supported
Store social image➔ SB purchase intention β26 = 0.537** H6: Supported β26N = 0.212** H6 Supported
SB image ➔ SB loyalty β35 = 0.688** H7: Supported β35N = 0.583** H7: Supported
SB image ➔ SB purchase intention β36 = 0.046ns H8: Not Supported β 36N = 0.492** H8: Supported
SB perceived quality ➔ SB loyalty β45 = 0.105ns H9: Not Supported β45N = 0.215** H9: Supported
SB perceived quality ➔ SB purchase intention β46 = 0.491** H10: Supported β46N = 0.076ns H10: Not Supported
SB loyalty ➔ SB purchase intention β56 = 0.539** H11: Supported β56N = 0.371** H11 Supported
Note. ns=not signiicant R2
Loyalty = 0.676; R 2
Purchase Intention = 0.701; R 2
SB Image = 0.851; R 2
SB Quality = 0.860; R 2
Loyalty = 0.667; R 2
Purchase Intention = 0.602; R 2
SB Image = 0.823; R 2
SB Quality = 0.808. *signiicant (p < 0.1); ** signiicant (p < 0.05)
The conceptual model proposed showed an adequate general it to the provided data; and the parameters were tested to decide whether or not to accept the study’s proposed hypotheses. With regard to store brands with a manufacturer signature, our results provide strong support for all research
hypotheses, except for H8 and H9, thus not supporting a
signiicant relationship between store brand image and purchase intention. The test of the hypotheses with store brands without a manufacturer signature highlights that ten of the eleven initial hypotheses are supported. More speciically, we found support
for all the study’s proposed hypotheses, except for H10, since our
results did not conirm a signiicant relationship between store brands’ perceived quality and purchase intention. Consequently, store brand loyalty and purchase intention were found to be signiicantly afected by store commercial and social image, store brand image, and perceived quality.
The mediating role of store brand loyalty
Our initial conceptual proposition is that loyalty mediates the efect of store brand image and store brand perceived quality
on purchase intention. Following the procedure suggested by
Baron and Kenny (1986), a mediating role exists when three conditions are satisied. First, the independent variable has a signiicant efect on the mediator; second, the mediator has a signiicant efect on the dependent variable; and third, a previous signiicant relationship between the independent variable and the dependent variable is reduced after including the mediator. Moreover, when the efect of the independent variable is not statistically signiicant, a complete mediation takes place; otherwise, a partial mediation occurs.
As depicted in Table 6, with regard to brands with a manufacturer signature, signiicant relationships are observed
between store brand image and loyalty (β35 = 0.688**), as well
as between loyalty and purchase intention (β56 = 0.539**).
Moreover, no signiicant link exists between store brand
image and purchase intention (β36 = 0.046ns); thus, a complete
mediation efect of store brand loyalty is supported. When analyzing whether loyalty mediates the efect of store brand perceived quality on purchase intention, we observe the lack
of a signiicant efect of store brand quality on loyalty (β46N =
On the other hand, considering the store brands without a manufacturer signature, a significant link is observed
between store brand perceived quality and loyalty (β45N =
0.215**), as well as between loyalty and purchase intention
(β56N = 0.371**); nevertheless, perceived quality does not have
a signiicant inluence on purchase intention (β46N = 0.076ns),
which demonstrates a complete mediation. Finally, we observe
a signiicant inluence of store brand image on loyalty (β35N =
0.583**), along with a statistically signiicant efect of loyalty on
purchase intention (β56N = 0.371**), while the link between store
brand image and purchase intention is reduced after the inclusion
of the mediator (β56N = 0.492**) for brands with no manufacturer
signature. Therefore, according to Baron and Kenny (1986), the
partial mediation of loyalty is supported.
DISCUSSION
There are many articles on store brands, although not many focus on comparing diferent types of store brands and on analyzing the role of the manufacturer identiication on the product package, or the role of the manufacturer signature. The present paper aims to contribute to ill this gap in the literature by analyzing the variables inluencing store brands’ purchasing likelihood and the diferences between store brands with and without a manufacturer identiication. Our indings indicate that the presence of the manufacturer signature or identiication on the store brand is not a determinant variable in the formation of store brand loyalty and purchase intention; consequently, these outcomes show a similar formation pattern for both types of store brand analyzed. That is, store brands with a manufacturer signature and store brands without one have similar sources in the formation of loyalty and purchase intention.
With regard to our main research question: “What are the inluences of store and brand image on customers’ loyalty and purchase intention for store brands with a manufacturer signature and store brands without a manufacturer signature?”. The answer is “store brand image is the main variable inluencing customer loyalty, while store social image and store brand image exert the highest impact on purchase intention both for store brands with a manufacturer signature and brands without a manufacturer identiication”. Consequently, one major inding is that we demonstrate image variables – linked both to store and store brand – to be strong predictors of store brand loyalty and purchase intention. Likewise, we can airm that store brand image is the most important driver for store brand loyalty and purchase intention, for both types of store brand analyzed. Thus, store brand image, and, more speciically, the positive
and favorable associations of a store brand, are critical to a store brand’s success in today’s increasingly competitive marketplace
(Choi & Huddleston, 2013). These results are in line with those of Netemeyer et al. (2004), who demonstrated store image to be a key variable on brands’ purchase intention, and with those of
Bao et al. (2011), who airmed that consumers would be highly conident in the signaling ability of a store’s image. Moreover, our indings show the positive inluence of store commercial image both on store brand image and on store brand perceived quality for both types of brand analyzed, which is in line with
the indings of Beristain and Zorrilla (2011). Therefore, good
store image can help to increase customer loyalty and purchase intention, compensating retailers’ eforts to ofer a positive, favorable store image. A store’s image could thus be reinforced by the launching of marketing activities and programs to enhance consumers’ associations with the store. Our indings highlight that the store can take advantage of the impact of its image in terms of increasing loyalty and purchase intention.
In addition, our indings highlight some diferences between the two types of store brand analyzed. The main diferences are the lack of inluence of store brand perceived quality on loyalty for products with a manufacturer signature, and the lack of inluence of perceived quality on purchase intention for brands without a manufacturer identiication. Consequently, it is worth stressing the low importance of store brands’ perceived quality, as we did not ind a signiicant impact of store brand quality perception on either store brand loyalty or purchase intention. These results are not consistent with previous studies that hold that store brand loyalty was characterized by attitudes elicited from sources such
as perceived quality (Pappu et al., 2005). This may be because,
nowadays, store brands are positioning themselves as a
same-quality alternative to manufacturer brands (Choi & Huddleston,
2013). In addition, store brands now compete on a more equal footing with manufacturer brands in terms of product quality, and
consumers perceive store brand quality to have improved (Grunert
et al., 2006). Moreover, a few relevant diferences between these two types of store brand should be highlighted. One major inding is the slightly higher inluence of store commercial image for store brands with a manufacturer signature, whereas store social image shows a slightly higher inluence for store brands without a manufacturer signature. Therefore, consumers may perceive store brands of retailers with a favorable commercial and social
image as reliable and trustworthy (Ambler, 1997).
types of brand, as consumers similarly perceive and evaluate store brand products regardless of information about the manufacturer. Therefore, despite assumptions that consumers generally perceive a store brand associated with a manufacturer as a guarantee and
a quality ofer (Dubois & Duquesne, 1995), our results do not
support signiicant diferences on the variables inluencing store brand loyalty and purchase intention. We hypothesized that the manufacturer signature would strongly inluence the formation of store brand purchase intention, but this was not the case. One possible explanation would be that consumers rely on store brand image and on store image in their purchase decision process.
Finally, our indings demonstrate that store brand loyalty plays a mediating role between store brand image and purchase intention for store brands with a manufacturer signature; on the other hand, we found a complete mediating efect of loyalty between store brand perceived quality and purchase intention, and a partial one between store brand image and purchase intention for brands without a manufacturer identiication.
Managerial implications
Based on our indings, we propose a few useful insights for retailers. Firstly, our indings recognize that consumers use the store brand image dimension as an important cue, inluencing their loyalty and purchase intention. In order for this image to be efectively transmitted, communication actions conveying proximity to customers, credibility, and innovation should be conducted, as well as store brand image improvement programs. For example, retailers should increase consumers’ exposure to their brands, both inside and out of points of sale. In terms of actions that may be conducted in the store, merchandising actions and a good store brand display should be considered. With regard to out-of-store actions, retailers should strongly invest on advertising. Secondly, and considering the importance of stores’ both social and commercial images, retail managers should create efective advertising campaigns to clearly communicate what the company stands for to its customers. Retailers should actively communicate the quality of their store brands to consumers through in-store information, public relations campaigns, and
advertising (Manzur et al., 2011).
Research limitations
The present study has several limitations that also provide venues for future research. With regard to the study’s main limitation, irstly, it should be noted that it was carried out in Spain with a limited number of store brands. This factor can limit the generalizability of our results to other countries; therefore,
we encourage future research to proceed in this direction by undertaking cross-cultural studies. Secondly, our study has analyzed a number of dimensions proposed in prior literature, which only represent a small part of all dimensions afecting store brand purchase intention. Therefore, other variables included in previous studies should be considered for the conceptual models in future research, such as price consciousness, price perception, purchase perceived risk, and even the product category. In this respect, a few authors have demonstrated that store brand purchase likelihood can depend on the product category
considered (Batra & Sinha, 2000). Therefore, our study focused
on, and conducted its tests in, the context of large retailing in one single country, so caution must be exercised in generalizing from our indings, and further research is necessary to overcome these limitations.
REFERENCES
Aaker, D. A. (1991). Managing brand equity capitalizing on the value of brand name. New York: The Free Press.
Ailawadi, K. L., & Keller, K. L. (2004). Understanding retail branding: Conceptual insights and research priorities. Journal of Retailing, 80(4), 331–342. doi:10.1016/j.jretai.2004.10.008
Ailawadi, K. L., Pauwels, K., & Steenkamp, J.-B. (2008). Private label use and store loyalty. Journal of Marketing, 72(6), 19–30. doi:10.1509/ jmkg.72.6.19
Ambler, T. (1997). How much of brand equity is explained by trust?. Man-agement Decision, 35(4), 283–292. doi:10.1108/00251749710169666 Anderson, J. C., & Gerbing, D. W. (1988). Structural equation modeling
in practice: A review and recommended two-step approach. Psycho-logical Bulletin, 103(3), 411–423. doi:10.1037/0033-2909.103.3.411
Anselmsson, J., Johansson, U., & Persson, N. (2007). Understanding price premium for grocery products: A conceptual model of cus-tomer-based brand equity. Journal of Product & Brand Management, 16(6), 401–414. doi:10.1108/10610420710823762
Bagozzi, R. P., & Yi, Y. (1988). On the evaluation of structural equation models. Journal of the Academy of Marketing Science, 16(1), 74–94. doi:10.1007/bf02723327
Baltas, G. (1997). Determinants of store brand choice: A behavioral analysis. Journal of Product & Brand Management, 6(5), 315–324. doi:10.1108/10610429710179480
Bao, Y., Bao, Y., & Sheng, S. (2011). Motivating purchase of private brands: Efects of store image, product signatureness and, qual-ity variation. Journal of Business Research, 64(2), 220–226. doi:10.1016/j.jbusres.2010.02.007
Bao, Y., Sheng, S., Bao, Y., & Stewart, D. (2011). Assessing quali-ty perception of private labels: Intransient cues and consumer characteristics. Journal of Consumer Marketing, 28(6), 448–458. doi:10.1108/07363761111165967
Batra, R., & Sinha, I. (2000). Consumer-level factors moderating the success of private label brands. Journal of Retailing, 76(2), 175–191. doi:10.1016/s0022-4359(00)00027-0
Beristain, J. J., & Zorrilla, P. (2011). The relationship between store image and store brand equity: A conceptual framework and evidence from hypermarkets. Journal of Retailing and Consumer Services, 18(6), 562–574. doi:10.1016/j.jretconser.2011.08.005
Brown, J. T., & Dacing, P. A. (1997). The company and the product: Corpo-rate associations and consumer product responses. Journal of Mar-keting, 61(1), 68–84.
Choi, L., & Huddleston, P. (2013). The efect of retailer private brands on consumer-based retailer equity: Comparison of named private brands and generic private brands. The International Review of Retail, Distribution and Consumer Research, 24(1), 59-78. doi:10.1080/095 93969.2013.821417
Chowdhury, J., Reardon, J., & Srivastava, R. (1998). Alternative modes of measuring store image: An empirical assessment of structured ver-sus unstructured measures. Journal of Marketing Theory and Practice, 6(2), 72–87.
Collins-Dodd, C., & Lindley, T. (2003). Store brands and retail diferenti-ation: The inluence of store image and store brand attitude on store own brand perceptions. Journal of Retailing and Consumer Services, 10(6), 345–352. doi:10.1016/S0969-6989(02)00054-1
Corstjens, M., & Lal, R. (2000). Building store loyalty through store brands. Journal of Marketing Research, 37(3), 281–291. doi:10.1509/ jmkr.37.3.281.18781
Devlin, D., Birtwistle, G., & Macedo, N. (2003). Food retail positioning strategy: A means-end chain analysis. British Food Journal, 105(9), 653–670. doi:10.1108/00070700310497372
Diallo, M. F. (2012). Efects of store image and store brand price-im-age on store brand purchase intention: Application to an emerging market. Journal of Retailing and Consumer Services, 19(3), 360–367. doi:10.1016/j.jretconser.2012.03.010
Dick, A., & Basu, K. (1994). Customer loyalty: Toward an integrated conceptual framework. Journal of the Academy of Marketing Science, 22(2), 99–113. doi:10.1177/0092070394222001
Doods, W., Monroe, K., & Grewall, D. (1991). Efects on price, brand and store information on buyers’ product evaluations. Journal of Market-ing Research, 28(3), 307–319. doi:10.2307/3172866
Dubois, B., & Duquesne, P. (1995). Essentiel pour comprende la valeur des marques: La force de conviction. Revue Française du Marketing, 2, 23–34.
Fornell, C., & Larcker, D. (1981). Evaluating structural equation models with unobservable variables and measurement error. Journal of Mar-keting Research, 18(1), 30–50.doi:10.2307/3151312
Grewal, D., & Levy, M. (2009). Emerging issues in retailing research. Jour-nal of Retailing, 85(4), 522–526. doi:10.1016/j.jretai.2009.09.007 Grewal, D., Krishnan, R., Baker, J., & Borin, N. (1998). The efect of
store name, brand name and price discounts on consumers’ evalu-ations and purchase intentions. Journal of Retailing, 74(3), 331–352. doi:10.1016/S0022-4359(99)80099-2
Grunert, K., Esbjerg, L., Bech-Larsen, T., Brunsø , K., & Juhl, H. J., (2006). Consumer preferences for retailer brand architectures: results from a conjoint study, International Journal of Retail & Distribution Manage-ment, 34 (8) 597 – 608.
Hair, J. F., Anderson, R. E., Tatham, R. L., & Black, W. C. (1998). Multivar-iate data analysis. Saddle River, NJ: Prentice-Hall.
Hair, J. F., Anderson, R. E., Tatham, R. L., & Black, W. C (1999). Analisis multivariante. Madrid: Prentice Hall.
Handelman, J., & Arnold. S. (1999). The role of marketing actions with a social dimension: Appeals to the institutional environment. Journal of Marketing, 63(3), 33–48. doi:10.2307/1251774
Hartman, K. B., & Spiro, R. L. (2005). Recapturing store image in custom-er-based store equity: A construct conceptualization. Journal of Busi-ness Research, 58(8), 1112–1120. doi:10.1016/j.jbusres.2004.01.008 Higgins, R. B., & Bannister, D. (1992). How corporate commnications
of strategy afects share price. Long Range Planning, 25(3), 27–35. doi:10.1016/0024-6301(92)90366-a
Hoch, S. J., & Banerji, S. (1993, Summer). When do private labels suc-ceed?. Sloan Management Review. Retrieved from http://sloanre-view.mit.edu/article/when-do-private-labels-succeed/
Hu, L., & Bentler, P. M. (1995). Evaluating model it. In R. H. Hoyle. (Ed.),
Structural Equation Modeling: Concepts, Issues And Applications. Thousand Oaks, CA: Sage.
Huang, Y., & Huddleston, P. (2009). Retailer premium own-brands: Creating customer loyalty through own-brand products advantage.
International Journal of Retail and Distribution Management, 37(11), 975–992. doi:10.1108/09590550910999389
Inman, J. J., Shankar, V., & Ferraro, R. (2004). The roles of channel-cate-gory associations and geodemographics in channel patronage. Jour-nal of Marketing, 68(2),, 51–71.
Jacoby, J. (1971). A model of multi-brand loyalty. Journal of Advertising Research, 11, 25–31.
Jin B., & Suh Y. G. (2005). Integrating efect of consumer percep-tion factors in predicting private brand purchase in a Korean dis-count store context. Journal of Consumer Marketing, 22(2), 62-71. doi:10.1108/07363760510589226
Kantar World Panel. (2012). Worldpanel Distribución. Retrieved from http://www.kantarworldpanel.com
Karry, S., & Zaccour, G. (2006). Could co-up advertising be a manufac-turer’s counterstrategy to store brands?. Journal of Business Research, 59(9), 1008–1015. doi:10.1016/j.jbusres.2006.05.002
Keller, K. L., & Aaker, D. A. (1992). The efects of sequential introduction of brand extensions. Journal of Marketing Research, 29(1), 35–50. doi:10.2307/3172491
Kumar, N., & Steenkamp, J-B. (2007). Private label strategy: How to meet the store brand challenge, Harvard Business Press
Liljander, V., Polsa, P., & Riel, A. Van (2009). Modelling consumer responses to an apparel store brand: Store image as a risk reduc-er. Journal of Retailing and Consumer Services, 16(4), 281–290. doi:10.1016/j.jretconser.2009.02.005
Manzur, E., Olavarrieta, S., Hidalgo, P., Farías, P., & Uribe, R. (2011). Store brand and national brand promotion attitudes antecedents.
Journal of Business Research, 64(3), 286–291. doi:10.1016/j.jbus-res.2009.11.014
Martos-Partal, M., & González-Benito, O. (2011). Store brand and store loyalty: The moderating role of store brand positioning. Marketing Letters, 22(3), 297–313. doi:10.1007/s11002-010-9126-x
Netemeyer, R., Krishnan, B., Pullig, C., Wang, G., Yagci, M., Dean, D., … Wirth, F. (2004). Developing and validating measures of facets of customer-based brand equity. Journal of Business Research, 57(2), 209–224.
Oliver, L. (1999). Whence consumer loyalty? Journal of Marketing, 63, 33–44. doi:10.2307/1252099
Pappu, R., Quester, P. G., & Cooksey, R. W. (2005).Consumer-based brand equity: Improving the measurement-empirical evi-dence. Journal of Product & Brand Management, 14(3), 143–154. doi:10.1108/10610420510601012
Richardson, P., Jain, A. K., & Dick, A. S. (1996). Household store brand proneness: A framework. Journal of Retailing, 72(2), 159–185. doi:10.1016/S0022-4359(96)90012-3
Satorra, A., & Bentler, P. M. (2001). A scaled diference chi-square test statistic For moment structure analysis. Psychometrika, 66(4), 507– 514. doi:10.1007/bf02296192
Semejn, J., Riel, A. C. Van, & Ambrosini, A. B. (2004). Consumer eval-uations of store brands: Efects of store image and product attri-butes. Journal of Retailing and Consumer Services, 11(4), 247–258. doi:10.1016/S0969-6989(03)00051-1
Schmidt, K. (1995). The quest for identity: Corporate identity, strategies, methods and examples. London: Casell.
Steenkamp, E. M., & Baumgartner, H. (1998). Assessing measurement invariance in cross-national consumer research. Journal of Consumer Research, 25(1), 78–107. doi:10.1086/209528
Steenkamp, J.-B., & Dekimpe, M. (1997). The increasing power of store brands: Building loyalty and market share. Long Range Planning, 30(6), 917–930. doi:10.1016/s0024-6301(97)00077-0
Steenkamp, E. M., & Trjp, C. M. Van. (1991). The use of LISREL in validat-ing marketvalidat-ing constructs. International Journal of Research in Market-ing, 8(4), 283–299. doi:10.1016/0167-8116(91)90027-5
Sudhir, K., & Talukdar, D. (2004). Does store brand patronage improve store patronage? Review of Industrial Organization, 24(2), 143–160. doi:10.1023/b:reio.0000033353.52208.ba
Turban, D. B., & Greening, D. W. (1996). Corporate social performance and organizational attractiveness to prospective employees. Acade-my of Management Journal, 40(3), 658–672.
Vahie, A., & Paswan, A. (2006). Private label brand image: Its re-lationship with store image and national brand. Internation-al JournInternation-al of Retail & Distribution Management, 34(1), 67–84. doi:10.1108/09590550610642828
Yoo, B., Donthu, N., & Lee, S. (2000). An examination of selected mar-keting mix elements and brand equity. Journal of the Academy of Marketing Science, 28(2), 195–211. doi:10.1177/0092070300282002 Yu, W., & Ramanathan, R. (2012). Retail service quality, corporate image and behavioural intentions: The mediating efects of customer satis-faction. The International Review of Retail, Distribution and Consumer Research, 22(5), 485–505. doi:10.1080/09593969.2012.711250 Zeithaml, V. A. (1988). Consumer perceptions of price, quality and value:
A means-end model and synthesis of evidence. Journal of Marketing, 52(3), 2–22. doi:10.2307/1251446