João BOTELHO(a)
Vanessa MACHADO(a)
Paulo MASCARENHAS(a)
Ricardo ALVES(a)
Maria Alzira CAVACAS(a)
José João MENDES(a)
(a) Instituto Universitário Egas Moniz, Centro
de Investigação Interdisciplinar Egas Moniz, Clinical Research Unit, Almada, Portugal.
Fine-tuning multilevel modeling of risk
factors associated with nonsurgical
periodontal treatment outcome
Abstract: This retrospective study evaluated the influence of known risk factors on nonsurgical periodontal treatment (NSPT) response using a pocket depth fine-tuning multilevel linear model (MLM). Overall, 37 patients (24 males and 13 females) with moderate-to-severe chronic periodontitis underwent NSPT. Follow-up visits at 3, 6, and 12 months included measurements of several clinical periodontal parameters. Data were sourced from a previously reported database. In a total of 1416 initially affected sites (baseline PD ≥ 4 mm) on 536 teeth, probing depth (PD) and clinical attachment loss (CAL) reductions after NSPT were evaluated against known risk factors at 3 hierarchical levels (patient, tooth, and site). For each post-treatment follow-up, the variance component models fitted to evaluate the 3-level variance of PD and CAL decrease revealed that all levels contributed significantly to the overall variance (p < 0.001). Patients who underwent NSPT and were continually monitored had curative results. All 3 hierarchical levels included risk factors influencing the degree of PD and CAL reduction. Specifically, the type of tooth, surfaces involved, and tooth mobility site-level risk factors had the strongest impact on these reductions and were highly relevant for the success of NSPT.
Keywords: Multilevel Analysis; Periodontal Disease; Risk Factors.
Introduction
Periodontitis is an inflammatory disease that progressively destroys tooth-supporting structures and, according to the Global Burden of Disease Study (GBD, 1990–2010), its severe form is the sixth most prevalent disease worldwide, affecting 11% of the overall population.1,2,3,4,5,6 The
complexity of bacterial biofilms, the “silent pattern” of progression, and poor awareness of periodontal health in individuals hinders its treatment and requires a motivated patient and long-term compliance for a successful treatment outcome.5,6,7,8,9,10
Currently, periodontitis treatment approaches consist of nonsurgical (NSPT) and surgical treatments (SPT) that are centered on the patient.11,12,13
Conventional NSPT is the mainstay of periodontitis treatment and is shown to have meaningful results;7,12 however, the presence of residual
pockets may jeopardize tooth survival 14,15, requiring NSPT or SPT.13
The application of multilevel modeling (MLM) to periodontal research was proposed by Albandar and Goldstein16 in an attempt to integrate
Declaration of Interests: The authors certify that they have no commercial or associative interest that represents a conflict of interest in connection with the manuscript.
Corresponding Author: João Botelho
E-mail: jbotelho@egasmoniz.edu.pt
https://doi.org/10.1590/1807-3107bor-2019.vol33.0081
Submitted: August 1, 2018
Accepted for publication: June 6, 2019 Last revision: July 10, 2019
explanatory variables in a hierarchical clustering analysis. Numerous articles have subsequently validated the utility of that analysis, which provides clear insights into periodontal research, from disease onset and progression to risk factors to healing res ponse.17,18,19,20,21,22,23,24,25,26,27,28,29
Aside from the extensive literature on NSPT outcomes,11,12,13 MLM approaches to NSPT upshots
are not as commonly reported, but they have shown that smoking habits, tooth type, use of antibiotics, baseline probing depth (PD), baseline clinical attachment loss (CAL), baseline tooth mobility, and frequency of periodontal maintenance are relevant factors for the success of NSPT.21,23,24,28,29 Notably, this
is the first time an MLM analysis has been applied to a Portuguese periodontitis patient sample to highlight the factors influencing the therapeutic result of NSPT.
Therefore, the present retrospective study used pocket depth fine-tuning MLM to evaluate the influence of defined risk factors that may affect NSPT for moderate-to-severe chronic periodontitis (CP) in Portuguese patients. This study hypothesized that PD and CAL reduction are affected by patient, tooth, and site-level factors after NSPT, including age, sex, body mass index (BMI), educational background, smoking, tooth type, specific baseline clinical parameters, and tooth surface location.
Methodology
Ethical considerations
The data analyzed in this study were sourced from a previously reported database30 on the effect
of risk factors in a Portuguese cohort. Our study was approved by the Egas Moniz Ethics Committee (IRB approval number: 595), and informed consent was obtained from all subjects. All data were recorded in a database specifically created for this purpose, where a code number was assigned to each participant. Periodontal intervention was performed according to the approved guidelines and regulations of this retrospective cohort study.
Patient selection
Of the 405 initial patients, a total of 37 were evaluated in our 12-month retrospective clinical study (Figure 1). The patients were referred to the Department of Periodontology at the Egas Moniz Dental Clinic, Almada (Portugal) between 2015 and 2017. All patients had moderate-to-severe periodontitis according to Page and Eke case definitions (2012). Inclusion criteria were: a) patients aged 35 to 60 years with no previous periodontal or orthodontic treatment; b) at least 6 standing teeth (excluding third molars); and c) no serious mental illness or cognitive dysfunction. Exclusion criteria were: a) patients who did not consent to NSPT or regular follow-up visits; b) a history of systemic antibiotic or periodontal treatment in the previous 3 months; c) pregnant or lactating females; and d) failure to follow up. All eligible participants had previously completed an in-person oral survey.
Clinical procedures
The questionnaire included general information including sex (male/female), age, educational level (elementary/middle/higher), and smoking
Figure. Flowchart of the included patients and reasons for exclusion. 405 periodontal
patients
37 included patients
Reasons (n= 368):
• Under 35 or over 60-years-old (n=168) • Less than 6 standing teeth (n=4) • Failed the follow-up visits (n=199)
history. Height of the patients was measured in centimeters, using a vertically installed hard ruler secured to a stable base. Weight was evaluated in kilograms using mechanical scales. BMI was calculated as the ratio of the individual’s body weight to their height squared. Self-reported hypertension and diabetes were extracted from the medical questionnaire. All patients received the periodontal diagnosis, NSPT, and follow-up, including oral hygiene instruction on brushing and interdental cleaning, and regular follow-up visits at 3, 6, and 12 months. NSPT was performed by undergraduate students under the supervision of a periodontist, according to the protocol of 31 an
average of 4 sessions. Data were collected at baseline and at 3-, 6-, and 12-month follow-up after NSPT. Before the periodontal evaluation, the number of missing teeth was recorded (excluding third molars), and the plaque index (PI) was assessed via the plaque control record (PCR)32 in 6 sites
(mesiobuccal, mid-buccal, distobuccal, mesiolingual, mid-lingual, and distolingual). PD, bleeding on probing (BOP), and CAL were determined at the same 6 sites per tooth at baseline and follow-up visits using a manual periodontal probe (CP-12 SE Hu-Friedy, Chicago, USA). Circumferentially, PD was defined as the distance from the cementoenamel junction (CEJ) to the bottom of the pocket and recession (REC) as the distance from the CEJ to the free gingival margin, and this assessment was assigned a negative value if the gingival margin was coronal to the CEJ. CAL was calculated as the algebraic sum of PD and REC. The presence of furcation involvement (FI) was evaluated using a Nabers probe (2N Hu-Friedy) 33, after examining
the molars and upper first premolars and tooth mobility 34. All of the periodontal parameters
mentioned above were repeated at each follow-up visit. Teeth extracted during the follow-up period were excluded from the multilevel analysis.
MLM variable assignment
At the patient level, age; BMI; number of missing teeth; and percentage of sites with plaque index, BOP, and PD ≥ 5 mm at baseline were used as continuous variables, and sex (female = 0, male = 1), smoking
habit (yes = 2, former smoker = 1, no = 0), diabetes (yes = 1, no = 0), and hypertension (yes = 1, no = 0) were used as categorical variables. At the tooth level, tooth position (anterior = 1; premolar = 2; molar = 3), mobility (physiologic mobility < 0.2 = 0; mobility ≤ 1 mm = 1; 1 mm < mobility ≤ 2 mm = 2; and mobility > 2 mm = 3) and FI (no involvement = 0; degree I = 1; degree II = 2; degree III = 3) were used as categorical variables. At the site level, PD, CAL, plaque index, and BOP values at baseline were used as continuous variables, and interproximal versus mid surfaces (mesiobuccal/distobuccal/mesiolingual/distolingual = 1; mid-buccal/mid-lingual = 2) and buccal versus lingual surfaces (mesiobuccal/mid-buccal/distobuccal = 1; mesiolingual/mid-lingual/distolingual = 2) were used as categorical variables.
Statistical analysis
All statistical analyses were performed using IBM SPSS Statistics software, Version 24 (IBM Corp, Armonk, USA). Data were filtered to select only treated sites (baseline PD ≥ 4 mm). Means were reported with standard deviation (SD): mean (± SD). After analyzing the descriptive statistics, we confirmed the hierarchical structure of periodontal disease measurements by performing 3-level (tooth site, tooth, and patient) variance component modeling for both PD and CAL healing response to treatment. Because the site-level treatment response was not truly independent, we tested the data for other MLM assumptions and continued with the MLM analysis once they were met16,28,29
(Table 1). This type of analysis weighs the influence of multilevel nested factors on the reduction of PD and CAL after NSPT. To prevent over-fitness, MLM was reduced from redundant variables through backward stepwise analysis (p > 0.1, cutoff for removal). In addition, the treatment outcome at the 3-, 6-, and 12-month follow-up visits was compared via nested, repeated-measures ANOVA using the Greenhouse-Geisser correction. When differences were identified, post-hoc pairwise multiple comparison tests were conducted using the conventional 5% statistical significance via modified Bonferroni adjustment.
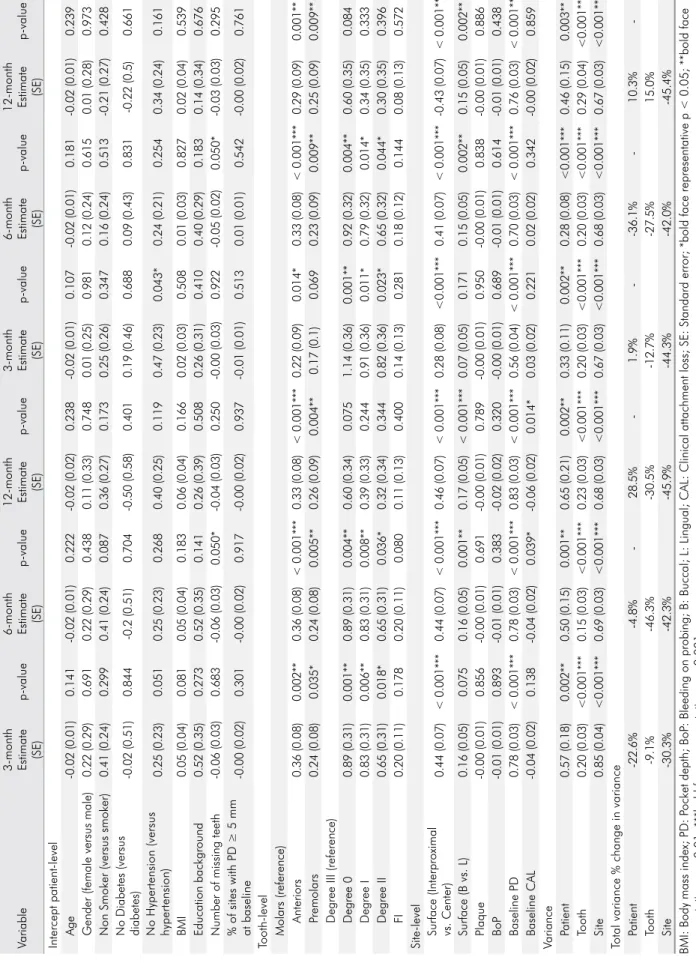
Table 1.
F
ixed intercept models for reduction in PD and CAL
.
Variable
3-month Estimate (SE)
p-value
6-month Estimate (SE)
p-value
12-month Estimate
(SE)
p-value
3-month Estimate (SE)
p-value
6-month Estimate (SE)
p-value 12-month Estimate (SE) p-value Intercept patient -level Age -0.02 (0.01) 0.141 -0.02 (0.01) 0.222 -0.02 (0.02) 0.238 -0.02 (0.01) 0.107 -0.02 (0.01) 0.181 -0.02 (0.01) 0.239
Gender (female versus male)
0.22 (0.29) 0.691 0.22 (0.29) 0.438 0.11 (0.33) 0.748 0.01 (0.25) 0.981 0.12 (0.24) 0.615 0.01 (0.28) 0.973
Non Smoker (versus smoker)
0.41 (0.24) 0.299 0.41 (0.24) 0.087 0.36 (0.27) 0.173 0.25 (0.26) 0.347 0.16 (0.24) 0.513 -0.21 (0.27) 0.428
No Diabetes (versus diabetes)
-0.02 (0.51) 0.844 -0.2 (0.51) 0.704 -0.50 (0.58) 0.401 0.19 (0.46) 0.688 0.09 (0.43) 0.831 -0.22 (0.5) 0.661
No Hypertension (versus hypertension)
0.25 (0.23) 0.051 0.25 (0.23) 0.268 0.40 (0.25) 0.119 0.47 (0.23) 0.043* 0.24 (0.21) 0.254 0.34 (0.24) 0.161 BMI 0.05 (0.04) 0.081 0.05 (0.04) 0.183 0.06 (0.04) 0.166 0.02 (0.03) 0.508 0.01 (0.03) 0.827 0.02 (0.04) 0.539 Education background 0.52 (0.35) 0.273 0.52 (0.35) 0.141 0.26 (0.39) 0.508 0.26 (0.31) 0.410 0.40 (0.29) 0.183 0.14 (0.34) 0.676
Number of missing teeth
-0.06 (0.03) 0.683 -0.06 (0.03) 0.050* -0.04 (0.03) 0.250 -0.00 (0.03) 0.922 -0.05 (0.02) 0.050* -0.03 (0.03) 0.295
% of sites with PD ≥ 5 mm at baseline
-0.00 (0.02) 0.301 -0.00 (0.02) 0.917 -0.00 (0.02) 0.937 -0.01 (0.01) 0.513 0.01 (0.01) 0.542 -0.00 (0.02) 0.761
Tooth-level Molars (reference)
Anteriors 0.36 (0.08) 0.002** 0.36 (0.08) < 0.001*** 0.33 (0.08) < 0.001*** 0.22 (0.09) 0.014* 0.33 (0.08) < 0.001*** 0.29 (0.09) 0.001** Premolars 0.24 (0.08) 0.035* 0.24 (0.08) 0.005** 0.26 (0.09) 0.004** 0.17 (0.1) 0.069 0.23 (0.09) 0.009** 0.25 (0.09) 0.009**
Degree III (reference) Degree 0
0.89 (0.31) 0.001** 0.89 (0.31) 0.004** 0.60 (0.34) 0.075 1.14 (0.36) 0.001** 0.92 (0.32) 0.004** 0.60 (0.35) 0.084 Degree I 0.83 (0.31) 0.006** 0.83 (0.31) 0.008** 0.39 (0.33) 0.244 0.91 (0.36) 0.011* 0.79 (0.32) 0.014* 0.34 (0.35) 0.333 Degree II 0.65 (0.31) 0.018* 0.65 (0.31) 0.036* 0.32 (0.34) 0.344 0.82 (0.36) 0.023* 0.65 (0.32) 0.044* 0.30 (0.35) 0.396 FI 0.20 (0.11) 0.178 0.20 (0.11) 0.080 0.11 (0.13) 0.400 0.14 (0.13) 0.281 0.18 (0.12) 0.144 0.08 (0.13) 0.572 Site
-level Surface (Interproximal vs. Center)
0.44 (0.07) < 0.001*** 0.44 (0.07) < 0.001*** 0.46 (0.07) < 0.001*** 0.28 (0.08) <0.001*** 0.41 (0.07) < 0.001*** -0.43 (0.07) < 0.001*** Surface (B vs. L) 0.16 (0.05) 0.075 0.16 (0.05) 0.001** 0.17 (0.05) < 0.001*** 0.07 (0.05) 0.171 0.15 (0.05) 0.002** 0.15 (0.05) 0.002** Plaque -0.00 (0.01) 0.856 -0.00 (0.01) 0.691 -0.00 (0.01) 0.789 -0.00 (0.01) 0.950 -0.00 (0.01) 0.838 -0.00 (0.01) 0.886 BoP -0.01 (0.01) 0.893 -0.01 (0.01) 0.383 -0.02 (0.02) 0.320 -0.00 (0.01) 0.689 -0.01 (0.01) 0.614 -0.01 (0.01) 0.438 Baseline PD 0.78 (0.03) < 0.001*** 0.78 (0.03) < 0.001*** 0.83 (0.03) < 0.001*** 0.56 (0.04) < 0.001*** 0.70 (0.03) < 0.001*** 0.76 (0.03) < 0.001*** Baseline CAL -0.04 (0.02) 0.138 -0.04 (0.02) 0.039* -0.06 (0.02) 0.014* 0.03 (0.02) 0.221 0.02 (0.02) 0.342 -0.00 (0.02) 0.859 Variance Patient 0.57 (0.18) 0.002** 0.50 (0.15) 0.001** 0.65 (0.21) 0.002** 0.33 (0.11) 0.002** 0.28 (0.08) <0.001*** 0.46 (0.15) 0.003** Tooth 0.20 (0.03) <0.001*** 0.15 (0.03) <0.001*** 0.23 (0.03) <0.001*** 0.20 (0.03) <0.001*** 0.20 (0.03) <0.001*** 0.29 (0.04) <0.001*** Site 0.85 (0.04) <0.001*** 0.69 (0.03) <0.001*** 0.68 (0.03) <0.001*** 0.67 (0.03) <0.001*** 0.68 (0.03) <0.001*** 0.67 (0.03) <0.001***
Total variance % change in variance Patient
-22.6% -4.8% -28.5% -1.9% --36.1% -10.3% -Tooth -9.1% -46.3% -30.5% -12.7% -27.5% 15.0% Site -30.3% -42.3% -45.9% -44.3% -42.0% -45.4%
BMI: Body mass index; PD: P
ocket depth; BoP
: Bleeding on probing; B: Buccal; L
: Lingual; CAL
: Clinical attachment loss; SE
: Standard error; *bold face representative p
< 0.05; **bold face
representative p
< 0.01; ***bold face representative p
Results
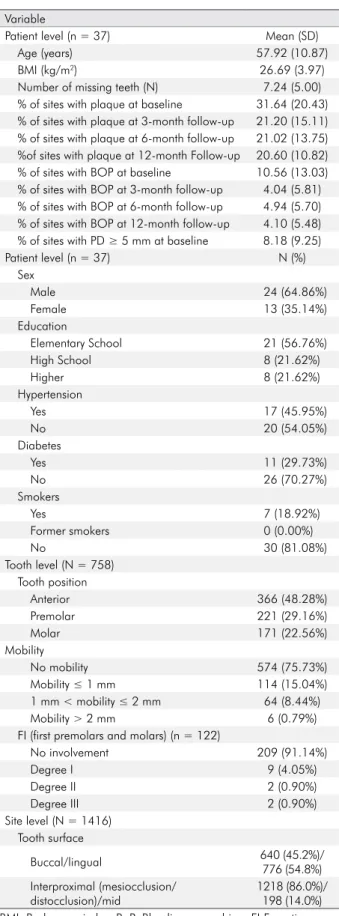
This clinical study investigated a total of 37 patients. The baseline clinical and periodontal parameters are shown in Table 2. The mean age was 57.92 ± 10.87 years (range 36–75), and the sample had a higher prevalence of male patients (64.86%). Only 7 patients were smokers. The mean BMI was 26.69 (± 3.97 kg/m2). When assessing socioeconomic status,
we identified 13 patients with a monthly income up to 580€ (national minimum wage), 11 earning 581€–900€, and 13 earning more than 900€. Most of the individuals had a high school education or below (78.38%). The patients had an average of 7.24 (± 5.00) missing teeth. Diabetes was reported in 11 (29.73%) and hypertension in 17 patients (45.95%). The overall sample included 758 teeth, including 366 anterior teeth, 221 premolars, and 171 molars, of which 574 had physiologic mobility, 114 had grade 1 mobility, 64 had grade 2 mobility, and 6 had grade 3 mobility. At baseline, plaque was noted at 31.64% ± 20.43% of the sites. At baseline, the mean percentage of sites with BOP was 10.56 ± 13.03 and that with PD ≥ 5 mm was 8.18 ± 9.25.
In response to NSPT, full-mouth mean PD and CAL showed significant reductions from baseline at the 3-, 6-, and 12-month follow-up visits. The mean PD was 4.89 mm (± 1.19) at baseline, 3.61 mm (± 1.32) at 3 months, 3.14 mm (± 1.20) at 6 months, and 3.16 mm (± 1.21) at 12 months. The mean CAL was 5.84 mm (± 2.05) at baseline, 4.60 mm (± 2.16) at 3 months, 4.13 mm (± 2.13) at 6 months, and 4.14 mm (± 2.09) at 12 months.
The mean proportion of sites with plaque was 31.64 (± 20.43) at baseline, 21.20 (± 15.11) at 3 months, 21.02 (± 13.75) at 6 months, and 20.60 (± 10.82) at 12 months. The mean percentage of sites with BOP was 10.56 (± 13.03) at baseline, 4.04 (± 5.81) at 3 months, 4.94 (± 5.70) at 6 months, and 4.10 (± 5.48) at 12 months (Table 2).
Multilevel statistical analysis
To assess the amount of variance associated with PD and CAL reduction assigned in each studied level, we started the MLM analysis by fitting a variance component model (Table 3). This model exhibited
an unbalanced, though significant (p < 0.001), distribution of variance across all 3 levels, with the major proportion due to within-tooth (site) variations. In addition, the mean marginal products for PD and CAL reduction were all significantly positive throughout the follow-up visits, increasing within the follow-up time period. Although the model results indicated major improvements in the first 3 months after treatment, a smaller but still significant improvement was also demonstrated in the following 3-month period until the 6-month checkup.
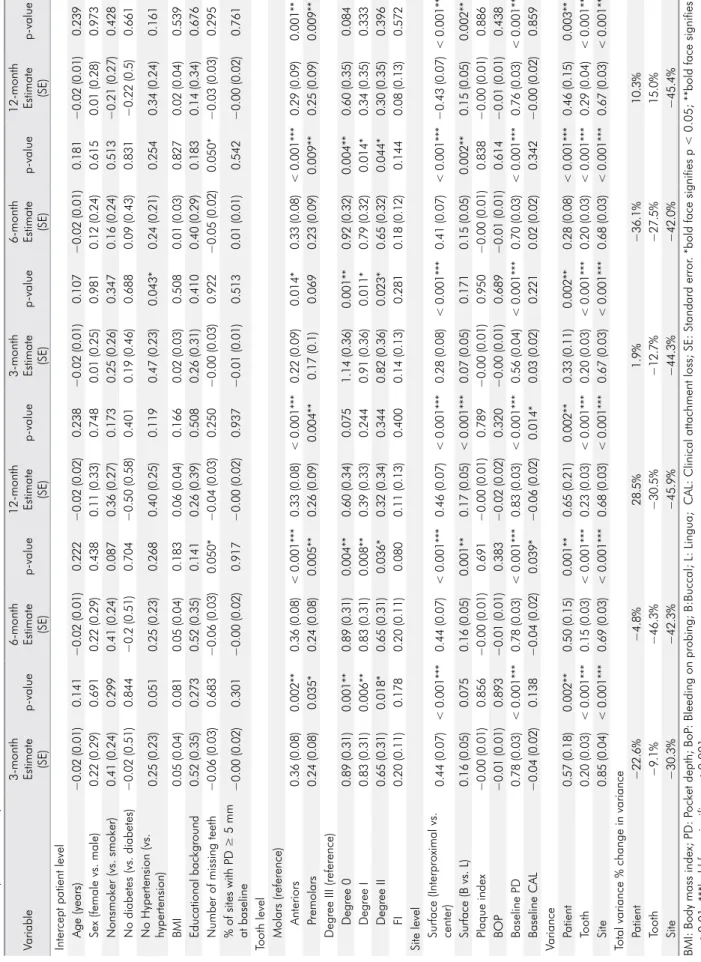
Next, we fitted MLM including all of our selected risk factors for PD and CAL reductions (Table 1). In this crude model, the continuous variables with significant positive coefficients were associated with recovery, while those with significant negative coefficients represented an unfavorable prognosis. Conversely, the categorical variable coefficients were relative to the reference category, with positive values signifying a better prognosis compared to the reference and negative values representing a worse prognosis. To prevent over-fitness, these models were reduced through backward stepwise analysis (p < 0.10 to remain in the model), and the final model variables and associated coefficients are shown in Table 4.
The relationship of the risk factors and PD on healing response
Overall, 1416 sites with baseline PD ≥ 4 mm (31.13% of all sites) from 536 teeth of 37 patients were assessed in this study (Table 4). The mean PD reductions from baseline at 3, 6, and 12 months were 1.29 mm (± 1.38), 1.75 mm (± 1.46), and 1.74 mm (± 1.49), respectively.
The selected site-level risk factor variables demonstrated 30.3%, 42.3%, and 45.9% of the total PD variance reduction at 3, 6, and 12 months. The mid surfaces showed the best prognosis in the reduction of PD at all follow-up visits (p < 0.001). Compared to the lingual tooth surfaces, the buccal surfaces had a significantly higher reduction in PD at 6 and 12 months (p < 0.01).
The selected tooth-level risk factor variables reduced the unexplained total variance of PD reduction at this intermediate level by 4.6%, 39.3%, and 24.5%, at 3, 6, and 12 months, respectively. Tooth mobility
demonstrated a higher reduction in PD at 3 and 6 months (p < 0.01). In addition, the anterior teeth and premolars showed a significant decrease in PD at 3, 6, and 12 months (p < 0.01).
The unexplained variance in PD reduction at the patient level decreased 19.3%, 29.5%, and 13.0% at 3, 6, and 12 months, respectively, after including the selected patient-level risk factor variables in MLM. Conversely, the number of missing teeth negatively influenced the decrease in PD at 6 months (p = 0.024).
A significant difference in PD reduction from baseline was noted between the first follow-up (3 months) and both the second and third follow-ups (6 and 12 months), but not between the second and third follow-ups, even when adjusting for patient and tooth effects.
The relationship of the risk factors and CAL on healing response
This analysis included the same 1416 sites used in the other analyses (Table 4). Compared with baseline, mean CAL reductions were 1.24 mm (± 1.34), 1.71 mm (± 1.43), and 1.70 mm (± 1.46) at 3, 6, and 12 months, respectively.
At the site level, an unexplained variance decrease of 30.1%, 42.0%, and 46.2% in CAL reduction was found at 3, 6, and 12 months after including the selected risk factors of the fixed-effects variables to MLM. The mid surfaces of the teeth demonstrated a significantly greater reduction in CAL at 3, 6, and 12 months (p < 0.001). The buccal surfaces showed a significantly greater reduction at 6 and 12 months (p < 0.01) compared to the lingual surfaces. Baseline PD was significant for CAL recovery at all follow-up visits (p < 0.001).
The tooth level variables reduced 27.5% and 15.0% of the unexplained variance regarding CAL reduction at 6 and 12 months. Teeth with mobility had greater CAL reduction at 3 and 6 months (p < 0.01). Anterior teeth showed a significantly greater reduction at all follow-up visits, whereas premolars only revealed significant improvement at 6 and 12 months (p < 0.01).
The unexplained variance in CAL reduction at the patient level was reduced by 19.8%, 36.1%, and 23.3%
Table 2. Baseline clinical and periodontal parameters by variables
Variable
Patient level (n = 37) Mean (SD)
Age (years) 57.92 (10.87)
BMI (kg/m2) 26.69 (3.97)
Number of missing teeth (N) 7.24 (5.00) % of sites with plaque at baseline 31.64 (20.43) % of sites with plaque at 3-month follow-up 21.20 (15.11) % of sites with plaque at 6-month follow-up 21.02 (13.75) %of sites with plaque at 12-month Follow-up 20.60 (10.82) % of sites with BOP at baseline 10.56 (13.03) % of sites with BOP at 3-month follow-up 4.04 (5.81) % of sites with BOP at 6-month follow-up 4.94 (5.70) % of sites with BOP at 12-month follow-up 4.10 (5.48) % of sites with PD ≥ 5 mm at baseline 8.18 (9.25)
Patient level (n = 37) N (%) Sex Male 24 (64.86%) Female 13 (35.14%) Education Elementary School 21 (56.76%) High School 8 (21.62%) Higher 8 (21.62%) Hypertension Yes 17 (45.95%) No 20 (54.05%) Diabetes Yes 11 (29.73%) No 26 (70.27%) Smokers Yes 7 (18.92%) Former smokers 0 (0.00%) No 30 (81.08%) Tooth level (N = 758) Tooth position Anterior 366 (48.28%) Premolar 221 (29.16%) Molar 171 (22.56%) Mobility No mobility 574 (75.73%) Mobility ≤ 1 mm 114 (15.04%) 1 mm < mobility ≤ 2 mm 64 (8.44%) Mobility > 2 mm 6 (0.79%) FI (first premolars and molars) (n = 122)
No involvement 209 (91.14%) Degree I 9 (4.05%) Degree II 2 (0.90%) Degree III 2 (0.90%) Site level (N = 1416) Tooth surface Buccal/lingual 640 (45.2%)/ 776 (54.8%) Interproximal (mesiocclusion/ distocclusion)/mid 1218 (86.0%)/ 198 (14.0%) BMI: Body mass index; BoP: Bleeding on probing; FI:Furcation involvement; PD: Pocket depth; REC: Recession.
at 3, 6, and 12 months, respectively. In addition, mean PD at baseline showed a significant positive effect on CAL reduction at 3, 6, and 12 months (p < 0.001); however, mean REC at baseline was not significant. The number of missing teeth significantly affected CAL reduction at 6 months (p = 0.034).
Discussion
The results of this retrospective study are consistent with previous studies and show that discounting any level may lead to inaccurate conclusions.19,20,29
The variance component models were used to weigh and compare the risk factors of moderate-to-severe periodontitis after NSPT.
Since it was proposed for use in periodontology research,16 multilevel analysis has been used to
investigate the risk factors of periodontitis onset17,19,20,25,27
and the effect of risk factors in NSPTs and SPTs21,23,24,28,29
as well as predict bone and tooth loss in maintained periodontal patients.18,22,26 Though we assume that all
sites in periodontitis-onset risk studies are potentially susceptible, we should focus only on the treated sites in periodontitis treatment studies, to avoid misleading or skewing the results using the combination of initial pathological and non-pathological pocket depth locations. Furthermore, Jiao et al.28 evaluated
the NSPT outcomes of all sites against those sites with baseline PD ≥ 5 mm and identified significant differences between the sites. Consequently, in the
Table 3. Variance component models for reduction in PD and CAL
Variance Variance components (%) SE p-value Marginal mean values (SE) 3-month reduction in PD *< 0.001 Patient (level 3) 0.465 (24.4%) 0.128 1.14 (0.12) a Tooth (level 2) 0.220 (11.5%) 0.043 Site (level 1) 1.220 (64.0%) 0.054 6-month reduction in PD Patient (level 3) 0.525 (26.3%) 0.139 1.51 (0.13) b Tooth (level 2) 0.280 (14.0%) 0.047 Site (level 1) 1.195 (59.8%) 0.054 12-month reduction in PD Patient (level 3) 0.506 (24.2%) 0.138 1.56 (0.13) b Tooth (level 2) 0.331 (15.8%) 0.052 Site (level 1) 1.257 (60.0%) 0.057
3-month reduction in CAL
*< 0.001
Patient (level 3) 0.324 (18.5%) 0.093
1.10 (0.10) c
Tooth (level 2) 0.229 (13.0%) 0.043
Site (level 1) 1.202 (68.5%) 0.054
6-month reduction in CAL
Patient (level 3) 0.438 (23.2%) 0.117
1.46 (0.12) d
Tooth (level 2) 0.276 (14.6%) 0.046
Site (level 1) 1.172 (62.1%) 0.053
12-month reduction in CAL
Patient (level 3) 0.417 (21.0%) 0.116
1.52 (0.12) d
Tooth (level 2) 0.341 (17.2%) 0.052
Site (level 1) 1.227 (61.8%) 0.055
Table 4.
Adjusted intercept models for reduction in PD and CAL
Variable
3-month Estimate (SE)
p-value
6-month Estimate (SE)
p-value
12-month Estimate
(SE)
p-value
3-month Estimate (SE)
p-value
6-month Estimate (SE)
p-value
12-month Estimate
(SE)
p-value
Intercept patient level Age (years)
−0.02 (0.01) 0.141 −0.02 (0.01) 0.222 −0.02 (0.02) 0.238 −0.02 (0.01) 0.107 −0.02 (0.01) 0.181 −0.02 (0.01) 0.239
Sex (female vs. male)
0.22 (0.29) 0.691 0.22 (0.29) 0.438 0.11 (0.33) 0.748 0.01 (0.25) 0.981 0.12 (0.24) 0.615 0.01 (0.28) 0.973 Nonsmoker (vs. smoker) 0.41 (0.24) 0.299 0.41 (0.24) 0.087 0.36 (0.27) 0.173 0.25 (0.26) 0.347 0.16 (0.24) 0.513 −0.21 (0.27) 0.428 No diabetes (vs. diabetes) −0.02 (0.51) 0.844 −0.2 (0.51) 0.704 −0.50 (0.58) 0.401 0.19 (0.46) 0.688 0.09 (0.43) 0.831 −0.22 (0.5) 0.661 No Hypertension (vs. hypertension) 0.25 (0.23) 0.051 0.25 (0.23) 0.268 0.40 (0.25) 0.119 0.47 (0.23) 0.043* 0.24 (0.21) 0.254 0.34 (0.24) 0.161 BMI 0.05 (0.04) 0.081 0.05 (0.04) 0.183 0.06 (0.04) 0.166 0.02 (0.03) 0.508 0.01 (0.03) 0.827 0.02 (0.04) 0.539 Educational background 0.52 (0.35) 0.273 0.52 (0.35) 0.141 0.26 (0.39) 0.508 0.26 (0.31) 0.410 0.40 (0.29) 0.183 0.14 (0.34) 0.676
Number of missing teeth
−0.06 (0.03) 0.683 −0.06 (0.03) 0.050* −0.04 (0.03) 0.250 −0.00 (0.03) 0.922 −0.05 (0.02) 0.050* −0.03 (0.03) 0.295
% of sites with PD ≥ 5 mm at baseline
−0.00 (0.02) 0.301 −0.00 (0.02) 0.917 −0.00 (0.02) 0.937 −0.01 (0.01) 0.513 0.01 (0.01) 0.542 −0.00 (0.02) 0.761
Tooth level Molars (reference)
Anteriors 0.36 (0.08) 0.002** 0.36 (0.08) < 0.001*** 0.33 (0.08) < 0.001*** 0.22 (0.09) 0.014* 0.33 (0.08) < 0.001*** 0.29 (0.09) 0.001** Premolars 0.24 (0.08) 0.035* 0.24 (0.08) 0.005** 0.26 (0.09) 0.004** 0.17 (0.1) 0.069 0.23 (0.09) 0.009** 0.25 (0.09) 0.009**
Degree III (reference) Degree 0
0.89 (0.31) 0.001** 0.89 (0.31) 0.004** 0.60 (0.34) 0.075 1.14 (0.36) 0.001** 0.92 (0.32) 0.004** 0.60 (0.35) 0.084 Degree I 0.83 (0.31) 0.006** 0.83 (0.31) 0.008** 0.39 (0.33) 0.244 0.91 (0.36) 0.011* 0.79 (0.32) 0.014* 0.34 (0.35) 0.333 Degree II 0.65 (0.31) 0.018* 0.65 (0.31) 0.036* 0.32 (0.34) 0.344 0.82 (0.36) 0.023* 0.65 (0.32) 0.044* 0.30 (0.35) 0.396 FI 0.20 (0.11) 0.178 0.20 (0.11) 0.080 0.11 (0.13) 0.400 0.14 (0.13) 0.281 0.18 (0.12) 0.144 0.08 (0.13) 0.572
Site level Surface (Interproximal vs. center)
0.44 (0.07) < 0.001*** 0.44 (0.07) < 0.001*** 0.46 (0.07) < 0.001*** 0.28 (0.08) < 0.001*** 0.41 (0.07) < 0.001*** −0.43 (0.07) < 0.001*** Surface (B vs. L) 0.16 (0.05) 0.075 0.16 (0.05) 0.001** 0.17 (0.05) < 0.001*** 0.07 (0.05) 0.171 0.15 (0.05) 0.002** 0.15 (0.05) 0.002** Plaque index −0.00 (0.01) 0.856 −0.00 (0.01) 0.691 −0.00 (0.01) 0.789 −0.00 (0.01) 0.950 −0.00 (0.01) 0.838 −0.00 (0.01) 0.886 BOP −0.01 (0.01) 0.893 −0.01 (0.01) 0.383 −0.02 (0.02) 0.320 −0.00 (0.01) 0.689 −0.01 (0.01) 0.614 −0.01 (0.01) 0.438 Baseline PD 0.78 (0.03) < 0.001*** 0.78 (0.03) < 0.001*** 0.83 (0.03) < 0.001*** 0.56 (0.04) < 0.001*** 0.70 (0.03) < 0.001*** 0.76 (0.03) < 0.001*** Baseline CAL −0.04 (0.02) 0.138 −0.04 (0.02) 0.039* −0.06 (0.02) 0.014* 0.03 (0.02) 0.221 0.02 (0.02) 0.342 −0.00 (0.02) 0.859 Variance Patient 0.57 (0.18) 0.002** 0.50 (0.15) 0.001** 0.65 (0.21) 0.002** 0.33 (0.11) 0.002** 0.28 (0.08) < 0.001*** 0.46 (0.15) 0.003** Tooth 0.20 (0.03) < 0.001*** 0.15 (0.03) < 0.001*** 0.23 (0.03) < 0.001*** 0.20 (0.03) < 0.001*** 0.20 (0.03) < 0.001*** 0.29 (0.04) < 0.001*** Site 0.85 (0.04) < 0.001*** 0.69 (0.03) < 0.001*** 0.68 (0.03) < 0.001*** 0.67 (0.03) < 0.001*** 0.68 (0.03) < 0.001*** 0.67 (0.03) < 0.001***
Total variance % change in variance Patient
−22.6% −4.8% 28.5% 1.9% −36.1% 10.3% Tooth −9.1% −46.3% −30.5% −12.7% −27.5% 15.0% Site −30.3% −42.3% −45.9% −44.3% −42.0% −45.4%
BMI: Body mass index; PD: P
ocket depth; BoP
: Bleeding on probing; B:Buccal; L
: Lingua; CAL
: Clinical attachment loss; SE
: Standard error
. *bold face signifies p < 0.05; **bold face signifies
p
< 0.01; ***bold face signifies p
present study, we limited our analyses to baseline unreliable PD (PD ≥ 4 mm).
At the patient level, most of the covariates did not indicate any influence on post-NSPT recovery, namely, age, sex, smoking, self-reported systemic diseases, educational background, and select clinical parameters. Conversely, BMI and number of missing teeth showed uncommon significance. Unlike those in previous studies, these patients demonstrated a decreased tendency for gingival bleeding. Mean baseline BOP was 10.56% and was much lower than in American (26.4%–82.01%), Asian, and European patients.23,24,28,35,36,37,38,39 This is
possibly because all of the patients were referred by a screening department at our clinic. During this triage, patients are educated and instructed on oral hygiene. Therefore, the time between the screening and periodontology appointments could a hypothetically influence reduction of baseline BOP. This decreased tendency may explain why the percentage of BOP did not affect NSPT outcomes as previously reported.23,24,28,29
At the tooth level, a more significant reduction in PD and CAL was seen in the anterior teeth (incisors and canines) compared to the molars during the follow-up period, but this was seen only between the molars and premolars at 6 and 12 months. These results are consistent with previous studies,21,23,28,29,40
although Jiao et al.28 compared molar and non-molar
teeth, while PD reduction was not as significant in the study by Song et al.29 Molars are well known to
have a worse healing prognosis due to anatomical and morphological characteristics such as furcations and dimensions of furcation entrance, root trunk length, bifurcation ridges, root concavities, and cervical enamel projections.12,40,41 Furthermore,
premolars have some characteristics that worsen the prognosis but less so compared to molars.12,40,41
Moreover, initial hypermobility was associated with worse treatment outcomes but only during the first 6 months after NSPT.
At the site level, the mid teeth surfaces showed more reduction in PD and CAL at 3, 6, and 12 months. Compared to the lingual surfaces, the buccal surfaces had a more significant decrease at 6 months, resulting in a significantly higher recovery. As
reported by Song et al.,29 the interproximal surfaces
had less improvement compared to the mid surfaces, with more significant values for PD. However, the buccal surfaces demonstrated more substantial recovery, only at 6 and 12 months, as opposed to the results of Wan et al.,23 which demonstrated a
improvement on the lingual sites. Although the reason for less recovery on the interproximal surfaces can be explained by a marked history of worse interproximal hygiene, the difference between buccal and lingual surfaces is not easy to explain. In the future, additional studies are needed to understand this matter thoroughly. However, baseline PD mainly influenced the efficacy of NSPT during the 3 follow-up periods in a progressive manner, showing that the initial PD may guide the treatment outcome as previously demonstrated.21
A limitation of the present study is its limited sample size, which may lead to unpowered analysis and test results, even though we have identified the same limitation in similar MLM studie.21,23,29 from
p < 0.05 to p < 0.10 and by fitting the model strictly with data from treated sites. The cost of NSPT is expensive and is not reimbursed by most forms of insurance. In addition, the response rate was quite low (9.1%) despite efforts to ensure patient participation, which can be explained by the poor awareness of dental health and lack of follow-up in this population, highlighted recently by our group.30 On the other hand, the retrospective nature
of the study and various clinicians treating and examining participants can increase the probability of consistent failures.
Conclusion
In the present study, pocket depth fine-tuning MLM showed that NSPT had a significant healing effect for moderate-to-severe CP with considerable reductions in PD and CAL. PD and CAL showed major recovery in the first 3 months after NSPT. The PD fine-tuning MLM analysis found that all 3 levels influenced the reduction of PD and CAL levels. The largest effect on PD and CAL reductions was seen at the site level.
1. Pihlstrom BL, Michalowicz BS, Johnson NW. Periodontal diseases. Lancet. 2005 Nov;366(9499):1809-20. https://doi.org/10.1016/S0140-6736(05)67728-8
2. Darveau RP. Periodontitis: a polymicrobial disruption of host homeostasis. Nat Rev Microbiol. 2010 Jul;8(7):481-90. https://doi.org/10.1038/nrmicro2337
3. Kassebaum NJ, Bernabé E, Dahiya M, Bhandari B, Murray CJ, Marcenes W. Global burden of severe periodontitis in 1990-2010: a systematic review and meta-regression. J Dent Res. 2014 Nov;93(11):1045-53. https://doi.org/10.1177/0022034514552491 4. Richards D. Review finds that severe periodontitis affects 11% of the world population. Evid Based Dent. 2014 Sep;15(3):70-1.
https://doi.org/10.1038/sj.ebd.6401037
5. Jin LJ, Lamster IB, Greenspan JS, Pitts NB, Scully C, Warnakulasuriya S. Global burden of oral diseases: emerging concepts, management and interplay with systemic health. Oral Dis. 2016 Oct;22(7):609-19. https://doi.org/10.1111/odi.12428
6. Tonetti MS, Jepsen S, Jin L, Otomo-Corgel J. Impact of the global burden of periodontal diseases on health, nutrition and wellbeing of mankind: A call for global action. J Clin Periodontol. 2017 May;44(5):456-62. https://doi.org/10.1111/jcpe.12732
7. Renvert S, Persson GR. Treatment of periodontal disease in older adults. Periodontol 2000. 2016 Oct;72(1):108-19. https://doi.org/10.1111/prd.12130
8. Arweiler NB, Auschill TM, Sculean A. Patient self-care of periodontal pocket infections. Periodontol 2000. 2018 Feb;76(1):164-79. https://doi.org/10.1111/prd.12152
9. Bosshardt DD. The periodontal pocket: pathogenesis, histopathology and consequences. Periodontol 2000. 2018 Feb;76(1):43-50. https://doi.org/10.1111/prd.12153
10. Donos N. The periodontal pocket. Periodontol 2000. 2018 Feb;76(1):7-15. https://doi.org/10.1111/prd.12203
11. Heitz-Mayfield LJ. How effective is surgical therapy compared with nonsurgical debridement? Periodontol 2000. 2005;37(1):72-87. https://doi.org/10.1111/j.1600-0757.2004.03797.x
12. Heitz-Mayfield LJ, Lang NP. Surgical and nonsurgical periodontal therapy. Learned and unlearned concepts. Periodontol 2000. 2013 Jun;62(1):218-31. https://doi.org/10.1111/prd.12008
13. Graziani F, Karapetsa D, Mardas N, Leow N, Donos N. Surgical treatment of the residual periodontal pocket. Periodontol 2000. 2018 Feb;76(1):150-63. https://doi.org/10.1111/prd.12156
14. Fardal Ø, Johannessen AC, Linden GJ. Tooth loss during maintenance following periodontal treatment in a periodontal practice in Norway. J Clin Periodontol. 2004 Jul;31(7):550-5. https://doi.org/10.1111/j.1600-051X.2004.00519.x
15. Matuliene G, Pjetursson BE, Salvi GE, Schmidlin K, Brägger U, Zwahlen M, et al. Influence of residual pockets on progression of periodontitis and tooth loss: results after 11 years of maintenance. J Clin Periodontol. 2008 Aug;35(8):685-95.
https://doi.org/10.1111/j.1600-051X.2008.01245.x
16. Albandar JM, Goldstein H. Multi-level statistical models in studies of periodontal diseases. J Periodontol. 1992 Aug;63(8):690-5. https://doi.org/10.1902/jop.1992.63.8.690
17. Axtelius B, Söderfeldt B, Attström R. A multilevel analysis of factors affecting pocket probing depth in patients responding differently to periodontal treatment. J Clin Periodontol. 1999 Feb;26(2):67-76. https://doi.org/10.1034/j.1600-051X.1999.260202.x
18. Nieri M, Muzzi L, Cattabriga M, Rotundo R, Cairo F, Pini Prato GP. The prognostic value of several periodontal factors measured as radiographic bone level variation: a 10-year retrospective multilevel analysis of treated and maintained periodontal patients. J Periodontol. 2002 Dec;73(12):1485-93. https://doi.org/10.1902/jop.2002.73.12.1485
19. Tu YK, Gilthorpe MS, Griffiths GS, Maddick IH, Eaton KA, Johnson NW. The application of multilevel modeling in the analysis of longitudinal periodontal data—part I: absolute levels of disease. J Periodontol. 2004 Jan;75(1):127-36. https://doi.org/10.1902/jop.2004.75.1.127
20. Tu YK, Gilthorpe MS, Griffiths GS, Maddick IH. Eaton KA, Johnson NW: The Application of multilevel modeling in the analysis of llongitudinal periodontal data.Part II: changes in disease levels over time. J Periodontol. 2004;75:137. https://doi.org/10.1902/jop.2004.75.1.137
21. Tomasi C, Leyland AH, Wennström JL. Factors influencing the outcome of non-surgical periodontal treatment: a multilevel approach. J Clin Periodontol. 2007 Aug;34(8):682-90. https://doi.org/10.1111/j.1600-051X.2007.01111.x
22. Muzzi L, Nieri M, Cattabriga M, Rotundo R, Cairo F, Pini Prato GP. The potential prognostic value of some periodontal factors for tooth loss: a retrospective multilevel analysis on periodontal patients treated and maintained over 10 years. J Periodontol. 2006 Dec;77(12):2084-9. https://doi.org/10.1902/jop.2006.050227
23. Wan CP, Leung WK, Wong MC, Wong RM, Wan P, Lo EC, et al. Effects of smoking on healing response to non-surgical periodontal therapy: a multilevel modelling analysis. J Clin Periodontol. 2009 Mar;36(3):229-39. https://doi.org/10.1111/j.1600-051X.2008.01371.x
References
24. Mdala I, Haffajee AD, Socransky SS, de Blasio BF, Thoresen M, Olsen I, et al. Multilevel analysis of clinical parameters in chronic periodontitis after root planing/scaling, surgery, and systemic and local antibiotics: 2-year results. J Oral Microbiol. 2012;4(1):17535. https://doi.org/10.3402/jom.v4i0.17535
25. Zeng J, Williams SM, Fletcher DJ, Cameron CM, Broadbent JM, Shearer DM, et al. Reexamining the association between smoking and periodontitis in the dunedin study with an enhanced analytical approach. J Periodontol. 2014 Oct;85(10):1390-7. https://doi.org/10.1902/jop.2014.130577
26. Martinez-Canut P. Predictors of tooth loss due to periodontal disease in patients following long-term periodontal maintenance. J Clin Periodontol. 2015 Dec;42(12):1115-25. https://doi.org/10.1111/jcpe.12475
27. Dalazen CE, De Carli AD, Bomfim RA, Dos Santos ML. Contextual and individual factors influencing periodontal treatment needs by elderly brazilians: A multilevel analysis. PLoS One. 2016 Jun;11(6):e0156231. https://doi.org/10.1371/journal.pone.0156231
28. Jiao J, Shi D, Cao ZQ, Meng HX, Lu RF, Zhang L, et al. Effectiveness of non-surgical periodontal therapy in a large Chinese population with chronic periodontitis. J Clin Periodontol. 2017 Jan;44(1):42-50. https://doi.org/10.1111/jcpe.12637
29. Song J, Zhao H, Pan C, Li C, Liu J, Pan Y. Risk factors of chronic periodontitis on healing response: a multilevel modelling analysis. BMC Med Inform Decis Mak. 2017 Sep;17(1):135. https://doi.org/10.1186/s12911-017-0533-2
30. Machado V, Botelho J, Amaral A, Proença L, Alves R, Rua J, et al. Prevalence and extent of chronic periodontitis and its risk factors in a Portuguese subpopulation: a retrospective cross-sectional study and analysis of Clinical Attachment Loss. PeerJ. 2018 Jul;6:e5258. https://doi.org/10.7717/peerj.5258
31. Lang NP, Lindhe J. Clinical Periodontology and Implant Dentistry. Chichester: John Wiley & Sons; 2015. 32. O’Leary TJ, Drake RB, Naylor JE. The plaque control record. J Periodontol. 1972 Jan;43(1):38.
https://doi.org/10.1902/jop.1972.43.1.38
33. Hamp SE, Nyman S, Lindhe J. Periodontal treatment of multirooted teeth. Results after 5 years. J Clin Periodontol. 1975 Aug;2(3):126-35. https://doi.org/10.1111/j.1600-051X.1975.tb01734.x
34. Lindhe J, Nyman S. The role of occlusion in periodontal disease and the biological rationale for splinting in treatment of periodontitis. Oral Sci Rev. 1977;10:11-43.
35. Sculean A, Schwarz F, Berakdar M, Romanos GE, Brecx M, Willershausen B, et al. Non-surgical periodontal treatment with a new ultrasonic device (Vector-ultrasonic system) or hand instruments a prospective, controlled clinical study. J Clin Periodontol. 2004;31(6):428-33. https://doi.org/10.1111/j.1600-051X.2004.00496.x
36. Trombelli L, Rizzi A, Simonelli A, Scapoli C, Carrieri A, Farina R. Age-related treatment response following non-surgical periodontal therapy. J Clin Periodontol. 2010 Apr;37(4):346-52. https://doi.org/10.1111/j.1600-051X.2010.01541.x
37. Shiloah J, Bland PS, Scarbecz M, Patters MR, Stein SH, Tipton DA. The effect of long-term aspirin intake on the outcome of non-surgical periodontal therapy in smokers: a double-blind, randomized pilot study. J Periodontal Res. 2014 Feb;49(1):102-9. https://doi.org/10.1111/jre.12085
38. Costa FO, Cota LO, Cortelli JR, Cortelli SC, Cyrino RM, Lages EJ, et al. Surgical and non-surgical procedures associated with recurrence of periodontitis in periodontal maintenance therapy: 5-year prospective study. PLoS One. 2015 Oct;10(10):e0140847. https://doi.org/10.1371/journal.pone.0140847
39. Baelum V, López R. Defining and predicting outcomes of non-surgical periodontal treatment: a 1-yr follow-up study. Eur J Oral Sci. 2016 Feb;124(1):33-44. https://doi.org/10.1111/eos.12240
40. Angst PD, Piccinin FB, Oppermann RV, Marcantonio RA, Gomes SC. Response of molars and non-molars to a strict supragingival control in periodontal patients. Braz Oral Res. 2013 Jan-Feb;27(1):55-60. https://doi.org/10.1590/S1806-83242013000100010
41. Matthews DC, Tabesh M. Detection of localized tooth-related factors that predispose to periodontal infections. Periodontol 2000. 2004;34(1):136-50. https://doi.org/10.1046/j.0906-6713.2003.003429.x