Universidade de Évora
O
Impacto
da Rede
Viária
no
Uso
do
Espaço
da Geneta
(Genetto
genetta
1.,
1758)
Dissertação apresentada para obtenção do grau de Mestre em Biologia da Conservação
Ramalho, P ., t9 de Abril de 2008
Autor
Patrícia RamalhoOrientação
Prof. Dr.
Antonio
Mira2009 tEl
/
,-.Ê-*,-Õ--I § !fi
_l
O
lmpacto
da
Rede
Viária
no Uso
do
Espaço
da Geneta
l6enetta
genetta
[.,
1758)
Patrícia Ramalho
Dissertação apresentada para obtenção do grau de Mestre em Biologia da Conservação
Orientação
Prof. Dr. António Mira
Universidade de Évora
Efrm
índice
Nota lntrodutória
Resumo
Abstract
Enquadramento
Artigo científico: Abstract lntroduction
Study Area
Methods
Capture and Radio-tracking
Data analyses
Results
Captures and genets locations
Home ranges and core areas Roads
Habitat Selection
Resting Sites
Discussion
Captures and genets locations
Home ranges and core areas
Roads Habitat Selection Conclusion Acknowledgements References Considerações finais Referencias Bibliográficas Agradecimentos 4 5 5 6
IL
L2 L4 15 15 L6 18 18 2L 23 27 29 29 29 30 31 32 34 35 35 4L 45 51Nota lntrodutória
A
tesede
mestrado seguidamente apresentada encontra-se soba
formade
artigo. Este,destina-se
a
ser publicado numa revista científica cujos temas primordialmente abordados incidam sobrea
conservaçãoda
biodiversidade. O formatode
artigo apresentado não seencontra
em
total
acordo comos
parâmetrosque
normalmente caracterizamum
artigo científico. No seu conjunto, é um artigo extenso que não poderá ser publicado com o formato que apresenta por razões de amostragem, uma vez queo
número de genetas capturadas eefectivamente monitorizadas ao longo do estudo
é
reduzido. Os estudos de telemetria sãonormalmente exaustivos resultando numa grande quantidade de dados,
no
entanto estãodependentes
de
muitos factores externos, comopor
exemploo
sucessode
captura eintensidade de armadilhagem resultante da mão-de-obra disponível. Ainda assim, este estudo
permitiu-nos obter dados reveladores, relativamente ao comportamento das genetas face às
estradas, indicando-nos algumas tendências interessantes
por
parte destes carnívoros que serão posteriormente publicadas-
padrões comportamentais de atracção/repulsa para com asestradas durante a noite e o dia respectivamente, a adopção de uma distância de segurança
média
de
cercade
1km das estradas principais,a
não aleatoriedadeno
usodo
espaço,concentrando-se maioritariamente
num dos
lados
da
estrada
sugerindotalvez
uma desconexão genética entre populações que residam em lados opostos da estrada e ainda oefeito condicionador que estas detêm nos movimentos desta espécie. No entanto se o artigo apresentado para conclusão de tese de mestrado abordasse apenas as tendências por este
estudo apontadas, seria uma tese reduzida, não espelhando todos os dados
e
resultados obtidos ao longo de todo o estudo. Desta forma, a presente dissertação está dividida em três partes: enquadramento, artigo científicoe
considerações finais.O
enquadramento reúne informação sobre a ecologia de estradas, biologia e ecologia da espécie alvo (Genetto genettol bem como o porquê da importância do estudo realizado. O artigo descreve e demonstra todos os resultados provenientes do estudo, a discussão desses resultados bem como as devidas conclusões. As considerações finais resumem os principais resultados e conclusões bem como as limitações do estudo. Este último capítulo ainda abordará possíveis estudos futuros quepossam provar
ou
comprovar as conclusões encontradasno
presente estudo bem comomedidas a aplicar para contornar ou minimizar o efeito que as estradas detêm nas genetas.
As referências bibliográficas apresentadas no final são
o
conjunto das citações referidas aolongo de toda a dissertação.
O impacto da rede
viária
no uso do espaço da genetal6enetta
genettot.,
1758)Resumo
O presente estudo
foi
realizado numa área com 156,5 Km,2localizada nos municípios de Évora e Montemor-o-Novo, a Sul de Portugal. Cinco genetas foram seguidas via telemetria durante seis meses visandoo
estudo do uso do espaço e comportamento relativamente àsestradas. Estas, parecem funcionar como limites das áreas vitais da geneta actuando como barreira física e/ou social aos seus movimentos. Contudo, as genetas cruzaram diferentes tipos
de
estrada embora com frequência reduzida. Poroutro
lado, as genetas adoptaram uma distância de segurança média das estradas, de 1km, onde se verifica uma aproximação durantea
noite
e
um
distanciamento duranteo
dia.
Todosos
animais evidenciaramter
umadistribuição não aleatória relativamente às estradas concentrando-se maioritariamente apenas
num dos lados da estrada, o que indica o efeito destas infra-estruturas como barreiras parciais ao movimento. A presença de galerias ripicolas parece promover o uso das bermas e durante o
estudo todos os indivíduos seleccionaram positivamente estes habitats.
The tmpact
of
RoadNetwork
onthe
Space Use ofthe
European Genetl6enetto
genetto 1., 1758)Abstract
The present study, was conducted in
a
156,5 Km 2 area, located inthe
Évora andMontemor-o-Novo counties, southern Portugal. Five genets were radio-tracked for six months
with the purpose of studying their space use and behavior towards roads. ln this study, roads seem to be artificial boundaries to genets' home ranges acting as physical and social barrier to
their
movements. However, genets have crossed different typesof
roads, although in lower frequencies. They adopted, in average, a security distanceof lkm
from roads being furtherduring
the
day and closerat
night. All animals showeda not
random distribution on theiractivity concerning roads presence and their localizations tend
to
concentrate on one sideof
the
roadwhich
confirmsthat
these infrastructures posea
significant barrierto
genets' movements. The existenceof
riparian galleries seemsto
promote roadside usage and during the study genets have selected positively these habitats.Enquadramento
O desenvolvimento notório das redes viárias por todo
o
Mundoé
um dos temas que maispreocupa os cientistas devido ao carácter destrutivo e irreversível que incute nas populações
faunísticas e florísticas, elementos que compõem as paisagens actuais. A perda artificial de
habitats naturais bem como
a
sua divisãoem
parcelasde
menores dimensões propicia oaumento da fragmentação dos habitats dividindo, consequentemente, as populações animais
em populações de menores dimensões e/ou em sub-populações isoladas colocando em causa
a estabilidade e viabilidade das mesmas (Forman and Alexander, 1998; Lodé, 2000; luell et al.,
2003; Jaeger
et
al., 2005). Desta forma, os indivíduos de uma mesma população tendem aaumentar os casos de consanguinidade diminuindo, por sua vez a variabilidade genética do grupo (Jackson, 2000; Lodé, 2000; Ferreras, 2001). Esta redução vai aumentar
o
risco deextinção da população, ficando esta mais exposta a fenómenos de estocasticidade (Jackson,
20oo).
Estas infra-estruturas actuam, para muitas espécies, como barreiras físicas intransponíveis, dificultando ou impedindo as deslocações naturais dos animais (Coffin,2OO7l- os indivíduos não chegam ao
outro
lado da estradae
consequentemente não obtêm alimento, parceirosexual e/ou local de reprodução (Jaeger et al., 2005). Este efeito barreira pode contribuir para
o
isolamento das populações resultando, posteriormente, na extinção das mesmas (Formanand Alexander, 1998; Jackson, 2000; Alexander et al., 2005). Muitos animais alteram as suas
rotas de reprodução
e
migração devido a comportamentos de repulsa perante as estradas, enquanto outros morrem devidoa
colisões com veículos (Trombulakand
Frissel, 2000; Alexander et al., 2005; Coffin, 2OO7l.A mortalidade resultante da colisão directa entre animal/automóvel é uma das consequências
mais directas
e
consideráveis das estradas,em
termos quantitativos, apresentando taxasbastante elevadas
e
expressivas (Clevengeret
al., 2001; Coffin, 20071.A
mortalidade por colisão reduzo
númerode
efectivosde
uma populaçãoo
que pode comprometera
suaviabilidade se a taxa de nascimentos não for superior à taxa de atropelamentos (Jaeger et al., 2005). Ao privarem as espécies de executarem as suas funções vitais, estão a funcionar como barreira, propiciando
o
isolamento e a fragmentação destas populações. Assiste-se assim, amodificações
de
comportamentoa
vários níveis,entre
elesos
padrõesde
movimento,domínios vitais e sucesso reprodutor (Brown et al., 2001; Coffin, 2OO7l.
Apesar de alguns cientistas terem demonstrado que as estradas nem sempre actuam como impenetráveis barreiras ao movimento dos animais (Kaczensky et al., 2003; Blanco et al., 2005;
Riley
et
al., 2006, Griloet
al.,
2008), estas podem representar barreiras sociaisao
fluxogenético (Reh and Seitz, 1990; Riley
et
al.,2006; Strasburg,2006), ficando as populações mais expostas a catástrofes naturais e artificiais.A
deturpaçãodo
ambiente físicoé
outra das consequências da implementação deestradas, alterando
e
degradandoo
meio envolventee o
comportamento das espécies(Forman and Alexander, 1998; Spellerberg, 1998; luell
et
al., 2003; Coffin, 2OO7l.O
ruído sonoro parece funcionar como sinal de aviso"
área aevita/'
para algumas espécies (Coffin, 2007) influenciando por outro lado, as vocalizações de várias espécies de aves (Forman andAlexander, 1998; Coffin, 2OO7l. Este
tipo
de infra-estruturas temo
efeito oposto em muitas outras espécies, atraindo indivíduos para a vegetação inerente às bermas, habitats propícios àalimentação
e/ou
protecção (Coffin, 2OO7l. As estradas são muitas vezes utilizadas como corredores ecológicos bem como fontes de termorregulação, sendo os anfíbios e répteis doisdos grupos mais afectados (Forman and Alexander, 1998).
A emissão de poluentes químicos também contribui para a deterioração dos habitas
bem como das linhas de água, diminuindo assim a qualidade de vida destes animais (Forman
and Alexander, 1998). Por outro lado, com a alteração de temperaturas, níveis de radiação
solar
e
velocidade do vento os habitats adjacentes às estradas são susceptíveisde
sofrer significativas alterações, podendo desenvolver-se um novo microclima propício à invasão deespécies exóticas (Forman and Alexander, 1998; Spellerberg, 1998; Trombulak and Frissel,
2000; Brown et a1.,2001; Coffin,20O7l. As bermas podem assim funcionarcomo refúgio para
alguns animais, especialmente para pequenos mamíferos (Forman and Alexander, 1998;
Spellerberg, L998; Bellamy
et
al., 2000; luellet
al., 2003; Coffin,20O7l, como fontes dealimento e abrigo (Evink, 2002) e como corredores para actividades exploratórias, de dispersão
e/ou de colonização (Spellerberg, 1998; luellet a|.,2003; Coffin, 20071. Desta forma, as bermas
e as estradas podem promover um de dois comportamentos
-
repulsa ou atracção, podendo atrair os animais para "armadilhas ecológicas" (luell et al., 2003; Coffin 2OO7l.As estradas conduzem a consequências complexas e variadas, beneficiando as espécies mais tolerantes a alterações nos ecossistemas e prejudicando muitas outras de forma gravosa.
Os
impactes
causadospor
estas
infra-estruturasactuam como
entraves
ao
bomfuncionamento de processos ecológicos, não só nas imediações das estradas como também em zonas relativamente afastadas (Brown et al., 2001).
É assim urgente, precisar os impactes ecológicos inerentes a estas infra-estruturas, de
forma a dar resposta às necessidades das comunidades por elas afectadas.
Os carnívoros são particularmente vulneráveis
à
redede
estradas umavez
quepossuem grandes áreas vitais, baixas taxas de reprodução, baixas densidades populacionais e
pouca resiliência (Spellerberg, 1998; Trombulak and Frissel, 2000; Sunquist and Sunquist, 2001
;
Ng, 2004). Nesta linha, são animaisque
percorrem grandes distânciasna
procura dealimento, parceiro sexual e quando se encontram em dispersão (Spellerberg, 1998; Trombulak
and Frissel, 2000; Sunquist and Sunquist, 2OOL
;
Ng, 2004). São espécies particularmente afectadas peloefeito
barreirae
fragmentaçãodo
habitat, uma vezque
precisamde
um sistema contíguo de habitats naturais para alcançar as necessidades inerentes a cada um, semas quais a sua existência é comprometida. No entanto, pouco se sabe sobre a resposta deste
grupo relativamente à magnitude das estradas (Grilo, 2009).
Este estudo tem como espécie alvo a geneta comum (Genetta genetto Linneus, L7581,
o único exemplar representante do género Africano Genetto, na Europa (Rosalino and
Santos-Reis, 2002). Esta espécie está classificada como "Pouco preocupante" de acordo com
o
LivroVermelho de Portugal (Cabral et al., 2005), no entanto é uma vítima constante de armadilhas
ilegais e práticas de caça. A sua área de distribuição está restringida a Portugal, Espanha, llhas Baleares
e
sudoestede
França (Bouchardyet
al., 1986; Livet and Roeder, L9871. A genetaapresenta uma distribuição generalizada dado que
é
um dos carnívoros mais comuns emPortugal (Santos-Reis and Mathias, 1996), no entanto, os dados sobre a sua distribuição e
abundância ainda são escassos (Gomes, 1998; Rosalino and Santos-Reis, 2OO2l. Esta
é
uma espécie de hábitos nocturnos (Palomares and Delibes,1994; Gomes, 1998) iniciando o períodode actividade um pouco depois do pôr-do-sol e terminando esse mesmo período antes de o sol
nascer (Palomares and Delibes, L994; Lariviére and Calzada ,ZOOL; Santos-Reis et al., 2004). É
uma espécie convencionalmente classificada como Beneralista, consumindo os recursos mais
disponíveis no tempo
e
no espaço (Lariviére and Calzada, 2OOL; Rosalino and Santos-Rels, 2OO2l, no entanto, a sua presa principal, sempre que sobreposta à sua área vital, é o rato-do-campo (Apodemus sylvaticus) (Gomes, 1998; Virgós et al., 1999; Lariviére and Calzada, 2001).Apesar da existência de alguma bibliografia sobre a dieta deste animal, este
é
classificado pelos autores,de
diferentes maneiras, variando essa classificação coma
disponibilidade sazonal de alimentose
localização geográfica (Virgóset
al., 1999; Rosalino and Santos-Reis,2OO2;Carvalho and Gomes, 2OO4l. É muitas vezes considerada uma espécie no intermédio de
generalista
e
especialista sendo os grupos mais importantes paraa
suadieta na
RegiãoEurosiberiana no Norte
e
Centro da Europa os roedorese
insectívoros (Virgóset
al., 1999; Carvalho and Gomes,2OO4l enquanto no Sul, apesar dos roedores ainda constituírem a fonte primordial de alimento, os coelhos e artrópodes adoptam posições igualmente importantes(Virgós et al., 1999; Rosalino and Santos-Reis, 2002).
A geneta europeia
é
uma espécie territorial que habita diversos tipos de habitats,sendo que a cobertura de vegetação terrestre e aérea é um factor essencial para a escolha das
áreas
vitais
(Gomes, 1998; Barrientos and Virgós, 2006; Galantinhoand Mira,
2008). Acobertura do solo é muito importante tanto nos períodos de actividade como nos períodos
inactivos (Palomares and Delibes, 1988; Palomares and Delibes, L994; Virgós and Casanovas,
L9971,
no
entanto, estes animais podem usar zonas abertas para caçarou
quando seencontram
em
dispersão (Palomaresand
Delibes, 1988; Lariviére and Calzada, 2001). Osabrigos que usam durante
o
dia, para descansar, e a disponibilidade de presas são factores determinantes na selecçãode
habitat (Lariviére and Calzada, 20OL; Galantinho and Mira, 2008). Muitos estudos têm sido realizados sobre a dieta das genetas (ex. Virgós et al., 1999; Rosalino and Santos-Reis, 2002) e apenas alguns nos factores que influenciam o uso do espaço (Virgós and Casanovas, 1997). No entanto, as estradas continuam a levantar algumas questõessobre o impacto que detêm na vida dos carnívoros, nomeadamente como, quonto e quondo influenciam estes animais.
Para muitos ecologistas, perceber o comportamento animal na paisagem e determinar
os principais factores que afectam o uso do espaço é uma questão crucial (Horne et al., 2008).
O
usodo
espaçode um
animalé
influenciadopor
uma combinaçãode
característicasfisiológicas
e
adaptações comportamentaisa
diferentes ambientes (Giuggioliet
al.,
2006;Horne
et
al., 2008) podendo a selecção do habitat ser considerada uma peça chave para a compreensãodas
decisões
comportamentaistomadas pelos animais
(Orians
andWittenberger, 1991). A presença de outras espécies, a presença humana, a disponibilidade de habitat
e
a
abundânciae
diversidadede
presas são factores fundamentais, capazes deinfluenciar
o
comportamento das genetas. lnfelizmente, estes não sãoos
únicos factorescapazes de alterar
o
uso do espaço desta espécie,o
aumento da rede viária pode também desempenhar um papel importante no comportamento e movimento dos carnívoros apesar deser ainda um assunto pouco conhecido. No entanto, saber como os animais respondem a
todos estes factores pode ajudar os ecologistas a apresentar algumas medidas de conservação
e/ou minimização.
Portugal,
é
um dos países da União Europeia com maior densidade de auto-estradas e vias rápidas (Farrall, 2000). Assim, torna-se urgente precisar a influência destas infra-estruturas nafauna e flora
do
nosso país, devido aos efeitos nefastos que incutem na natureza. É nestecontexto que surge este trabalho, pretendendo dar resposta à influência das estradas no uso
do espaço de mamÍferos carnívoros. Compreender a organização dos animais no tempo e no
espaço
é
uma
questãofulcral
na
ecologia.A
dinâmica populacional está directamenterelacionada com a distribuição espaciale os movimentos individuais de cada espécie, inerentes
a pressões internas ou externas que actuam sobre a população (Millspaugh, J. and Marzluff, J.,
2001).
A resposta comportamental das genetas à presença de estradas é desconhecida. Serão as estradas barreiras efectivas ao movimento das genetas? Se sim, quão importantes são essas
barreiras? As genetas evitam a proximidade das estradas ou podem usar o habitat adjacente a
estas infra-estruturas para investidas exploratórias? Estas e outras questões são fulcrais para a
gestão da fauna silvestre nos territórios adjacentes às estradas.
Este trabalho apresenta resultados sobre
o
comportamento espacialda
geneta lGenetto genettol, obtidosvia
rádio-telemetria numa paisagem mediterrânica atravessadapelo maior corredor de transportes do sudoeste da Península lbérica. O enfoque do estudo teve como principal objectivo saber como
o
uso do espaço é afectado pela rede viária e emdeterminar os principais factores que podem afectar o comportamento espacial das genetas.
O número de atravessamentos e a distância das localizações dos indivíduos às estradas foi usado para analisar padrões
de
comportamento (atracçãoou
repulsa;efeito
barreira). Otamanho das áreas vitais
e
a selecção de habitat foram conjuntamente determinadose
osresultados tiverem sempre em consideração a distancia às estradas
The lmpact
of
Road Network onthe
Space Use oÍthe
European GenetlGenetta
genettat.,
1758)Patrícia Aguiar de Oliveira Rúbio Ramathol'
rEstrdda
Vale de Éguas,262-Poço do Amoreiro 87OO-25j Loulé, e-mail: potixa-ramaláo@hotmail.com
*Universidade de Évora, Portugal
Abstract
The present study, was conducted in
a
156,5 Km 2 area, located inthe
Évora andMontemor-o-Novo counties, southern Portugal. Five genets were radio-tracked for six months
with the purpose of studying their space use and behavior towards roads. ln this study, roads seem to be artificial boundaries to genets' home ranges acting as physical and social barrier to
their movements. However, genets have crossed different types
of
roads, although in lower frequencies. They adopted, in average, a security distanceof
1km from roads being furtherduring
the
day and closerat
night. All animals showeda not
random distribution on theiractivity concerning roads presence and their localizations tend
to
concentrate on one sideof
the
roadwhich
confirmsthat
these infrastructures posea
significant barrierto
genets' movements. The existenceof
riparian galleries seemsto
promote roadside usage and during the study genets have selected positively these habitats.Keyurords: European genet, road network, barrier effect, habitat selection, home ranges
lntroduction
The continuous increase
of
linear infrastructures extension has radically changed landscapes and animal communities duringthe
last decades (Lodé, 2000). This leadto
the artificial lossof
natural habitats and dissectionof
habitat patches, overall increasing habitat fragmentation. The sectioningof
landscape divides animal populationsinto
smaller andlor isolated sub-populations which is a serious threatto
wildlife's stability and viability (Forman and Alexander, 1998; Lodé, 2000; luell, et al. 2003; Jaeger et al., 2005). ln fact, animals tend toincrease inbreeding consequently diminishing
the
variability between populations (Jackson,2000; Lodé, 2000; Ferreras, 2001). Moreover, gene flow's reduction
will
increasethe
risk ofextinction and the exposure of populations to stochasticity (Jackson, 2000).
Road network is commonly taken as part of modern landscapes (Clevenger, 1999). A barrier effect is originated by these paved corridors which increase resistance
of
movement (Coffin, 2OO7l - animals cannot reach the other side of the road and consequently do not reachresources like food, mates andlor breeding sites (Jaeger et al., 2005). Many animals modify
their
reproduction and displacement routeson
accountof
road avoidance behavior while others perish dueto
collisionswith
vehicles (Trombulak and Frissel, 2000; Alexanderet
al.,2005; Coffin, 2OO7l. Akin
to
habitat fragmentation,the
barrier effect may instigate isolatedpopulations leading
them
to
extinction
(Formanand
Alexander, 1998; Jackson, 2000; Alexander et al., 2005).Even though some researchers have demonstrated that roads may not always prevent
animals to cross them (Kaczensky et al.,2OO3; Blanco et al., 2005; Riley et al.,2006, Grilo et al.,
2008), acting as a physical barrier, they can represent a social barrier
to
gene flow (Reh andSeitz, 1990; Riley
et
al., 2O06; Strasburg, 2006) leading populationsto
be more exposed tonatural and artificial catastrophes.
Carnivores are particularly vulnerable
to
network road because they have relatively large home range requirements, low reproductive rates and low densities (Spellerberg ,1998;Trombulak and Frissel, 2000; Sunquist and Sunquist, 2001; Ng, 2OO4l. For this reason, they usually move long distances searching for food, mates and also to disperse (Spellerberg,1998; Trombulak and Frissel, 2000; Sunquist and Sunquist, 2001; Ng, 20041. These species are
particularly affected by
the
barrier effect andby
habitat fragmentation sincethey
need acontiguous system of natural habitat to accommodate their special needs without which their
existence
is
compromised. However,little
is
known aboutthe
carnivore responseto
the amount and magnitude of roads (Grilo et al., 2009)This study is focused on the common genet (Genetta genetta Linneus, 1758), the single
representative African genus, Genetto, in Europe (Rosalino and Santos-Reis,2002). The species
is classified as "Least Concern" according
to
the
Portuguese Red Data Book (Cabralet
al.,2005),
it
isa
regular victimof
illegal traps and hunt. lts distribution range is restricted to Portugal, Spain, The Balearic lslands and Southwestern France (Bouchardy et al., 1986; Livet and Roeder,L987l.The common genet has a widespread distribution given
that
it
is one ofthe
most common carnivoresin
Portugal (Santos-Reisand
Mathias, 1996), nevertheless,the
dataabout
itsabundance and distribution is still scarce (Gomes, 1998; Rosalino and Santos-Reis, 2002). The
genet is
a
nocturnal specie conventionally classified as a generalist animal, consuming the resourcesmore
available (Lariviéreand
Calzada, 2001; Rosalino and Santos-Reis,2O02l, however,its
main prey regardlessof
its range isthe
Wood mouse lApodemus sylvoticus I (Virgós et al., 1999; Lariviére and Calzada, 2001). European genet is a territorial species which inhabits diverse types of habitats, being aerial and terrestrial vegetation coverage an essentialfactor
to
choose its home range (Gomes, 1998; Barrientos and Virgós, 2005; Galantinho and Mira, 2008). Sheltersfor
resting and prey availability are determinantto
habitat selection(Lariviére and Calzada,20OL; Galantinho and Mira, 2008). Many studies have been made about this species diet (see Virgós et al., 1999; Rosalino and Santos-Reis, 2002). On the other hand, other studies have focused on
the
factorsthat
influence both space and temporal use ofgenets (Virgós and Casanovas, 1997). Nevertheless, roads continue to endorse some questions about their impact on carnivores' life namely how, how much and when they influence these
animals.
For many ecologists, understanding animal behavior in the landscape determining the main factors affecting space use is one of the most crucial issues (Horne et al., 2008). Animal space use
is
influencedby a
combinationof
physiological characteristicsand
behavioral adaptationsto
different environments (Giuggioli et al., 2005; Horne et al., 2008) and habitat selection can be considereda
keyto
reveal behavioral decisions (Orians and Wittenberger,1991). The presence of other animals, human presence, available habitat and prey abundance
and
diversity
are
all
fundamentalfactors
capableof
influencinggenets'
behavior. Unfortunately, these arenot the
only features capableof
altering animals' space use. The increasing of road network may also to play a major role in carnivore behavior and movements although this is still a poorly known issue. However, knowing how animals respond to all these factors may help ecologists to put fonrard some safety and conservational measures.Radio-telemetry is a very useful method
to
investigate this issue becauseit
gives usprecious information about animals' space use and their behavior towards landscape units
(
Harriset
al., 1990; Ministryof
environment, 1998; Kauhala and Tiilikainen, 2OO2;Wauters et al., 2007).
The behavioral response of genets
to the
presenceof
roads isunknown.
Are roadsbarriers to the genet movements? lf yes, how important are these barriers? Do genets avoid
the
proximityto
roads or they can use road vicinity as,for
instanceforaging
grounds? This andother
questions are key issuesthat
can helpto
managewildlife
populationsin
roadsurroundings.
The present paper provides results on the spatial behavior of genets laenetto genettol obtained via radio tracking in
a
Mediterranean landscape crossed by biggest transportation corridor in the southwest of the lberian Peninsula. lnterest has been centered on how space isaffected by the road network and in determining the main factors that might affect the spatial behavior of genets. The number
of
road crosses and the distance of the animals locations to roads were usedto
evaluate and analyzedthe
behavior pattern (attractionor
avoidance; barrier effect). The home range size and habitat selection were also determined and theresults are discussed taking into account distance to roads.
Study area
This research was conducted in a 156,5 Km 2 area located in Évora and Montemor-o-Novo counties, southern Portugal. The study area is partially included in Serra de Monfurado,
Natura 2000
Site
(lCN, 2006),where most
landsare
private
property.The
climate isMediterranean with Atlantic influences - dry hot summers and cold rainy winters where the highest main annual temperature
is
210C andthe
lowest 11oC, beingthe
average annual precipitation 655mm/year (Weatherstation
Évora-Mitra, 1951-1980).The
landscape isdominated by cork and hotm oak woodland, sometimes
with
an
undercanopyof
scrubs -commonly described as montodo. The study area also includes pastures and fallow lands, olive and pine groves, vineyards, and a few patches of exotic tree species lEucolyptus globulusl.Thewell
represented Riparian vegetationis
composedof
black poplar (Populusnigrol,
ashlFroxinus ongustiÍotio), white
willow
lsotix otbol, blackberry (Rubus ulmifolius) thickets andblack alder lAlnus glutinosal.The area is crossed by several roads with different traffic density. There is a two-side fenced highway (46) with an annual average of daily traffic between 330
and 2494 vehicles/night, several sections
of
national roads (N114, N4 and N370) reaching values between 500 and 2161 vehicles/night (Grilo et al., 2009) and a secondary paved road (Guadalupe road) with lowest traffic intensity. ln some locations the highway runs parallel to anational road (N114). Although human presence is scarce and dispersed,
it
promotes visiblehuman impacts such as cork extraction, livestock and hunting activities. Genets are sometimes
seen as pests mainly by hunters because they prey on game species and their eggs, so they are
commonly victims of human practices as illegal predator control.
Methods Capture and Radio-tracking
The animals, were captured
with
box traps (Tomahawk Deluxe Single door live trap,Model
108.2) measuring 9L,44cmof
length, 25,4cm
of width
and 30,48cm
of
height (Tomahawk Live Trap Co., Wisconsin, USA) between February and May 2008. The box trapswere placed near
the
N114 road between Évora and Montemor-o-Novo. Trap location waschosen according to the tree cover density, human accessibility and other suitable conditions
for
genets' presence. Wheneverthe
weather conditions were unacceptable, trapplng were interrupted. Atthe
beginning, sardines were used as bait. Later they were replaced by eggsbecause the fish was a strong attractor
to
rats making the traps unavailable for capturing the genets; droppingsof
other carnivores were placed near trapsto
increase trapping success.Traps were checked in the early morning. When captured, the animals were immobilized and
anaesthetized
with
a
combinationof
ketamine and xylazine, under veterinary supervision.Each animal was fitted with a radio collar and marked with a TAG, for individual recognition. All
animals were weighted, measured, sexed, and aged as young, sub-adults or adults (according
tooth
wearing and development and body dimensions). After animals'total
recovery, they were released in the same place of the capture.Radio collars (Wildlife Materials, lnc., mod.lpm2700A) weighed approximately 259
never outnumbering 5% of
the
animals' weight and their signal was received by TRX-1000Sreceiver (Wildlife Materials, lnc.)
with
a three
element Yagi, directional antenna (Wildlife Materials, lnc.) anda
hand-held GPS (Garmin GPS- eTrex H). Necklace transmitters were transformed with neoprene to minimize the impact on animals.Radio tracking was carried
out
between April and November 2008 when one or twolocations were made during the day and/or night for each animal wherever they were found (for each location a characterization of the microhabitat vegetation and surrounding areas was
made.) The
time
interval betweentwo
successive locations was controlledto
ensure the independence of data locations - daily locations were made by meansof
homing techniquewhere animals were inactive (wherever possible) and nocturnal locations via triangulation when they were active (Mech, L983
in
Palomares and Delibes, 1994).ln
orderto
evaluate activity patterns, a rotational schemewith
periods offour
hours, covering all the 24 hours,was
usedto
radio-trackevery
animal.The
accuracyof
locations obtained through triangulation was evaluatedwith
tests donewith
animalsfor
whichthe
exact location wasknown (e.g. when animals were inactive) and then compared with the exact location of the animal (homing). Results differ on average 360m. The radio telemetry locations were obtained by one observer hence the bearings were recorded within a 5 min interval and differences in
azimuths between 45 and 1200. The activity status of the animals was evaluated on the basis of
the frequency of the radio signal.
Data analyses
Before estimating
the
home range size, we have previously evaluatedthe
numberof
pointsneeded to get a stabilized estimation of it (Harris et al., 1990; Aebischer at al., 1993; Munuera and Llobet, 2004). The plot of estimated home range size with minimum convex polygon (MCP)
against the number of fixes was used to define the minimum number of locations needed to
get an accurate estimate of the home range. This number corresponds to the value for which a
home range size reaches an asymptote (Kernohan et al., 2001). For all animals, except one, a
minimum of 80 locations are needed to make estimations of the home range. For one animal, which only have 30 points, the asymptote was never reached. Hence, all the analyses in this study refer to animals for which the minimum number of locations was gathered.
Estimates for home-range size were carried out with the Animal Movement Extension
(SA v2.04 beta) of ArcView Gis 3.3 (ESRI, 1999). Two methods were used: the minimum convex
polygon (100%) (Mohr, 19471- the most used method for home range calculation because of its usefulness
to
comparewith
other studies (Harriset
al. 1990; Junior and Chiarello, 2005;Farrimond et al., 2006; Franzreb, 2006) - and the fixed kernel estimator (gs%Xworton, 1989;
Seaman
and
Powell, 1996; Millspaughand
Marzluff,zOOt[
Whenever possible,we
alsoestimated the core areas
of
each animal which correspondsto the
50% fixed kernel-
usingLSCV (Farrimond
et
al.,20O6; Franzreb, 2006). For both 95 and 50% fixed kernel, smoothing parameters were determined bythe
least squares cross-validation,(LSCV) being the grid sizedefined automatically by the software (Franzreb, 2006). The overlap of home ranges between each pair
of
animals was expressed as thetotal
percentageof
home range overlapfor
the kernel 95% home ranges. Daily resting sites were described accordingto
several biophysicalcharacteristics including tree and scrub cover and the dominant species of each stratum. For
each animal, the re-use rate of each resting site was evaluated by dividing the total number of
resting periods by the different resting sites detected (Palomares and Delibes, 1994).
Genets space use is intrinsically linked
with
habitat selection not only because homerange definition depends
on
habitat compositionbut
also becausethe
surrounding matrix may/may not favor the proximity with road network.Habitat selection was analyzed in two ways. Firstly, we have compared the proportion
of
each habitat typewithin
home rangeswith the
proportionof
use (numberof
locations) made by each animal within its home range; secondly we have compared the available habitatin
the
areaof
study (defined bythe
minimum convex polygon including all locationsof
allstudied animals) with the habitat within each genet home range (Johnson, 1980; Aebischer, 1993; Cavallini and Lovari, 1994). Five different habitats were considered: riparian gallery (RG),
cork oak woodland (C0-wood), dense cork oak woodland (D_CO_wood), open field (OF) and
others (which included habitats poorly represented in the study area, less than 2 % of the area; such as olive and pine groves, vineyards, and a few patches of exotic tree species).
ln this study the analyses were made at an individual level because
it
is believed byseveral authors
that
pooling dataof
all individuals turns more difficultto
draw conclusions (Cavallini and Lovari, 1994). All radio-locations (due to the few location data of each individual 4 hour), were used for the analysis of habitat selection (the activity and resting points), despitethe recommendations of several authors for an independent analysis (Palomares and Delibes,
1ss4).
Preference
or
avoidance towards habitats was evaluated througha
qui-square test(with K-1 degrees of freedom where k is the number
of
habitat categories (Neuet
al., 19741.When significant differences were found,
the
Bailey's confidence intervalswere
used todetermine the direction of selection of each habitat class (Cherry, 1996). Habitat types used
more
or
less frequently than availably were respectively considered as preferred or avoided(Cherry, 1996; Martins and Borralho, 1998). When habitat types are used in proportion of their
availability, a selection by the animals does not exist.
ln
orderto
evaluate behavioral patternsof
genetsin
relationto
road network, wemeasured the distance to the nearest road for every location of each animal. The analysis was
done
considering separatelyactive
and
inactive
locations,
in
that
order
to
test attraction/avoidance behavior andwith all
data
pointsfor
each animal. Distances were gathered in arcview GIS (ESRl, 2006) and then tested through the Mann Withney nonparametictest (Maroco, 2003). We also analyzed the distances
to
riparian galleries because during the study this habitat revealedto
be an important resting places for some of the animals and thismay help us to understand better the genet's space use.
ln order
to
evaluatethe
possible roleof
roads as barriersfor
movements and theirinfluence on space use,
for
each animal (except G5) we generated a circular plot, having a L7similar area of its MCP home range and centered at capture point. These were located close to
the
N114 so all plots were crossed by this road. lnside each circle, 100 random points were generated, correspondingto
simulated fixesthat
were used as predicted valuesfor
a
qui-square tests aiming to evaluate if observed fixes were randomly located on each roadside. We
also looked for crosses by mapping the daily locations of each monitored animals on a road map.
Results
Captures and genet locations
Ninety tree animals were captured in 960 night-traps, including 69 rodents, the more
frequently
caughtgroup;
seventeen carnivores (seven european genets,five
egyptian mongoose,two
beech marten and tree domestic cats); four birds (three passerines and oneowl) and tree hedgehogs. Seven genets were captured with a capture success of L,3%o. The first
two captures (G8 and G9) were released without collar necks due to their small weight. The
other five captured genets (see table one - G1,G2,G3,G4,G6) were monitorized between four and six months except G6, who was lost after one week of monitorizing. However, two other genets (G5 and G7) were captured by local farmers and were part of the study. Unfortunately the female G7, outside captured, was lost after being released due
to
collar failure, being G5the
only outsider monitorizedwith the
otherfour
captured animals,for
at
leastforty
daysbefore his death .During the whole study, seven males and two females were captured, five of
which were sub-adults and four adults. ln average the genets weighted 1.461kg (SD = 0.326, range =0.98-1.870, n=9).
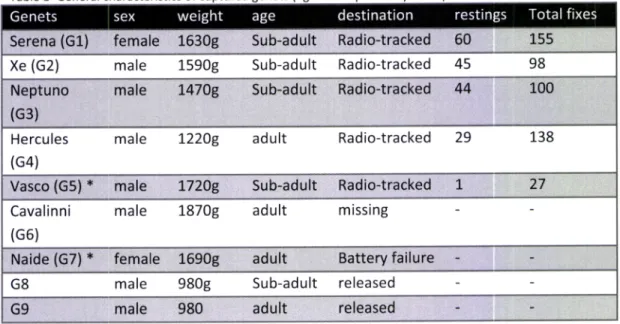
Table 1- General characteristics of ca red ets nets ca red
Serena female 1630e
Xe
(G2)
male 15909
Sub-adult
Radio-tracked
45 98Neptuno
(G3)
male I470g
Sub-adult
Radio-tracked
44 100Hercules
(G4)
138 ma
le I220g
ad u !t Radio-tracked
29Vasco (G5)
* rnale
L720g S u b-a d ult
Ra d io-tracked I
27Cavalinni
(G6)
ma
le 18709
ad ult
m issingNaide (G7l
*
female
16909 adult
Battery failureG8 ma
Ie 980g
Su b-ad uIt
re leasedG9
male
980adult
releasedGenets
sex
weight
agedestination
restings
Total fixes18
Sub-adult
Radio-tracked
60 L55A total of 518 locations (339 triangulations and 179 homings) were obtained for the 5 studied
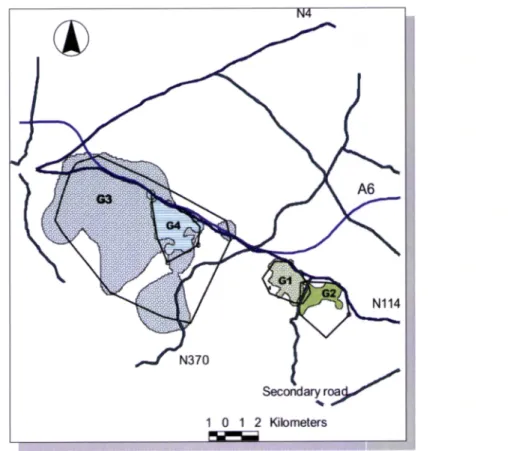
genets. More than 20% of fixes were missing, i.e., the animal was not found when searched. As illustrated by figure 1., roads seem
to
play an important role in spatial organization of the animals since most of their locations are bounded by roads. The highway A6 presents a stretch parallelto
N114 which turns more difficult for animalsto
cross it, since they have tocross the national road first. Only one genet (G3), which has also crossed N114 and N370 once,
has crossed
the
highway,this
happenedat
least 13 times, meaningthat
he crossed the national road, N114, also 13 times. Twenty eight percent of the locations were on the oppositeside of the road from the capture location of G3. Despite the small monitoring time, genet G5
crossed a national road (N4) eleven times (40,7% of locations). Other genets (G1, G2, G4) had a
lower crossing rate:
of the
155 locations,the
female crossed roads5
times (3,2%) (TheGuadalupe road -the road with less traffic - on three 3 occasions - and the N114 twice); G2 only
crossed the Guadalupe road twice (2%)and G4 only crossed the N114 once (0,7%) .
o
N o o o c o o) o.€
c (o r op
o) c o o. o .i ! o o 3 Io
(J I o T, c§
E o o 3 -v(! o v o I (U c o€
.i, E o o 3 Io
(JÍ,
c (o E o o I í! o v o I ío ú, g (o u0 É .9 ío o o,
E E o o à0 .E E o u u í! út (9+
(, rÍ; (, N (,-d (9 q o C o u0 o c .9 o o o J I rl g, ui =E úqirg
E!,
30
H
g'
X,ô
râ f, o eE.,,
ã?
E9
CUüE
gi,3 à yLl--ooEIõ
=5=
Irffi
Rk
a\| rÍl Ê1 It,\,t9t,t9
ft!8t
g
o
õ
Eo
=
:il
+
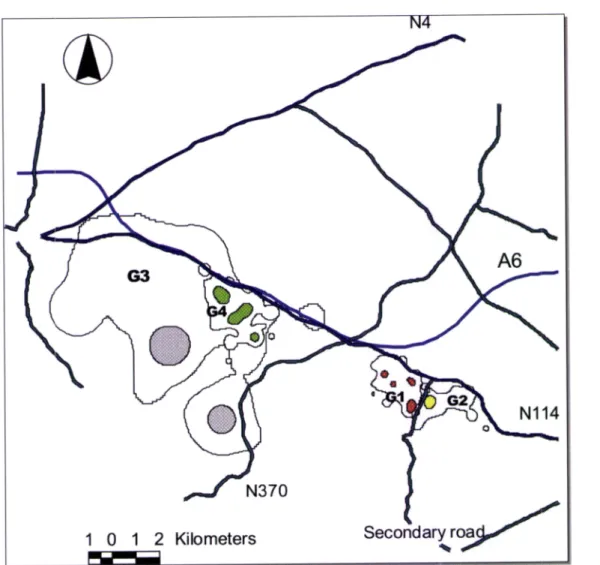
Z \,,Home ranges and core areas
The mean home range area
of
studied genets was 20,2 Km2 usingthe
minimum convex polygon (SD=28.2, n=4)) being slightly smaller when obtained by kernel method, 18,53Kmz (95o/o,SD=28.2, n=4) .
The larger home range area was 62 km
'
(rp.
), a value corresponding to a sub-adult male probably a disperser (G3). The female G1 has the smallest home range (4,68km2) (seetable 2). Nevertheless,
the
three amongfour
animals showed some similar values. Home ranges areas present similar valuesfor
both methods except for genet G2, which presents a smaller size for the kernel method (Table2). This difference may be explained by the use of the mcp which leads to overestimation of the animals' home range (Harris et al., 1990) ln somecases, home ranges are bordered by two roads delimitating the north, the east and sometimes
even west borders.
Some overlap may be observed between G3 and G4 (figure 2). The first genet is a
sub-adult clearly in dispersion, whose home range includes almost all(98,2L%l the home range of
G4. On the contrary, G4 home range only includes l},7yo of G3 home range. The home ranges
of G2 and G1 present an overlapped, less than 6%.
Figure 2 - Genets home ranges obtained by minimum convex polygon (showed by outer straight lines) and fixed kernel method (95%) (showed by contour lines, filled and colored areas). There were three male genets (G2, G3, G4)
and one female (G1)
Nl14
1
0 12
Kibmeters0
A6 N370 2LThe mean core areas
of
studied genets was 1.,46 Km2 usingthe
kernel method, (50%, SD=1.83, n=4).The core areas of the animals occupied in average 7,8Yoof the total home rangearea being almost thirteen times smalle r (1,46 Km2) than home ranges, however if we exclude
genet G3 of the analyses the three animals occupied in average t2,4yo of the total home range
area being just
eight
times smaller (0,56 Km2)than
home ranges. All genets had more than one core area, except for G2; G1 had four, G4 three, and G3 two; the single female had morecore areas than males (figure 3).
Figure 3 - Home ranges (showed by contour lines) and core areas (filled and colored areas) of genets (95% and 50%
fixed kernel) with principal roads of study area.
G3
O
o Io
A6
N114 o N37010
1
2
Kilometers 22228,43 577,4L 325,64 1759,84 603,59 994,L9 911,35 45t,L3 178,41 2!0,39 709,36 465,96 28t4,6 536,52 759,98 978,7t 391,33 339,01 1587 2928,43 1916,85 3094,93 27L4,77 1888,97 2t9,26 837,49 239,9! 59L,07 2827,46 973,78 570,09 L087,73 339,05 L39L,2 368,53 2657,Ot L473,26 3705,05 2065,3 1 t737,85 G1 G2 G3 G4 G5 A6 S.D
S.D.
Watercourses
S.D N114,N4|
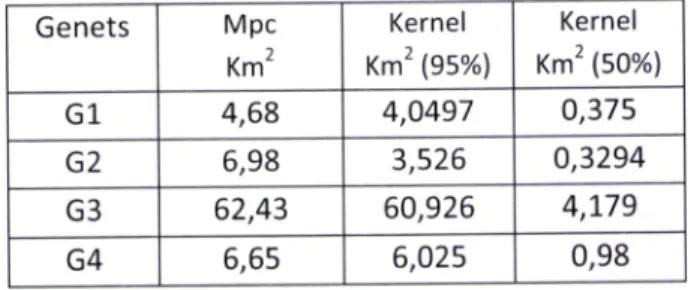
S.D N370, Guadalupe road Average Dist. (m)Table 2- Home ranges of the genets estimated, using the minimum convex polygon and fixed kernel (95%) and core
areas (kernel-50%1, Genets Mpc Km2 Kernel Km2 (gs%) Kernel Km2 (50%) G1 4,68 4,0497 0,375 G2 6,98 3,526 0,3294 G3 62,43 60,926 4,L79 G4 6,65 6,025 0,98 Roads
Table 3 presents the average distance of each genet to main roads, classified according
to the traffic intensity and to water courses.
Table 3- Average distance of genets' locations of three different types of roads, classified according to the traffic volume: highway (A6), high traffic national roads (N114, N4) and lower traffic roads (N370, Guadalupe road). The average distance to watercourses was shown as the standard deviation (S.D.)
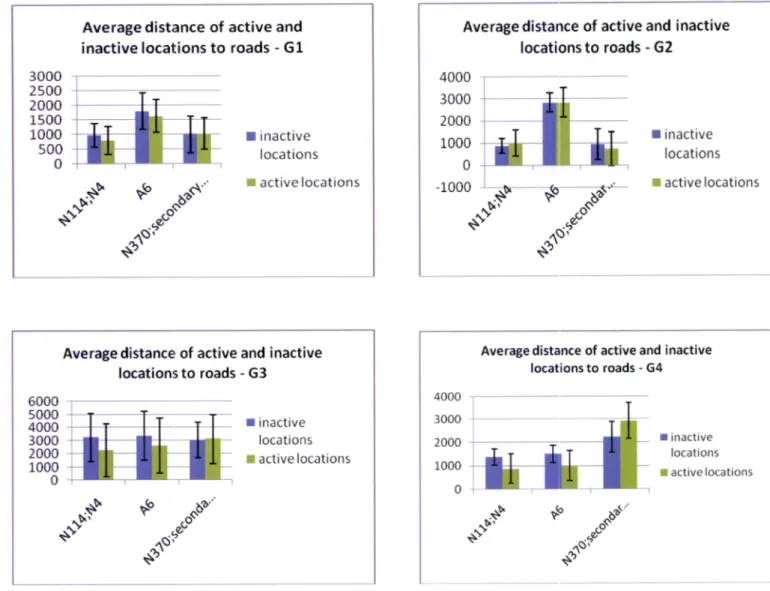
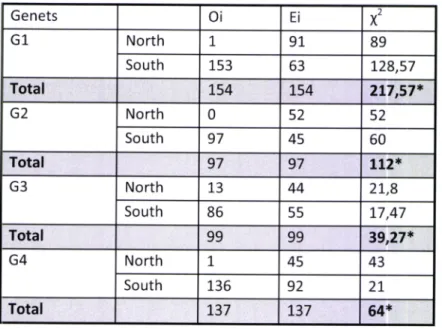
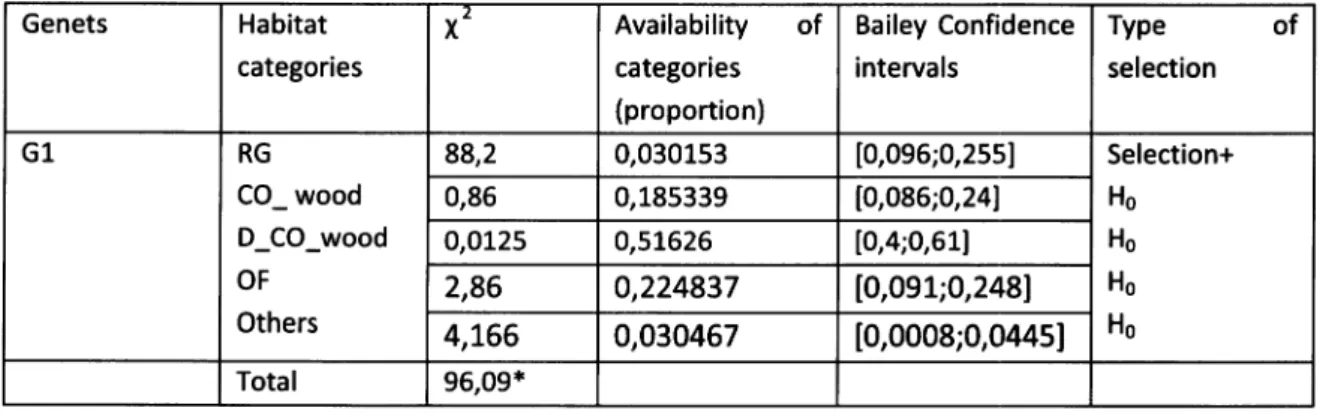
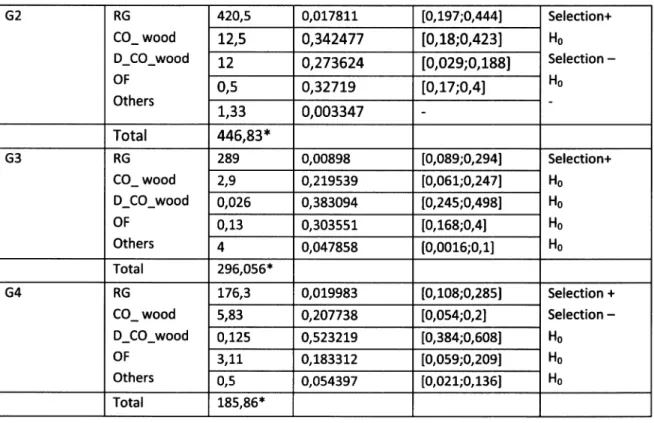
ln average, genets are 1500m away from national roads, 225Om from the highway A6,
2275m from secondary roads and 300m from watercourses. Three genets (G1, G2 and G4)
were found at an average distance of about 1 km to some road and in general all animals are close
to
watercourses. Figure 4 presents the average distanceof
roadsto
active and inactivegenets' location. We also present
the
results of the Mann Whitney Test comparing, for eachanimal the mean distance of active and inactive locations (table 4):
Average distance of active and inactive locations
to
roads - G13000 2500 2000 1500 1000 500 0
I
inactive locationsr
active locations§§
É
Average distance of active and inactive locations
to
roads - G2 4000 3000 2000 1000 0 -1000r
inactive locationsr
active locations.9
Average distance of active and inactive
locations to roads - G3 6000 s000 4000 3000 2000 1000 0
r
inactive locationsI
active locations*f§
É
.§s.''
^§?o's'
Average distance of active and inactive locations to roads - G4 4000 3000 2000 1000 0
I
inactive locationsI
active locations§s
f"
,.§?o".§s'
s'
Figure 4 - Average distance of active and inactive genet's locations to different types of roads. Results of the Mann Whitney Test (* significant differences with p <0,05) are shown for each individual.
Table 4 - Results of the Mann Whitney Test (* significant differences with p <0,05) are shown for each individual (comparisons of mean distance of active and inactive locations) and for each road .
Mann-Whitney Motorway (A6) High traffic nationa ! roads
(N11a;Na)
Lower traffics roads (N370; secondary road)
G1 (p) 0,132 0,011* 0,89
G2 (p) 0,885 0,267 0,17 4
G3 (p) O,O97 (almost sig.) 0,012* 0,822
G4 (p) 0,00 * 0,00* 0,00*
All animals, except
for
one (G2), seemto
have a pattern influenced bythe
roads. lngeneral the animals are closer
to
roads when they are active (at night) and tendto
be furtheraway from roads during the day, when they are resting. This pattern is only witnessed in high
intensity traffic roads (N114;N4 and A6) excluding the national road N370 and secondary road of Guadalupe. Despite genet G4 differ significantly on all tested roads, the lower traffic roads
presented an opposite result, compared
to
the other analyzed roads. The genet G2 did not presented any significant differences between active and inactive locations, for any road.24
The circular plots created
to
test the genets' randomnessof
habitat use have shownthat animals do not normally have a random behavior concerning the presence of the roads
(figure 5).
Perce ntage of expected genet's locations at north and south of
national road N114 - Gl
Percentage of observed genet's locations at north and south of
national road Nl14 - Gl north
1%
Percentage of expected genet's locations at north and south of
national road N114 - G2
Percentage of observed genet's locations at north and south of
national road N114 - G2
Percentage of observed genet's locations at north and south of national
road N114 - G3
North
L3o/o
Percentage of expected genet's locations at north and south of
nationat road Nl14- G3
Figure5-Percentageof expected genet's locations north and south of nationa! road N114.
25 46%
\
b.-___ South x00% south 4t%I
Nsrth i 56Yo South 87%j
T
Figure 5 - (Cont.)
Perce ntage of expected genet's locations at north and south of
national road N 114 - G4
Percentage of observed genet's locations at north and south of
national road Nl14-G4
north L%
As it can be perceived, the observed percentage of locations north of N114 is very low, almost insignificant when compared
with the
expected one. Two genets (G4 and G1) have only presentedt% of the
north-side road locations when,if
they behave randomly, they shouldhave presented 33% and 59%, respectively. One animal (G2) did not show any location north of the road and the sub-adult male, probably a disperser (G3) was the genet that presented a
higher percentage
of
points in the north side. All the animals showed significant differences between the expected (Ei) and the observed (Oi) number of locations meaning that all genetspresent a non-random behavior (see table 5).
Table 5- Qui-square test between the observed and the expected number of locations on both sides of the national road (N114); (* significant differences with p <0,05).
Genets oi Ei x' G1 North 1 91 89 So uth 153 63 L28,57 Total L54 L54 2L7,57* G2 No rth 0 52 52 So uth 97 45 60 Total 97 97 TLz* G3 North 13 44 2L,8 So uth 86 55 L7,47 Total 99 99 39,27* G4 North T 45 43 So uth 136 92 2T Total L37 L37 64* 26
-a
^aI
south 67%\
Habitat Selection
Both habitat selection analyses (first order: genets' locations ys. mpc; second order mpc vs. area of study) have presented significant differences for all animals, except G3 which did not show any differences between the observed frequencies within mpc and the expected
frequencies
within the
areaof
study. Resultsof
qui-squared and Bailey testsfor
first
and second order of selection are shown in tables 6 and 7.Habitat composition inside home ranges consisted on average
of
35%of
dense cork oak and holm oak woodland, 33,6% of openfield,
22,4% of cork oak and holm oak woodland,only 6,4c/o of other vegetation (olive and pine groves, vineyards and a few patches
of
exotic tree species such as the Eucolyptus globulus I and L,8Yo of riparian vegetation.Genets spent, in average, more time exploring the dense cork oak and the holm oak
woodland (3O,2%l followed by the open field (23,4Yo1, the riparian vegetation 121,6%l and the
cork oak and the holm oak woodland (.20,4%1.
Each genet presented significant differences in habitat use and availability within home
ranges. After
the
qui-square test,the
Bailey confidence intervals have shown a generalizedpreference
for
riparian galleries, bothfor
resting and foraging, despitetheir
low extensionwithin home-ranges. ln every genet's core areas, at least one riparian gallery associated with watercourses was presented. For one of the males (G3) the montodo was disproportionately
less used when compared to its availability and the same is true for G2 yet in this case only the
dense montado. Every other habitat types were used according to their availability
Two genets (G3 and G2) had used
all
habitatswithin
mpc accordingwith
theiravailability in the area of study. Genets G1 and G4 had positively chosen dense montado and negatively chosen open fields. For these animals,
all
other
typesof
habitatswere
used according with their availability.Table 6- Results of qui-squared and Bailey's confidence intervals for the first order habitat selection analysis:
Genets Habitat categories z x
Availability
of categories (proportion) Bailey Confidence intervals Type selection of G1 RG CO_ wood D_CO_wood OF Others 88,2 0,030153 [0,095;0,255] Selection+ Ho Hs H6 He 0,86 0,185339 [0,086;0,24] o,oL25 o,57626 [0,4;0,611 2,86 o,224837 [0,091;0,248] 4,L66 o,030467 [0,0008;0,0445] Total 96,09',* 27G2 RG CO_ wood D_CO_wood OF Others 420,5 0,017811 lO,t97;O,4441 Selection+ Ho Selection
-Ho 12,5 0,342477 [0,18;0,423]t2
0,273624 [0,029;0,188] 0,5 0,32719 lO,t7;O,41 1,33 0,003347 Total 446,83* G3 RG CO_ wood D_CO_wood OF Others 289 0,00898 [0,089;0,2941 Selection+ Ho Hs Hs Hq 2,9 0,219539 lO,O6L;O,2471 0,026 0,383094 [0,245;0,498] 0,13 0,303551 [0,168;0,41 4 0,047858 [0,0016;0,1] Total 296,056',r G4 RG CO_ wood D_CO_wood OF Others L76,3 0,019983 [0,108;0,285] Selection + Selection -H6 H6 Ho 5,83 o,207738 [0,054;0,21 o,725 0,523219 [0,384;0,6081 3,7L 0,183312 [0,059;0,2091 0r5 o,054397 [0,021;0,1361 Total 185,86',r Table 6 - íCont.)Table 7 - Results of qui-squared and Bailey's confidence intervals for the second order habitat selection analysis:
Genets Habitat categories 2 x
Availability
of categories (proportion) Bailey's Confidence intervals Type selection of G1 RG CO_ wood D_CO_wood OF Others 3,43 0,010 [0,0016;0,1016] He Hs Selection + Selection-Ho 0,118 0,20558 [0,097;0,3056] 10,89 0,33 [0,38;0,64] 4,68 0,3598 [0,127;0,3501 4,3 0,033 [0,0016;0,10] Total 23,M G2 RG CO_ wood D_CO_wood OF Others 0,85 0,01 [5,49x10⁻⁵;0,0856] Ho Ho Ho H6 Ho
lo,L4 o12 lO,L8;O,421
0,76 0,33 lO,L8;0,421 o,2468 0,3598 10,2449;0,4981 5,78 0,033 [0,00124;0,068] Total L7,77* G4 RG CO_ wood D_CO _wood OF Others O,79 o,oLo77 [6,49 x 10 -';0,08561 Hs Ho Selection + Selection
-Ho 0,0095 0,205584 lO,ll24;O,3281 10,896 0,33 Í0,382667;0,64541 8 0,359 [0,097;0,30] L,2 0,033 [0,013;0,1452] Total 20,89* 28Resting sites
From the 177 diurnal locations taken during the inactive genets' period, we identified
134 dlfferent resting sites. The results suggest that the re-used rate is very low. ln fact, despite
being generally perceived as animals that frequently re-use the same resting sites (Palomares
and Delibes, L9941, in this study, however, genets have mostly used resting sites only once.
lndividual
Gt
had a re-use rate of 1,46 (N= 60;4L different resting sites), G2of
1,36 (N= 45; 33 different resting sites), G3 of 1,16 ( N=43; 37 different resting sites)and G4 of L,26 (N=29 ; 23 different resting sites), being the average re-use rate of L,32lN=t77, 134 different resting sites). Genets were mostly found on two kinds of resting sites: thickets 125,4%1, chieflycomprised of rubus ulmifolius, cistus sp. and climbing plants such as hedera helix and smilox
ospera; and wood plots of different tree species (43,8%1. The preferred trees to rest were cork
oaks 122,8%) followed by riparian trees (16%) (including the black poplar -Populus nigro-, the ash -Fraxinus ongustifolio-, the white willow -Salix olbo- and the black alder -Alnus glutinosal, holm oaks (3,7%l and
olives
lL,2%1. The category others (3,62%l refersto
rocky places (3%)and old abandoned houses 10,62% ). We cannot say whether genets prefer trees rather than
thickets
in the
sensethat
27,tyoof the
resting sites(not
includedin the
analyses) were detected in dense patches of trees and scrubs. ln these cases, we have not obtained the exactlocation of the animals because of the dense and impenetrable vegetation.
Discussion
Captures and genets locations
The capture results showed
a
low densityof
genets inthe
study area (0,057/Km2), a smallvalue compared with other studies (Palomares and Delibes,l994i Munuera and Llobet, 2004; Santos-Reis et al., 2004; Rosalino et al., 2005), which can be due to the low trapping intensity (sixty four days; 15 traps), and some
to
problemswith
baitthat
in the begging of the study attracted also rats to the traps, inactivating them. Twenty percent of locations were missing(the animals were not found when searched) probably due to topographic constrained. Most of the locations can be found south of highway and national road 114 and the animals seem to have some
intrinsic
relationwith
these
infrastructures, oncethey
havetheir
territoryboundaries really close to the roads that cross the study area.
Home ranges and core areas
The mean home range area (MCP =20,2Kmz;9l%Kernel= 18,63 Kmz,) reaches a larger value compared
to the
results of other studies (Palomares and Delibes,!994; Munuera andLlobet, 2004; Santos-Reis et al., 2004) due to the presence of
a
probable disperser (G3). Thisanimal has a home range area of approximately 62 Km2 similar to a dispersal genet in Doffana
National Park which covered an area of about 50 Km2 (Palomares and Delibes, 1988). lf genet
G3
is
removedfrom this
analysis,the
mean home range sizeof
the other three
genets decreases alot
(MCP= 6,10Km2, SD=1.24, N=3; 95% Kernel = 4,53 Km2, SD=1.32, n=3) and issimilar to the average home size in Doffana National Park, Spain (MCP=7,8 Km2) (Palomares
and Delibes,19941and bigger than in a similar mediterranean habitat in southern Portugal (
MCP= 3,29 Km2) (Santos-Reis
et
al., 2004).The only female of this study had a minor home range size thanthe
males when calculated bythe
minimum convex polygon, nevertheless,when we used the kernel method
the
home range size of the female G1 and male G2 weresimilar. The core areas found on our study (excluding G3) are eight times smaller than home
ranges and slightly bigger than the eight genets radio-tracked in Grândola, southwestern cost
of
Portugal (Santos-Reiset
al., 2004).The core areas did not overlap among individuals andwere used
for
both foraging and resting. The sub-adult disperser (G3) had also a large corearea reaching 6 Km2 divided in two smaller areas. Only one genet had a single core area (G2)
probably due
to
the
richnessof the
habitat in this area. This 0,33 Km2of
landscape area islocated in a riparian gallery extremely used by this animal where the main conditions
for
itssurvival (shelter, food and water) are fulfilled. The single female of the study shows a core area
size similar to this last animal (0,38 Kmz)
yet
she has more core areas than the other genets (four), genet G4 had three core areas and G3 had two. For all genets, at least, one core area was traversed by a very important riparian gallery.Genets are normally described as territorial animals mostly
with
adults of the samesex; however
it
is reported some complacency when dealing with animals of opposite sexes(Palomares and Delibes, 1994). ln this study we have found O,L74 Kmz of common home range area both to
Gl
and G2. On the other hand, G3 shares his home range area with G4 (6 fmz). tnthis case there is an almost total overlap since this 6 Km2 covered all home range size of G4.
Despite this overlap we believe that these animals have a reduced number of encounters given
that the disperser has a vast area to explore.
Roads
The radio tracking data analysis has shown that roads vicinity was not totally avoided
by genets.
All
individuals were found, several times, quite closeto
roads, as shown by the distribution map. ln all studied animals, roads were part of home range boundary. Except forthe
disperse/s (G3) home range, genet's home range approached roads despite seldom crossing them, suggesting that these infrastructures may act as artificial territorial boundaries (Riley, 2006). This last role as a territorial boundary had already been witnessed by other authors in brown bears in Slovenia (Kaczensky, 2003), and bobcats and coyotes in SouthernCalifornia (Riley, 2006).
It is clear that roads are acting as barriers to genet's movements and also as traps that
kill them (personal observations during the study), despite
the
positive crossing rate already shown. Genet G3 was the only one that crossed often the main road - the highway A6 which seemsto
be
less permeableto
genets thanother
roads. This animal's crossing rate wasmoderate (28%1. This may be explained by the fact that it is a disperser animal and thus more
willing
to
find territory.
ln
periodsof
mating, dispersionor
evenin
atypical conditionsof
drought
or
scarcityof
food,
roadsnot
only act
asa
harmful barrier forbidding normal ecological stagesof
animalsbut
also increase kills rate. The highway runs parallelto
the national road N114in
some stretches andin
contrastto
A6,the
national road N114 was crossed by three of the five studied animals. lf animals cross the N114, parallel to 46, why not crossingthe
highway as well?lt
seems thatthe
highway can be a major problem for these animals probably because of the physical characteristics, larger pavement, better fences, andhigh noise and speed. Excepting genet G3, and despite the low crossing rate, low traffic roads
were crossed by genets G1 and G2 more often than other roads. Besides having less traffic, these roads are
well
integrated inthe
landscape, makingit
easierfor the
animalsto
crossthem. The existence of riparian galleries may also encourage the roadside usage and crossings.
For instance, genet G2 was very often near national road nLL4 and/or
the
secondary road (Guadalupe road) because in this area exists a large riparian gallery near theroads.
The N4, anational road similar
to
N114 in traffic and noise, was crossed several times by G5, who doesnot seem to have a defined home range. lt was impossible to draw any conclusions about this animal because only few locations were taken before his death caused by humans (we found him buried near a stream). Genet G4 was the animal with a lower crossing rate since only one road, N114, was crossed and only once. None of the genets that crossed a road stayed on the
other side and as showed by Riley
et
al. (2006) the territories near roads may be acting aseffective social and behavioral barriers to a genetically successful dispersal.