IMPACT OF THE 2003CAPREFORM AND THE HEALTH-CHECK IN ALQUEVA IRRIGATED PROJECT
Abstract
One of the major challenges of the Alqueva Irrigation project is to benefit with
irrigation, 110 000 ha. of dryland area. This project has a huge potential because it is
located on a traditional agricultural area and has agro-weather conditions favourable to
the development of irrigation crops. However, there is some challenges that needed to
be overcome, namely the recent developments of the Common Agricultural Policy
(CAP), the expected water price increase and the latest guidance in the water
management policy. Considering this framework, the main goal of work is to assess
the impact of the 2003 CAP Reform and the Health-Check in Alqueva irrigated
project.
Based on a survey sample of farms of the irrigation scheme of Monte Novo, three
representative farms were selected using multivariate statistical methods. To assess the
competitiveness of Monte Novo farms, a multi-period programming model was
developed that allowed to analyse the inter-temporal nature of investments, optimal
crop and livestock activities mix and structural farm changes. The farmer goal was
assumed to be the maximization of the final farm net worth.
The results showed that 2003 CAP reform and the implementation of Alqueva
irrigation project lead to significant changes in the traditional agricultural model.
However these changes are not determinant for long run farms competitiveness. The
competitiveness is dependent on farmers’ adoption of new technologies and activities,
such as vineyard, olives, industrial fruits and legumes.
(Corresponding author:) Maria José Palma Lampreia Dos Santos, Agricultural College of Coimbra - Centre of Natural Resources Environment and Society (CERNAS), Rua Dr. António Trindade, Lote 6ºdto, 6000-351 Castelo Branco, Portugal. Email: mjpls1963@gmail.com
Rui Manuel de Sousa Fragoso, University of Évora – Department of Management, Institute of Mediterranean Agricultural and Environmental Sciences (ICAAM), Centre for Advanced Studies in Management and Economics (CEFAGE), Évora, Portugal. Email: rfragoso@uevora.pt
Pedro Damião de Sousa Henriques, University of Évora - Department of Economics, Centre for Advanced Studies in Management and Economics (CEFAGE), Évora, Portugal. Email: pdamiao@evora.pt
Maria Leonor da Silva Carvalho, University of Évora – Department of Economics, Institute of Mediterranean Agricultural and Environmental Sciences (ICAAM), Centre for Advanced Studies in Management and Economics (CEFAGE), Évora, Portugal. Email: leonor@evora.pt
Key-Words: Irrigation, multi-period programming, competitiveness, Common Agricultural
Policy.
1. Introduction
The Alqueva project under construction in the Alentejo region, Southern of Portugal, has multiple goals, namely agricultural irrigation, supply of water for public consumption, production of hydro-electricity, and touristic and environmental activities. The most important is the hydro-agricultural component that includes the implementation of 110,000 hectares of new irrigated land in the biggest Portuguese agrarian region, with Mediterranean agro-climatic conditions. The conversion of dry to irrigated land will create many opportunities, but it will also involve some challenges and risks. The most important opportunities are the potential for increasing the actual level of productivity and the adoption of a new cropping pattern. Both will be possible because Alentejo farm’s structure is, in general, composed of large farms having good potential for innovation (Dos-Santos, 2008). The principal challenges are the farmer’s capacity in converting dry to irrigated land under the conditions of CAP 2003 Reform and Water Framework Directive.
During the last decades, Alentejo agriculture was based on dry land extensive farming systems, mainly cereals and beef production. These systems were, partially, encouraged by past CAP policies that encouraged subsidized agricultural activities and not free market competitiveness (Fragoso and Marques, 2007).
Following the 1992 Mac Sharry reform, direct payments to EU farmers were introduced and became an integral part of the CAP. In arable land and beef sectors, farmers were directly and partially compensated for income losses from reduction on intervention prices, becoming direct payments an important source of income. The shift away from price support in favour of direct income support was further advanced in the Agenda 2000 Agreement. However, direct payments did remain coupled to production for arable crops, beef cattle and milk, though lately a progressive decoupling was observed (Breen et al., 2005).
The Luxembourg Agreement on the 2003 CAP reform allowed for the decoupling of all direct payments. Since 2005, decoupling rules are applied in Portugal to arable crops and partially to sheep. With decoupling, farmers receive a Single Farm Payment (SFP) regardless of their production decisions as long as land use is maintained in accordance with basic standards for the environment, food safety, animal health and welfare, and good agricultural and environmental conditions. Decoupling payments reduce the links between agricultural support and production, removing incentives to production intensification and giving to farmers increasing freedom on farming decisions.
Following the 2003 CAP reform, the European Commission adopted, in 2008, the Health Check (HC) aiming to prepare the CAP financial framework for 2013. To achieve this, some adjustments in the 2003 CAP reform were made, such as an increase in modulation in the SFP
which will lead to a progressive reduction of its value per farm by the end of 2013. This amount was transferred to the CAP second Pilar (Arfini et al., 2008). This measure can have strong impact on Alentejo agriculture because this region receives about 43.3% of total Portuguese CAP support measures.
Several studies analysing the EU agricultural reforms have been made, among others, Gohin and Latruffe (2006) and Matthews et al. (2006). In Portugal, Fragoso and Marques (2007), Dos Santos (2008), Dos Santos et al. (2009) have studied the impact of 2003 CAP reform in Alqueva irrigation project.
The increasing water demand in EU demonstrated the growing shortage of this natural resource and encouraged an intense discussion about the efficiency of water use. This led to the approval of Directive 2000/60/CE, which established a framework for EU action in the field of water policy, the Water Framework Directive (WFD). There is no doubt that one of the most important topics of this directive is the article 9 related to water pricing, proposed as the main economic instrument for dealing with the scarcity of water in the EU. The WFD establishes the appropriateness of using water pricing in order to provide adequate incentives for users to use water resources efficiently, and thereby contribute to the environmental objectives of this Directive (Riesgo and Gómez-Limón, 2006).
The WFD suggests the application of a full cost recovery policy for water services, considering environmental and social issues. This policy asks for the introduction or an increase in water prices. According to neoclassical economic theory, farmers will reduce water demand taking into consideration their agricultural water derived demand. The consequences for the Alqueva irrigation scheme could be a reduction on farms competitiveness. Bartolini et al. (2007), in Italian least intensive irrigated systems, concluded that water pricing, though appearing to be an effective instrument for water regulation, has in most cases less impact than agricultural markets and policy. Moreover, Riesgo and Gomez-Limon (2006) highlighted that water pricing and agricultural policy need to be closely coordinated in order to meet the EU’s policy objectives for the irrigation of the agricultural sector.
Taking into account what was stated above, the main objective of this paper is to analyse the competitiveness of farms in a sub-system of the Alqueva project, the irrigation scheme of Monte Novo (ISMN). This analysis uses a multi-period programming approach to measure the impact, at farm level, on resource allocation and profitability, of the scenarios under the 2003 CAP reform, the HC and the WFD.
The paper is structured as follows: section 2 describes the selection of the farms type used, section 3 presents the multi-period programming model utilized, section 4 discusses the results, and finally the main conclusions are reported in section 5.
2. Farm's Typologies in the Irrigation Scheme of Monte Novo
The ISMN project, part of the Alqueva project, covers around 25,000 hectares where 7,100 have irrigation potential. The number of total farms is 112 with an average utilized agricultural area (UAA) of 229 hectares which is 4.1 and 18 times the Alentejo and the national average area, respectively. The agro-climatologic characteristics are Mediterranean, characterized by water shortages in Summer, a high number of daily hours of sunshine and soils with good conditions for irrigation.
Data collection was conducted through interviews applied to a sample of 30 farmers. The classification and identification of the ISMN farms typologies was done using multivariate techniques, cluster and discriminant analysis. Cluster analysis was used to form homogeneous groups of farms and discriminant analysis to identify and characterize the representative farms.
The cluster analysis identified three groups of homogeneous farms or clusters. The factors that most contributed to distinguish farms were structural and farmers characteristics and production orientation. Structural variables included the UAA, the utilized irrigated area per farm (UIA), the private UIA per farm, the number of tractors and agricultural labour force (ALF). For the farmer, the relevant characteristics were age, education and farmers information sources. Relatively to production orientation, irrigation systems and the relative economic importance of livestock were considered.
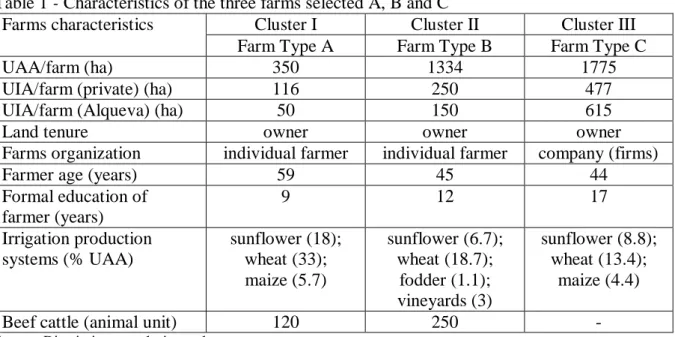
Cluster I, called smaller farmers, includes farms with an UAA varying from 50 to 450 ha. Farmers are less skilled and older when compared to the other clusters, with an average of 8 years of formal education and 59 years of age. Irrigated production systems consist mainly of crops and oilseeds, with a small number of farms having irrigated maize and vineyards.
Cluster II, named entrepreneurs’ farmers, includes farms ranging from 450 to 1400 ha of UAA. Farmers are moderately skilled and relatively young. On average, farmers have 13 years of education and are 47 years old. The irrigation systems of production have cereal crops and oilseed, vineyards, olive groves and beef cattle activities.
Cluster III, called consolidated agricultural companies, is formed by the larger UAA farms, more than 1400 ha. These companies have a complex and solid organizational structure. The managers are the youngest and the most skilled; on average are 46 years old and have a bachelor degree. When compared with the other clusters, irrigated production systems have more investment in vineyard (1.7%) and in irrigated olive groves (0.3 %) and smaller areas of irrigated wheat and cattle production.
A discriminant analysis was performed to select the representative farms for each one of the clusters. Thediscriminant functions, Z1 and Z2, are:
. 16 10 9 2 1 18 16 14 13 10 9 2 0.021X 0.158X 0.300X 0.186X 0.088X 1.067 Z2 0.043X 0.026X 0.044X 0.035X 0.574X 0.273X 0.026X 3.469 Z1
The variables with higher discriminatory power, in Z1, are the UIA per farm(X9), the number of livestock (X10), the surface of irrigated wheat (X13), the surface of irrigated vineyard (X14), the long-term loans (X16 )and farmer’s training level (X18), while for Z2 the variables are farmer’s age(X1 ), farmer’s education level(X2 ), the UIA per farm(X9 ), the cattle number (X10) and long-term loans(X16 ).
The Mahalanobis Squared Distance was used to identify the farm types, A, B and C, representing each one of the clusters. Table 1 shows the principal characteristics of each one of the farm types selected.
Table 1 - Characteristics of the three farms selected A, B and C
Farms characteristics Cluster I Cluster II Cluster III
Farm Type A Farm Type B Farm Type C
UAA/farm (ha) 350 1334 1775
UIA/farm (private) (ha) 116 250 477
UIA/farm (Alqueva) (ha) 50 150 615
Land tenure owner owner owner
Farms organization individual farmer individual farmer company (firms)
Farmer age (years) 59 45 44
Formal education of farmer (years) 9 12 17 Irrigation production systems (% UAA) sunflower (18); wheat (33); maize (5.7) sunflower (6.7); wheat (18.7); fodder (1.1); vineyards (3) sunflower (8.8); wheat (13.4); maize (4.4)
Beef cattle (animal unit) 120 250 -
Source: Discriminant analysis results.
3. The multi-period mathematical programming approach
Mathematical programming models are widely applied in agricultural economics (Hazell and Norton, 1986; Howitt, 2005; López-Baldovín et al., 2006). This study uses a multi-period mathematical programming model (MMP), which allows accommodating the long run effects of investments and the policy trends on farms. Usually, structural changes occur gradually and the effects on agricultural competitiveness can be better evaluated if the model include the inter-temporal decision making process (Henriques, 1997; Dos-Santos, 2008).
The MMP model follows the assumptions of Hazell and Norton, (1986) and is based on Blanco (1996), Henriques (1997), Fragoso and Marques (2006) and Dos-Santos (2008). The objective function considers the farmers preferences between present and future consumption, representing the initial situation of the farmers and including the final conditions which reflect the net assets value at the end of time horizon. So, the model solution provides the adjustments on crop patterns and resource allocation, and on farm’s net assets under the CAP 2003, the HC and WFD scenarios.
The goal is to determine the optimal crop patterns, investments and financial flows, and resource allocation that maximize the farmer’s wealth at minimum risk. All decisions are taken considering the annual cash-flow variability and the perception of having or not enough water to put into practice the production plan. Farmer’s strategies comprise not only irrigated crops, but also the replacement of irrigated crops by rain-fed crops and the reinforcement or cessation of agricultural farming activities.
3.1. The objective function
The objective function (Z) maximizes the net present value of the producer consumption plus the final value of net assets (A) and minimizes the present value of standard deviation of annual flows (equation 1). The annual producer consumption depends on annual cash-flows (Cn) and on marginal propensity to consumption (β). According to Henriques (1997),
the marginal propensity to consumption was fixed in 60% of the annual cash flow value. Thus, 40% of annual cash flow goes to accumulated savings. The risk is given by the
coefficient of risk aversion () and by the standard deviation of annual cash flow (σn). The
discount rate used to calculate the present value was 2%, which represents the opportunity cost of capital into a market without risk. For the length of time horizon, it was considered a period of ten years (n=1,..,10) from 2004 to 2014. This period is close to the useful life of most of investments and its beginning coincides with the availability of data used for the model validation. N n n n n i A C Max Z 1 (1 ) 1 (1) 3.2. The risk
The coefficient is usually interpreted as a risk marginal rate and the variable σn is calculated
in (2) as the annual negative deviations of cash-flow by state of nature. Five states of nature (t) refer to technical, soil and climate production conditions and the remaining three states of nature (f) to the market conditions. Together, it was considered the outputs and the probability (ptf) of fifteen states of nature.
T t F f t f n n T t F f f t n p C C 1 1 2 , 1 1 ) ( (2)
Another source of risk in ISMN is water availability. Equation (3) shows that water consumption must be less than or equal to water availability. Water consumption is calculated according with the crop demand for water (hj) and crop area (Xjn), where j is crop type by
irrigation system. Annual water availability comes from private irrigation schemes in farms (Q) and from the project of Alqueva (w).
w Q X h J j j n j 1 (3)
The sources of water in private irrigation schemes are small dams, which have high annual variability levels. This implies that there is high probability of producers not having enough water to meet their average annual demands. To overcome this, the method of probabilistic constraints (Varela-Ortega et al., 1998 and Fragoso and Marques, 2006) was used. This method assumes that farmers will choose the most feasible production plan.
The normal stochastic parameter Q is calculated in (4), on the basis of expected annual water availability from private irrigation schemes E(q) and on its deviations (Kα
σq). The αcoefficient is the probability of having an water availability below the mean value,
σ
q is the standard deviation of annual water availability and Kα is the percentile of the standardizednormal distribution. According to the relative frequency of water availability, a value of 0.60 was used for α.
q k q E Q ( ) (4) 3.3. Decision variables
The decision variables of the model includes crop area and beef cattle heads, investments, loans and resource transfers activities between the different annual periods. Crop activities include dryland activities such as cereals, oilseeds, fodder and pastures, and a wide range of irrigated activities like industrial and horticultural crops (tomatoes, peppers and sugar beet, melons, onions and potatoes), orchards (apple and plum), Mediterranean crops (olive,
vineyards and grapes), cereals and oilseeds. In addition, for most of the crops a set of environmental technologies, such as the direct seeding, was considered.
Investment is a variable related with the structural investments that have influence on farmers’ strategy. Investment includes equipment and machinery, irrigation equipment, orchard and Mediterranean crops and beef cattle.
According to expression (5), the initial assets capacity (ia), the investment made in the previous n-k years (In-k) and the investment made in the same year (In) should satisfy the
requirements of the farmers’ production strategy, which are given by crop area and beef cattle activities (Xjn) and by technical coefficients nij.
n k n j n k J j j n jX ia I I ni 1 1 (5)
Loans and resource transfer activities depend on financial resources allocation in short and long-term, which means that the modelling process takes into account liquidity (6) and solvability (7) of the farm. In the short term, cash balance from the previous period (Bn-1) and
short-term loans (SLn) guarantee the payment of operational expenses with crops and beef
cattle activities, the repayment and interest of previous year short-term loans at a rate tx, and other expenses (OEn), like the annuity payment of long-term loans and the farmer’s wage.
n n J j j j n n SL e X tx SL OE B n 1 (1 ) 1 (6)
In the long term, investments are funded by savings (SCn), long term loans (LLn) and
investment subsidies (SIn). Savings available to investments are calculated each year as the
difference between accumulated savings and savings used in the previous years.
n n n k n n n k n n n IC SI LL SC C 1 1 1 ) 1 ( (7) 3.4. Model constraints
The MMP model considers a set of constraints in order to represent technical, institutional, economic, and environmental conditions of the ISMN farms. This includes arable and irrigated land, labour force and herd nutritional requirement constraints. In addition, the model includes agronomic, market and CAP constraints, which bound some crop areas. The constraints considered take into account the trade-off between model predictive power and model adherence to reality as highlighted by Howitt (2005). If too constrained, the model shows a higher adherence to reality, but its predictive power is lower while a, less constrained model does not exhibit such a fine adherence, but its predictive capacities are further enhanced.
3.5. Model calibration and validation
The parameterization of the coefficient was done in order to reflect farmer’s behaviour towards risk. For the three farms studied (A, B and C), assumed the values of 0.20, 0.50 and 1.00, which represent different levels of risk aversion. The parameterization results showed that 0.20 was the best value for the coefficient
According to McCarl and Apland (1986), the results of the three farm models were compared with the base year data, 2004, in order to test their robustness. For this purpose, the percentage absolute deviation (PAD) was calculated for crop and livestock activities, main economic results and resource allocation of land, labour, capital and irrigation water. The results showed that the model presents a good adherence to the reality. The average PAD was 1.4%, 0.8%, and 9.4% for A, B and C farms, respectively. According to Hazell and Norton (1986), the three models can be considered calibrated and accepted as a valid instrument for performing further economic analysis.
3.6. Model scenarios
In order to analyse the competitiveness of the three farms of the ISMN, the scenarios described below were studied.
Scenario 1 - Represents the baseline situation in which the farms operate under the institutional framework of Agenda 2000; water supply is only from the private irrigation schemes; and production is limited to traditional crops such as oilseeds, cereals, fodder and pasture.
Scenario 2 - Introduces the middle term CAP reform of 2003 and the Health Check; water supply and production conditions are similar to scenario 1.
Scenario 3 - Introduces water from the public Alqueva irrigation project; production conditions are similar to scenario 1; policy conditions are equal to scenario 2.
Scenario 4 - Introduces alternative crops and technologies (like industrial horticultural crops, fruits, Mediterranean cultures, cereals and oilseeds, as well as, environmental friendly technologies); policy conditions are equal to scenario 2; water supply from private and public sources.
4. Results and discussion
For each one of the three farms types, the model was run under the four scenarios presented above. The results were analysed, first in terms of cropping mix patterns and use of resources, and then in terms of economic performance. The evolution of irrigated land and cropping pattern are discussed over the time horizon. The farms’ economic performance are measured using the present value of producer consumption and net assets (PVNA), the annual net income (ANI), the total agricultural investment (TAI), the long-term loans (LTL) and the ratio subsidies/revenue.
4.1. Cropping mix patterns and use of resources
The evolution of irrigated land over the time horizon, on farms type A, B and C for each one of the four scenarios studied can be seen on Figures 1, 2 and 3 and on Tables A1, A2 and A3 in the appendix. In scenario 1, the irrigated land represents 33%, 19% and 27% of utilized agricultural area (UAA) on farms type A, B and C, respectively. However, in farm type A this percentage is only 24% at the end of the time horizon due to a reduction on sunflower area. Irrigated land is occupied mainly with wheat, maize and sunflower and with a small area of vineyards in farm type B. In farm types A and B, dry land is fully occupied with pasture and fodder which are utilized by beef cattle, 120 and 250 heads, respectively. In farm type C, dry land is cultivated exclusively with wheat and oilseed.
0 5 10 15 20 25 30 35 1 2 3 4 5 6 7 8 9 10 Ir ri g a te d l a n d i n % o f U A A
Time horizon (year)
Scenario 1 Scenario 2 Scenario 3 Scenario 4
Figure 1. Evolution of irrigated land in farm type A by model scenarios
Source: Model results.
In scenario 2, irrigated land is drastically reduced and livestock production, namely beef cattle activities and pasture and fodder crops, are reinforced. In farm type A, irrigated crops account for only 10% of UAA while in farm type B the percentage decreases from 18% to 3% (just vineyard) at the end of the time horizon. In the case of farm type C, irrigated crops are completely abandoned. 0 2 4 6 8 10 12 14 16 18 20 1 2 3 4 5 6 7 8 9 10 Ir ri g a te d l a n d i n % o f U A A
Time horizon (year)
Scenario 1 Scenario 2 Scenario 3 Scenario 4
Figure 2. Evolution of irrigated land in farm type B by model scenarios
0 5 10 15 20 25 30 35 40 1 2 3 4 5 6 7 8 9 10 Ir ri g a te d l a n d i n % o f U A A
Time horizon (year)
Scenario 1 Scenario 2 Scenario 3 Scenario 4
Figure 3. Evolution of irrigated land in farm type C by model scenarios
Source: Model results.
The model scenario 3 represents an important increasing on water and land available to irrigation and the results are not much different from the ones observed for scenario 2. For farms type A and B, irrigated land represents 24% and 19% of UAA at the beginning of time horizon, but these percentages fall to 8.6% and 3.5%, respectively, due to WFD dispositions on water prices increases. At the same time, pasture and fodder crop areas and beef cattle activities increase, though, this last activity is reduced at the end of the time horizon. This scenario has good structural conditions for irrigation, but it is not possible to profit from the economic potential of the Alqueva project and neither to promote farm competitiveness. The model scenario 4 introduces the possibility of farmers to adopt new agricultural technologies. This is reflected in a positive economic impact with improved levels of agricultural resources use. In this scenario, irrigated land grows to 25%, 19% and 35% of UAA in farms type A, B and C, respectively, even with water price rising due to WFD dispositions. Traditional irrigation crop pattern composed by cereals and/or fodder crops is replaced by Mediterranean crops, orchard, and industrial and horticultural crops.
Mediterranean crops are vineyards, grapes and olive, occupying, respectively, between 0.7% and 3%, 3% and 7%, and 6% and 9% of UAA. In the case of industrial crops, the main areas are sugar beet (5% to 7% of UAA) and tomatoes (0.2% to 3.4% of UAA). The most important horticulture crops are potatoes and onions, representing 4% to 7% of UAA, and 0.2% to 2.5% of UAA, respectively. The technologies of reduced tillage and direct seeding are largely adopted. After the third year of the time horizon, industrial crop areas are replaced by horticultural crops due to the decreasing on CAP supports on sugar beet and tomatoes. Beef cattle still plays an important role on the economy of ISMN, but a reduction around 28% in farms type A and B is observed. These changes lead to duplication of agricultural employment in farms type A and B and tripling in farm type C.
4.2 Economics results
Figures 4, 5 and 6 and Tables A1, A2 and A3 in the appendix present the PVNA, the TAI and the loans in farm types A, B and C for each one of the model scenarios considered.
0 50 100 150 200 250 300 350 400 450 500
Scenario 1 Scenario 2 Scenario 3 Scenario 4
T h o u s an d E u ro s PVNA TAI LTL
Figure 4. Economic results in farm type A by model scenarios
Source: Model Results.
In scenario 1, the PVNA of farm type A is 456 thousand euro and the TAI, which is entirely financed with savings, is 174.5 thousand euro. The ANI over the time horizon is between 49.7 and 46.2 thousand euro and the current subsidies represent between 65% and 42% of revenues. In farm type B, the PVNA reaches 1,284 thousand euro, the TAI is 818 thousand euro and the LTL represents 12% of the TAI. The ANI varies between 116 and 133.7 thousand euro, representing current subsidies more than 40% of revenues. In farm type C, the PVNA is 641.4 thousand euro, the TAI is 1,816 thousand euro and the LTL represents 41% of the TAI. The ANI is 386 thousand euro in the first year of the time horizon, but decreases successively until 200 thousand euro.
0 200 400 600 800 1.000 1.200 1.400 1.600 1.800
Scenario 1 Scenario 2 Scenario 3 Scenario 4
T h o u s an d E u ro s PVNA TI LTL
Figure 5. Economic results in farm type B by model scenarios
0 1.000 2.000 3.000 4.000 5.000 6.000 7.000 8.000
Scenario 1 Scenario 2 Scenario 3 Scenario 4
T h o u s an d E u ro s PVNA TAI LTL
Figure 6. Economic results in farm C by model scenarios
Source: Model Results.
In scenario 2, which introduces the SFP and the decoupling of agricultural supports, there is a general decline on the economic results, mainly due to the adoption of extensive crop patterns and the abandonment of irrigated crops. This scenario leads to a decrease on the PVNA of 18.5% and 47%, and on the TAI of 47% and 92% on farms type A and B, respectively. In farms type C, the PVNA doubles, the TAI is reduced to almost half of its value and the LTL falls dramatically. At the end of the time horizon most revenues are mainly from the SFP. In scenario 3, the Alqueva project did not bring the expected effects when compared with scenario 1. The PVNA decreases 10% and 1% in farms type A and B, respectively, due to the investment done in beef cattle and irrigation and which increase the TAI and the dependence from the LTL. For farms type C, the results are similar to scenario 2, with slight improvements on economic results and therefore on farm competitiveness. These results show that the removal of resource constraints, in this case water supply, is not enough to improve income and, as shown in scenario 4, new technologies and activities are required.
Model scenario 4 has important economic effects and a positive impact on farm competitiveness levels. Comparing with model scenario 1, the PVNA is maintained in farms type A, grows 25% in farms type B and more than eleven times in farm type C. The TI almost doubles in all farms type, increasing its dependence from borrowed capital as well as from the costs with interests. When compared to scenario 2, the PVNA increases 23% in farms type A, almost 4 times in farms type B and more than 6 times in farms type C. When compared with model scenario 3, the adoption of alternative agricultural technologies provides an increase on PVNA of 12%, 34% and more than 6 times in farms type A, B and C, respectively.
5. Conclusions
The results allow to conclude that the introduction of the Single Farm Payment scheme, the reinforcement of the decoupling supports in the Common Agricultural Policy review of 2003 and in the Health Check in 2009, lead to an extensification on agricultural systems, reduction of the economic results and weakness on farms competitiveness levels. These results are
similar to Coelho (2005), who refers this risk of arable land abandonment due to decoupling agricultural supports.
The new structures of the Alqueva irrigation project do not provide the needed stimulus to meet the new challenges of the evolution of the Common Agricultural Policy. Traditional activities of cereals, oilseed, pastures and fodder do not have the level of competitiveness able to give better returns to agricultural resources, particularly to water and irrigated land.
Otherwise, the adoption of alternative agricultural technologies, such as industrial and horticultural crops, orchards, Mediterranean crops and direct seeding and reduced tillage, could bring important positive economic effects such as higher returns and better resources allocation, which allow to maintain or increase the farm competiveness in the Irrigation Scheme of Monte Novo and in the Alqueva project.
Despite this enormous potential, the effects depend on resources and capital structure of farms. Smaller farms have more difficulties in adopting alternative technologies, due to their financial constraints and to the shortage on technical and management knowledge. Therefore, a review of financial policies and credit access for small and medium farmers, as well as the technical and management assistance policy is demanded.
The study concludes that Common Agricultural Policy trends to reinforce the decoupling of agricultural support have more influence on farmers’ decisions than the Water Directive Framework guidelines. The negative effects of increases on water pricing can be accommodated with the adoption of more profitable irrigated systems with less demand for water, such as for vineyards and olives.
In this case, one of the main difficulties is related with the limitations of the microeconomic analysis to treat problems involving the management of common resources, such as water in public irrigation structures. Future developments should address the effects of water pricing on the competitiveness of farms considering alternative schemes of water rates for irrigation. References
Arfini, F., Donati, M., Petricione, G.; Solazzo, R., 2008. An Impact Assessment of the Future CAP Reform on the Italian Sector. 109th EAAE Seminar. (Accessed on 16/09/2009). ageconsearch.umn.edu/bitstream/44831/2/4.1.3_Donati.pdf.
Bartolini, F., Bazzani, G.M., Gallerani, V., Raggi, M., Viaggi, D., 2007. The impact of water and agriculture policy scenarios on irrigated farming systems in Italy: An analysis based on farm level multi-atribute linear programming models, Agricultural Systems, 93 (1), 90-114. Blanco, M.F., 1996. Analyse des Impacts Socio-économiques et les Effets sur L´Environnement des Politiques Agricoles: Modélisation de L´Utilisation Agricole des Ressources en Eau Dans la Région Espagnole de Castille-Léon. CIHEAM – Institute Agronomique Méditerranéen de Montpellier. Collection Thèses & Masters, 32, Montpellier. Breen, J.P., Hennessy, T.C., Thorne, F.S., 2005. The Effect of Decoupling on the Decision to Produce: An Irish Case Study, Food Policy, 30, 129-144.
Coelho L.A.G., 2005. Decisão em Contexto de Incerteza: O Comportamento dos Agricultores na Região de Sequeiro do Alentejo Face à Reforma Intercalar da Política Agrícola Comum. Tese de Doutoramento. Universidade de Évora, Évora.
Directive 2000/60/EC. 2000. Directive 2000/60/EC of the European Parliament and of the Council of 23 October 2000 establishing a framework for Community action in the field of water policy. Directory Classification Code: Environment, consumers and health protection - Environment - Pollution and nuisances - Water protection and management. Official Journal L 327 , 22/12/2000 P. 0001 - 0073 . OJ L 327/1, 22.12.2000, pp.1-72.
Dos-Santos, M.J.P.L.,2008. Análise da Competitividade do Regadio de Alqueva: O Caso do Perímetro de Rega do Monte Novo, Tese de Doutoramento, Universidade de Évora, Évora. Dos-Santos, M.J.P.L., Henriques, P.D.S., Fragoso, R.M.S., Silva-Carvalho, M.L.P.V., 2009. A competitividade do regadio de Alqueva: O caso do Perímetro de Rega do Monte Novo a Sul de Portugal. XLVII SOBER - Congresso da Sociedade Brasileira de Economia, Administração e Sociologia Rural. Brasil.
Fragoso, R., Marques, C., 2006. A Revisão da Política de Tarifas de Água no Uso Agrícola: Um Estudo de Caso no Sul de Portugal. Proceeding Conference do XLIV SOBER. Brasil. Fragoso, R., Marques, C., 2007. A Competitividade do Regadio em Portugal no Contexto da Nova Política Agrícola Comum: O Caso de uma Exploração Agrícola no Alentejo, Revista de Economia e Sociologia Rural, 45, (1), 49-70.
Gohin, A. Latruffe, L., 2006. The Luxembourg common agricultural policy reform and the European food industries: What's at stake?, Canadian Journal of Agricultural Economics, 54(1), 175-194.
Hazell, P.B.R.; Norton, R.D., 1986. Mathematical Programming Economics Analyses in Agriculture. McMillan Publishing Company, New York, U.S.A.
Henriques, P.D.S., 1997. Technical Efficiency and Changes in Alentejan Farming Systems. PhD Thesis, University of Reading, Reading, UK.
Howitt, R.E. 2005. Agricultural and environmental policy models: Calibration, Estimation and Optimization. Available for download in pfd form from the author's webpage. (Accessed on 16/06/2008).
López-Baldovin, M.J., Gutiérrez-Martin, C., Berbel, J., 2006. Multicriteria and multiperiod programming for scenario analysis in Guadalquivir river irrigated farming, Journal of the Operational Research Society, 57(5), 499-509.
Matthews, K.B., Wright, I.A., Buchan, K., Davies, D.A., Schwarz, G., 2006. Assessing the options for upland livestock systems under CAP reform: Developing and applying a livestock systems, Agricultural Systems, 90 (1), 32-61.
McCarl, B.A., Apland, J., 1986. Validation of linear programming models, Southern Journal of Agricultural Economics, 18, 155-164.
Riesgo, L., Gomez-Limon, J.A., 2006. Multi-criteria policy scenario analysis for public regulation of irrigated agriculture, Agricultural Systems, 91 (1), 1-28.
Varela-Ortega, C., Sumpsi, M.J., Garrido, A., Blanco, M.; Iglesias, E., 1998. Water Pricing Policies, Public Decision Making and Farmer’s Response: Implications for Water Policy, Agricultural Economics, 19, (1), 193-202.
APPENDIX
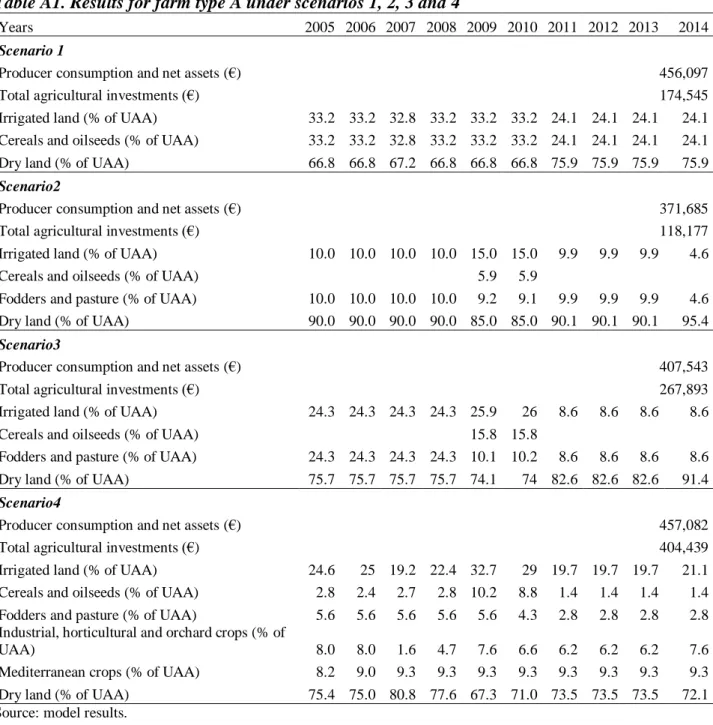
Table A1. Results for farm type A under scenarios 1, 2, 3 and 4
Years 2005 2006 2007 2008 2009 2010 2011 2012 2013 2014
Scenario 1
Producer consumption and net assets (€) 456,097
Total agricultural investments (€) 174,545
Irrigated land (% of UAA) 33.2 33.2 32.8 33.2 33.2 33.2 24.1 24.1 24.1 24.1
Cereals and oilseeds (% of UAA) 33.2 33.2 32.8 33.2 33.2 33.2 24.1 24.1 24.1 24.1
Dry land (% of UAA) 66.8 66.8 67.2 66.8 66.8 66.8 75.9 75.9 75.9 75.9
Scenario2
Producer consumption and net assets (€) 371,685
Total agricultural investments (€) 118,177
Irrigated land (% of UAA) 10.0 10.0 10.0 10.0 15.0 15.0 9.9 9.9 9.9 4.6
Cereals and oilseeds (% of UAA) 5.9 5.9
Fodders and pasture (% of UAA) 10.0 10.0 10.0 10.0 9.2 9.1 9.9 9.9 9.9 4.6
Dry land (% of UAA) 90.0 90.0 90.0 90.0 85.0 85.0 90.1 90.1 90.1 95.4
Scenario3
Producer consumption and net assets (€) 407,543
Total agricultural investments (€) 267,893
Irrigated land (% of UAA) 24.3 24.3 24.3 24.3 25.9 26 8.6 8.6 8.6 8.6
Cereals and oilseeds (% of UAA) 15.8 15.8
Fodders and pasture (% of UAA) 24.3 24.3 24.3 24.3 10.1 10.2 8.6 8.6 8.6 8.6
Dry land (% of UAA) 75.7 75.7 75.7 75.7 74.1 74 82.6 82.6 82.6 91.4
Scenario4
Producer consumption and net assets (€) 457,082
Total agricultural investments (€) 404,439
Irrigated land (% of UAA) 24.6 25 19.2 22.4 32.7 29 19.7 19.7 19.7 21.1
Cereals and oilseeds (% of UAA) 2.8 2.4 2.7 2.8 10.2 8.8 1.4 1.4 1.4 1.4
Fodders and pasture (% of UAA) 5.6 5.6 5.6 5.6 5.6 4.3 2.8 2.8 2.8 2.8
Industrial, horticultural and orchard crops (% of
UAA) 8.0 8.0 1.6 4.7 7.6 6.6 6.2 6.2 6.2 7.6
Mediterranean crops (% of UAA) 8.2 9.0 9.3 9.3 9.3 9.3 9.3 9.3 9.3 9.3
Dry land (% of UAA) 75.4 75.0 80.8 77.6 67.3 71.0 73.5 73.5 73.5 72.1
Source: model results.
Table A2. Results for farm type B under scenarios 1, 2, 3 and 4
Anos 2005 2006 2007 2008 2009 2010 2011 2012 2013 2014
Scenario 1
Producer consumption and net assets (€) 1,283,784
Total agricultural investments (€) 818,115
Irrigated land (% of UAA) 18.7 18.7 18.7 18.7 18.7 18.7 18.7 18.7 18.7 18.7 Cereals and oilseeds (% of UAA) 14.6 14.6 14.6 14.6 14.6 14.6 14.6 14.6 14.6 14.6
Fodders and pasture (% of UAA) 1.1 1.1 1.1 1.1 1.1 1.1 1.1 1.1 1.1 1.1
Mediterranean crops (% of UAA) 3.0 3.0 3.0 3.0 3.0 3.0 3.0 3.0 3.0 3.0
Dry land (% of UAA) 81.3 81.3 81.3 81.3 81.3 81.3 81.3 81.3 81.3 81.3
Scenario 2
Producer consumption and net assets (€) 449,821
Total agricultural investments (€) 64,072
Irrigated land (% of UAA) 18.8 18.8 9.0 9.0 8.6 8.6 8.3 3.0 3.0 3.0
Cereals and oilseeds (% of UAA) 14.6 14.6 3.8 3.8 3.3 3.3 3.0
Fodders and pasture (% of UAA) 1.2 1.2 2.2 2.2 2.3 2.3 2.3
Mediterranean crops (% of UAA) 3.0 3.0 3.0 3.0 3.0 3.0 3.0 3.0 3.0 3.0
Dry land (% of UAA) 45.1 45.1 39.6 39.6 5.5 5.5 5.7 6.9 5.3 5.3
Scenario 3
Producer consumption and net assets (€) 1,269,311
Total agricultural investments (€) 576,434
Irrigated land (% of UAA) 18.8 18.8 9.0 9.0 9.0 9.0 9.0 3.5 3.5 3.5
Cereals and oilseeds (% of UAA) 7.3 7.5 5.5 5.5 5.5
Fodders and pasture (% of UAA) 8.5 8.3 6.0 6.0 0.5 0.5 0.5 0.5 0.5 0.5
Mediterranean crops (% of UAA) 3.0 3.0 3.0 3.0 3.0 3.0 3.0 3.0 3.0 3.0
Dry land (% of UAA) 81.2 81.2 91.0 91.0 91.0 91.0 91 96.5 96.5 96.5
Scenario 4
Producer consumption and net assets (€) 1,701,404
Total agricultural investments (€) 1,334,031
Irrigated land (% of UAA) 18.7 18.8 18.8 18.8 16.6 16.6 16.5 15.4 15.4 15.4
Fodders and pasture (% of UAA) 3.4 2.6 2.8 2.8 0.4 0.4 0.3 0.1 0.1 0.1
Industrial, horticultural and orchard crops
(% of UAA) 7.3 7.2 7.0 7.0 7.2 7.2 7.2 6.3 6.3 6.3
Mediterranean crops (% of UAA) 8.0 9.0 9.0 9.0 9.0 9.0 9.0 9.0 9.0 9.0
Dry land (% of UAA) 44.8 49.1 39.1 39.1 5.8 5.4 5.3 6.5 6.5 6.5
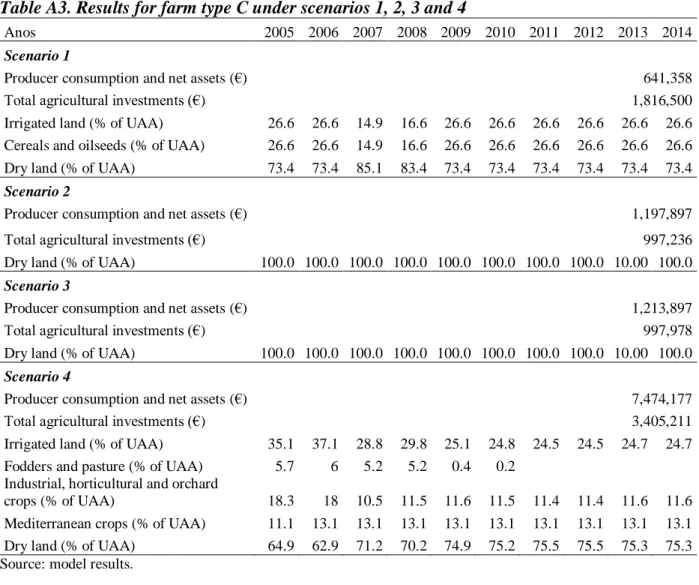
Table A3. Results for farm type C under scenarios 1, 2, 3 and 4
Anos 2005 2006 2007 2008 2009 2010 2011 2012 2013 2014
Scenario 1
Producer consumption and net assets (€) 641,358
Total agricultural investments (€) 1,816,500
Irrigated land (% of UAA) 26.6 26.6 14.9 16.6 26.6 26.6 26.6 26.6 26.6 26.6 Cereals and oilseeds (% of UAA) 26.6 26.6 14.9 16.6 26.6 26.6 26.6 26.6 26.6 26.6
Dry land (% of UAA) 73.4 73.4 85.1 83.4 73.4 73.4 73.4 73.4 73.4 73.4
Scenario 2
Producer consumption and net assets (€) 1,197,897
Total agricultural investments (€) 997,236
Dry land (% of UAA) 100.0 100.0 100.0 100.0 100.0 100.0 100.0 100.0 10.00 100.0
Scenario 3
Producer consumption and net assets (€) 1,213,897
Total agricultural investments (€) 997,978
Dry land (% of UAA) 100.0 100.0 100.0 100.0 100.0 100.0 100.0 100.0 10.00 100.0
Scenario 4
Producer consumption and net assets (€) 7,474,177
Total agricultural investments (€) 3,405,211
Irrigated land (% of UAA) 35.1 37.1 28.8 29.8 25.1 24.8 24.5 24.5 24.7 24.7
Fodders and pasture (% of UAA) 5.7 6 5.2 5.2 0.4 0.2
Industrial, horticultural and orchard
crops (% of UAA) 18.3 18 10.5 11.5 11.6 11.5 11.4 11.4 11.6 11.6
Mediterranean crops (% of UAA) 11.1 13.1 13.1 13.1 13.1 13.1 13.1 13.1 13.1 13.1
Dry land (% of UAA) 64.9 62.9 71.2 70.2 74.9 75.2 75.5 75.5 75.3 75.3