Bruno Galhardo on behalf of the ATLAS collaboration
LIP, Departamento de F´ısica, Universidade de Coimbra, 3004-516 Coimbra, Portugal DOI: http://dx.doi.org/10.3204/DESY-PROC-2014-02/53
The top quark is the heaviest elementary particle known and has such a small lifetime that it decays before hadronization occurs, almost exclusively to bW, within the Standard Model (SM). These properties make it a good object to test quantum chromodynamics (QCD), in production, and electroweak sectors, in decay or single top production, of the SM of particle physics. In the SM, due to the GIM mechanism [1], Flavour Changing Neutral Current (FCNC) decays are forbidden at tree level and the decay rates are much smaller than the rate of the dominant decay mode t→ bW at loop level. Figure 1 shows the dominant decay of the top quark, as well as possible FCNC decays. However, several SM extensions predict higher branching ratios (BR) for the top quark FCNC decays [2] (Table 1) which make the search for FCNC decays a good window into physics beyond the SM. Examples of such extensions are the quark-singlet model (QS), the two-Higgs doublet model with (FC 2HDM) or without (2HDM) flavour-conservation, the minimal supersymmetric model (MSSM), SUSY with R-parity violation, the Topcolour-assisted Technicolour model (TC2) [3] or models with warped extra dimensions (RS) [4].
s, d, b q, ℓ _ _ q', ν W t u, c γ t u, c q, ℓ⁻ _ q, ℓ⁺ Z t u, c g t u, c γ, b, W γ, b, W H t
Figure 1: Top quark decays. The dominant SM decay channel t→ bW and the FCNC channels of SM extensions
The present experimental limits on the branching fractions of the FCNC top quark decay channels established by experiments at the LEP, HERA, Tevatron and LHC colliders are shown in Table 2. Here, three searches (t¯t production with FCNC t→ qZ and t → cH decays, and direct single top production qg → t) with the ATLAS detector [14] at the LHC [15] and its
Process SM QS 2HDM FC 2HDM MSSM R6 SUSY TC2 RS
t→ qZ ∼ 10−14 ∼ 10−4 ∼ 10−7 ∼ 10−10 ∼ 10−6 ∼ 10−5 ∼ 10−4 ∼ 10−5 t→ qγ ∼ 10−14 ∼ 10−9 ∼ 10−6 ∼ 10−9 ∼ 10−6 ∼ 10−6 ∼ 10−6 ∼ 10−9 t→ qg ∼ 10−12 ∼ 10−7 ∼ 10−4 ∼ 10−8 ∼ 10−5 ∼ 10−4 ∼ 10−4 ∼ 10−9
t→ qH ∼ 10−15 ∼ 10−5 ∼ 10−3 ∼ 10−5 ∼ 10−5 ∼ 10−6 — —
LEP HERA Tevatron LHC BR(t→ qγ) 2.4% [5, 6, 7, 8, 9] 0.47% (tuγ) [10] 3.2% [11] — BR(t→ qZ) 7.8% [5, 6, 7, 8, 9] 30% (tuZ) [10] 3.2% [12] 0.07% [13]
Table 2: Present experimental 95% CL upper limits on the branching fractions of the FCNC top quark decay channels.
sensitivity within the High Luminosity LHC (HL-LHC) at 3000 fb−1for the decays t→ qZ and t→ qγ are presented.
The qZ analysis [16] is performed on data collected in pp collisions during 2011 at the LHC, corresponding to an integrated luminosity of 2.1 fb−1at a centre-of-mass energy of√s = 7 TeV. Only leptonic decays from Z and W are considered leading to a final topology with three isolated leptons, two jets (from the light quark and the b quark) and missing transverse energy from the undetected neutrino. Leptons are selected either using the full ATLAS identification criteria (ID) or using high quality inner detector track (TL) and events were divided into events with three ID leptons (3ID) or two ID leptons and one TL (2ID+TL). In a pre-selection exactly three leptons are required with two of them being reconstructed within 15 GeV of the Z boson mass. At the final selection at least two jets are required and Emiss
T > 20 GeV. Since the neutrino longitudinal momentum is unknown, the event kinematics is determined by minimising a χ2 function. After the reconstruction, 40 GeV and 30 GeV window mass cuts around the top quark and W boson masses are applied, respectively. Table 3 shows the number of events after the final selection. No evidence for the t→ qZ decay mode was found and upper limits at 95% CL on the number of signal events were derived using the modified frequentist likelihood method (CLs). In pseudo-experiments the expected event numbers are fluctuated according to Poisson distributions. All statistical and systematic uncertainties of the expected backgrounds and signal efficiencies were taken into account. The limits on the number of signal events were converted into upper limits on the corresponding BRs using the approximate NNLO calculation [17] and its uncertainty for the t¯t cross section, and constraining BR(t→ W b)= 1−BR(t → Zq). The observed upper limit at 95% CL on the FCNC t → Zq BR is 0.73%, after combining the 3ID and 2ID+TL results.
The qg→ t analysis [18], is performed on data collected in 2012, corresponding to an
inte-3ID 2ID+TL ZZ, W Z 9.5± 4.4 1.0±0.5 0.6 ttW , ttZ 0.51± 0.14 0.25± 0.05 t¯t, W W 0.07± 0.02 7.6± 2.2 Z+jets 1.7± 0.7 Single top 0.01± 0.01 2 + 3 fake leptons 0.0±0.2 0.0 Total bckg 11.8± 4.4 8.9± 2.3 Data 8 8 Signal efficiency (%) 0.205± 0.024 0.045± 0.007 Table 3: Number of events after the final selection [16].
grated luminosity of 14.2 fb−1at 8 TeV. FCNC t→ qg/qg → t is searched for in the production of single top-quark events, since the corresponding decay is nearly indistinguishable from the multijet background that arises from QCD processes. Again, only leptonic W boson decays are used leading to a final state topology with a single jet, a single lepton and missing transverse energy (qg → t → b`ν). The event selection requires exactly one electron or muon, one jet that is b-tagged and Emiss
T > 30 GeV. To reduce multijet background events, characterised by low Emiss
T and low mT(W ), the event selection requires mT(W ) > 50 GeV. The analysis defines a signal and a control region both requiring the preselection and one tagged jet. Events in the signal region have jets tagged by the default tagger with a tagging efficiency of 50%. The events in the control region have jets tagged with a less stringent tagger and a looser working point with a tagging efficiency of 85% and vetoing events from the signal region. This control region ensures the resulting sample is dominated by W +jets. To provide sufficient discrimination between signal and background a neural-network method is used. All possible discriminating variables such as momenta, relative angles, pseudorapidity, reconstructed par-ticles masses and lepton electric charge are explored. To reconstruct the neutrino momenta, a constraint on the invariant mass of the lepton and the neutrino to the W mass is imposed, (pW)2 = (p`+ pν)2 = m2W = (80.4 GeV)2, and the solution with the smaller |pzν| is chosen. The resulting neural network output distributions for the various processes in the control region and signal region are shown in Figure 2. No evidence of FCNC single top-quark production is found and the upper limit at 95% CL on the production cross section is 2.5 pb. Using the NLO predictions for the FCNC single top-quark production cross-section and assuming BR(t→ W b)= 1, the measured upper limit on the production cross-section is converted into limits on the coupling constants which in turn can be converted into limits on the branching fractions: BR(t→ ug) < 3.1 × 10⁻⁵ and BR(t→ cg) < 1.6 × 10⁻⁴.
For the t→ cH analysis [19], 20 fb−1 of 8 TeV and 5 fb−1 of 7 TeV data collected by the ATLAS experiment were analysed. Both hadronic and leptonic decays of the W boson were
Events / 0.13 0 5000 10000 15000 20000 25000 data =20 pb) σ FCNC ( single top t t W+HF+jets W+jets Z+jets, diboson multijets MC stat. uncert. multijets norm. + = 8 TeV s -1 L dt = 14.2 fb
∫
ATLAS Preliminary signal region NN output -1 -0.8 -0.6 -0.4 -0.2 0 0.2 0.4 0.6 0.8 1 Data/Expected 0.8 0.9 1 1.1 1.2 (a) Events / 0.08 0 10000 20000 30000 40000 50000 60000 70000 80000 data single top t t W+HF+jets W+jets Z+jets, diboson multijets MC stat. uncert. multijets norm. + = 8 TeV s -1 L dt = 14.2 fb∫
ATLAS Preliminary control region NN output -1 -0.8 -0.6 -0.4 -0.2 0 0.2 0.4 0.6 0.8 1 Data/Expected 0.6 0.8 1 1.2 1.4 (b)Figure 2: Neural-network output distributions for (a) the signal region and (b) the control region, in the qg→ t analysis [18].
considered with the Higgs boson decaying to γγ. The event selection is divided into candidates which contain exactly one lepton (leptonic analysis) and events having no leptons (fully hadronic analysis). Events with two or more leptons are rejected. At 7 TeV all events were processed through the fully hadronic analysis, independently of the number of leptons. Since the leptonic fraction at 8 TeV is of the order of 2%, the impact at 7 TeV is expected to be very small. The analysis is conducted in three steps. First, diphoton candidates are selected on the basis of photon information only. Second, for the hadronic final state, events are required to have at least four jets. Once four jets are selected, four combinations of pairs (mγγj, mjjj) using the three jets are formed, and only combinations with mγγj and mjjj within [156,191] GeV and [130,210] GeV, respectively, and with a b-tagged jet are accepted. For the lepton analysis events are required to have one lepton, two or more jets and Emiss
T > 30 GeV. The two possible pairs are considered. The momentum of the neutrino, required for the reconstructed mass of m`νj, is estimated using the W boson mass constraint. The mass windows are [156,191] GeV for mγγj, as before, and [135,205] GeV for m`νj. Again, the event is selected if one b-tagged jet is present. In the last step, the background events are estimated from the diphoton mass distribution using a sideband technique and the signal events are obtained by subtracting the backgrounds from the data events. A maximum likelihood fit using the product of the likelihoods for the search channels has been performed on the selected data sample, consisting of 50 events in the hadronic channel (7 + 43 at 7 and 8 TeV respectively) and one event in the leptonic channel. The diphoton mass spectrum in the hadronic channel is shown in Figure 3(a), together with the fitted background shape and the signal shape for a Higgs boson mass fixed at 126.8 GeV. No evidence for a signal is found and a limit on BR(t→ cH) is set. The evolution of the signal confidence level CLs as a function of BR is shown in Figure 3(b) for the same Higgs boson mass. Pseudo-experiments have been used to determine the distributions of the test-statistic under the signal+background and the background only hypotheses. The observed (expected) limit on BR is 0.83% (0.53%) at the 95% confidence level.
Foreseen for the early 2020’s is an upgrade of the LHC accelerator and detectors to handle luminosities of∼ 5 × 1034cm−2s−1(HL-LHC operation [20]), and a total integrated luminosity
[GeV] γ γ m 100 110 120 130 140 150 160 Events / 4 GeV 0 2 4 6 8 10 12 14 ATLAS Preliminary s = 8 TeV √ , -1 L dt = 20.3 fb
∫
s = 7 TeV √ , -1 L dt = 4.7 fb∫
Hadronic selection Data 2011+2012
Sig+SM Higgs (126.8 GeV)+Bkg fit SM Higgs+Bkg order polynomial) nd Bkg (2 (a) cH) → Br(t 0.002 0.004 0.006 0.008 0.01 0.012 0.014 0.016 S CL -3 10 -2 10 -1 10 1 ATLAS Preliminary s = 8 TeV √ , -1 L dt = 20.3 fb
∫
s = 7 TeV √ , -1 L dt = 4.7 fb∫
Observed Expected σ 1 ± σ 2 ± (b)Figure 3: Relevant distributions for the t→ cH analysis [19]: (a) the distribution of mγγ for the selected sample in the hadronic channel and (b) the evolution of CLs as a function of BR for the observation (full line) and the expectation in the absence of signal (dashed line), together with the 1σ and 2σ bands around the expected curve.
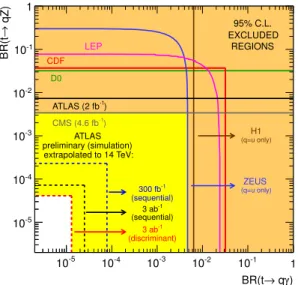
) γ q → BR(t -5 10 10-4 -3 10 10-2 10-1 1 qZ) → BR(t -5 10 -4 10 -3 10 -2 10 -1 10 1 LEP (q=u only) ZEUS (q=u only) H1 D0 CDF ) -1 ATLAS (2 fb ) -1 CMS (4.6 fb ATLAS preliminary (simulation) extrapolated to 14 TeV: -1 300 fb (sequential) -1 3 ab (sequential) -1 3 ab (discriminant) 95% C.L. EXCLUDED REGIONS
Figure 4: The present 95% CL observed limits, as well as the expected ATLAS sensitivity. For the t→ qZ and t → qγ channel [20].
of 3 ab−1 is expected to be reached. The sensitivity for the FCNC decays at the HL-LHC is evaluated by extrapolation from the numbers at 7 TeV. For the t→ γq channel, the dominant backgrounds are t¯t, Z+jets and W +jets events. For the t → Zq channel, the background is mainly composed of t¯t, Z+jets and W Z events. In the absence of FCNC decays, limits on production cross-sections are evaluated and converted to limits on BRs using the SM t¯t cross section. The HL-LHC expected limits at 95% CL for the t→ qγ and the t → qZ channels are in the range between 10−5 and 10−4 [20]. Figure 4 shows the present 95% CL observed limits on the BR(t→ qγ) vs. BR(t → qZ) plane as full lines for the LEP, ZEUS, H1, D0, CDF, ATLAS and CMS collaborations. The expected sensitivity at ATLAS is also represented by the dashed lines. Limits are represented for an integrated luminosity of L = 3 ab−1 and L = 300 fb−1.
B. Galhardo is supported by Funda¸c˜ao para a Ciˆencia e a Tecnologia, Portugal (grant SFRH/BD/51401/2011).
References
[1] S. L. Glashow, J. Iliopoulos and L. Maiani, Phys. Rev. D 2 (1970) 1285. [2] J. A. Aguilar-Saavedra, Acta Phys. Polon. B 35 (2004) 2695, hep-ph/0409342. [3] G. Lu, F. Yin, X. Wang and L. Wan, Phys. Rev. D 68 (2003) 015002, hep-ph/0303122. [4] K. Agashe, G. Perez and A. Soni, Phys. Rev. D 75 (2007) 015002, hep-ph/0606293. [5] A. Heister et al. [ALEPH Collaboration], Phys. Lett. B 543 (2002) 173, hep-ex/0206070. [6] J. Abdallah et al. [DELPHI Collaboration], Phys. Lett. B 590 (2004) 21, hep-ex/0404014. [7] G. Abbiendi et al. [OPAL Collaboration], Phys. Lett. B 521 (2001) 181, hep-ex/0110009. [8] P. Achard et al. [L3 Collaboration], Phys. Lett. B 549 (2002) 290, hep-ex/0210041. [9] LEP Exotica WG, LEP-Exotica-WG-2001-01.
[11] F. Abe et al. [CDF Collaboration], Phys. Rev. Lett. 80 (1998) 2525.
[12] V. M. Abazov et al. [D0 Collaboration], Phys. Lett. B 701 (2011) 313 arXiv:1103.4574 [hep-ex]. [13] CMS Collaboration, CMS-PAS-TOP-12-037.
[14] G. Aad et al. [ATLAS Collaboration], JINST 3 (2008) S08003. [15] L. Evans and P. Bryant, JINST 3 (2008) S08001.
[16] G. Aad et al. [ATLAS Collaboration], JHEP 1209 (2012) 139 arXiv:1206.0257 [hep-ex]. [17] U. Langenfeld, S. Moch and P. Uwer, arXiv:0907.2527 [hep-ph].
[18] ATLAS collaboration, ATLAS-CONF-2013-063. [19] ATLAS collaboration, ATLAS-CONF-2013-081. [20] ATLAS collaboration, arXiv:1307.7292 [hep-ex].


![Figure 2: Neural-network output distributions for (a) the signal region and (b) the control region, in the qg → t analysis [18].](https://thumb-eu.123doks.com/thumbv2/123dok_br/16082752.1106963/3.892.170.706.709.989/figure-neural-network-output-distributions-signal-control-analysis.webp)
![Figure 3: Relevant distributions for the t → cH analysis [19]: (a) the distribution of m γγ for the selected sample in the hadronic channel and (b) the evolution of CLs as a function of BR for the observation (full line) and the expectation in the absence](https://thumb-eu.123doks.com/thumbv2/123dok_br/16082752.1106963/4.892.170.729.740.952/relevant-distributions-analysis-distribution-selected-evolution-observation-expectation.webp)