Selective Rendering for High-Fidelity Graphics
for 3D Maps on Mobile Devices
Maximino Esteves Correia Bessa
A thesis submitted to the
UNIVERSIDADE DE TR ´AS-OS-MONTES E ALTO DOURO, Portugal in accordance with the requirements for the degree of
DOCTOR OF PHILOSOPHY in the Departamento de Engenharias.
c
Supervisors :
Professor Alan Chalmers
Warwick Digital Laboratory University of Warwick
Professor Jos´e Bulas Cruz
Departamento de Engenharias
Declaration
The work in this thesis is original and no portion of the work referred to here has been submitted in support of an application for another degree or qualification of this or any other university or institution of learning.
Signed: Date: July 31, 2007
Abstract
A map can be of great assistance when exploring unfamiliar environments. With the proliferation of mobile devices, such as PDAs and even mobile phones, the tourism industry is currently exploring the potential of new presentation strategies that will maximize the promotional appeal of tourism in a given region. Thus, while classic maps can provide a fine abstract representation of our world, and a simple, as well as, efficient way to navigate in that world, they are of little use when we are unable to determine where we are standing on the map (e.g. due to the absence of cues, such as road signs). On the other hand, mobile devices are potential sources of relevant information, and a great help in the tasks of locating ourselves, navigating rapidly around an unfamiliar environment and exploring it interactively, by the use of appropriate 3D models. The perception we get from our surroundings depends on the task we are currently performing. Hence, if we are driving a car, we will pay attention to the objects, such as the road, road signs, other vehicles, etc, that are visually important to the task at hand. The same is true when we explore new environments. However, the creation of high-fidelity 3D maps on mobile devices to aid environment navigation has been advancing without taking into account this task dependence. Moreover, the creation of high-fidelity 3D maps is computation-ally very expensive, making it hard to achieve high-fidelity rendering of the maps at interactive rates.
In this thesis we have investigated how existing mobile devices could be provided with a perceptually high quality 3D virtual environment, by exploiting identified limitations of the Human Visual System. We worked in the line of identifying important visual information (key features), that are commonly used by users when they are trying to get their bearings, within an unfamiliar environment. With this in mind, we propose a new strategy based on the idea that key features should be rendered in higher quality, while the remaining parts can be rendered in low quality, at a lower computational cost without the viewer being aware of this quality difference. Our analysis has shown that this can be achieved by employing Selective Rendering techniques and, thus, concentrating the computational efforts where they are most needed. To support our thesis, we have researched how the quality of the presented images affects perception and influences the subjects’ performance, when she/he is undertaking a navigational task. Additionally, we studied the influence of the difference in the lighting conditions, between the environment and the rendered scene (day-time, night-time).
Rendering Selectivo de Gr´
aficos de
Alta-Fidelidade para Mapas 3D em Dispositivos
M´
oveis
Maximino Esteves Correia Bessa
Tese submetida `a
UNIVERSIDADE DE TR ´AS-OS-MONTES E ALTO DOURO para obten¸c˜ao do grau de
DOUTOR,
de acordo com o disposto no Decreto-lei 216/92 de 13 de Outubro
c
Resumo
Um mapa apresenta-se como uma ferramenta de grande utilidade no que respeita `a explora¸c˜ao de ambientes desconhecidos. A ind´ustria tur´ıstica est´a actualmente a explorar as potencialidades que advˆem da prolifera¸c˜ao de dispositivos m´oveis, tais como PDAs e telem´oveis, atrav´es de novas estrat´egias de apresenta¸c˜ao, no sentido de maximizar a promo¸c˜ao do turismo de uma determinada regi˜ao. Os mapas cl´assicos s˜ao auxiliares de navega¸c˜ao capazes de fornecer uma representa¸c˜ao abstracta do nosso mundo, mas apresentam graves limita¸c˜oes de utiliza¸c˜ao se formos incapazes de determinar o local onde nos encontramos no mapa (como por exemplo, devido `a ausˆencia de pistas como as placas com o nome das ruas). Por outro lado, o uso de modelos 3D em dispositivos m´oveis afigura-se como uma potencial fonte de in-forma¸c˜ao relevante, bem como uma ferramenta eficaz para tarefas de localiza¸c˜ao, navega¸c˜ao r´apida e explora¸c˜ao de ambientes desconhecidos. A percep¸c˜ao que temos do ambiente que nos rodeia depende da tarefa que estamos a executar num determi-nado momento. Deste modo, se estivermos a conduzir um autom´ovel, vamos prestar aten¸c˜ao a objectos, tais como a estrada e outros ve´ıculos, que s˜ao visualmente im-portantes para esta tarefa. O mesmo acontece quando exploramos novos ambientes. Por´em, a evolu¸c˜ao a n´ıvel da cria¸c˜ao de mapas 3D de alta-fidelidade para disposi-tivos m´oveis, para aux´ılio `a navega¸c˜ao em ambientes desconhecidos, n˜ao tem ainda em conta a influˆencia da corrente tarefa no modo como procuramos a informa¸c˜ao na imagem. Acrescente-se ainda o facto de a produ¸c˜ao de mapas 3D de alta-fidelidade ser computacionalmente exigente, o que fortemente dificulta a gera¸c˜ao de mapas de alta-qualidade a taxas interactivas.
Na presente tese investig´amos as possibilidades de dotar dispositivos m´oveis com um ambiente 3D de alta-qualidade perceptual, tirando partido das limita¸c˜oes identifi-cadas no Sistema Visual Humano. A linha de investiga¸c˜ao seguida pretendeu iden-tificar qual a informa¸c˜ao visual importante (caracter´ısticas-chave), que ´e utilizada pelos sujeitos sempre que pretendam localizar o s´ıtio onde se encontram. Propomos uma nova abordagem, baseada em t´ecnicas de processamento selectivo (selective rendering), processando as caracter´ısticas-chave em alta-qualidade, enquanto que as restantes partes da imagem podem ser processadas em baixa qualidade, a um custo computacional comparativamente mais baixo. Assim, concentramos os es-for¸cos computacionais onde eles s˜ao mais necess´arios. Para corroborar a nossa tese, investig´amos de que forma a qualidade das imagens apresentadas afecta a percep¸c˜ao e influencia o desempenho dos sujeitos, quando estes executam uma determinada tarefa de navega¸c˜ao. Estud´amos, ainda, a influˆencia de diferen¸cas nas condi¸c˜oes de ilumina¸c˜ao entre o ambiente e a imagem criada (hora diurna, hora nocturna), assim como a forma como influenciam o desempenho dos sujeitos.
Acknowledgements
I would like to express my gratitude to all those who gave me the possibility to com-plete this thesis. I am deeply indebted to my supervisors Professor Alan Chalmers from the University of Warwick and Professor Bulas Cruz from UTAD whose sup-port, stimulating suggestions and encouragement helped me in all the time of re-search for and writing of this thesis.
I have furthermore to thank the UTAD graphics group members, namely Jo˜ao Paulo Moura, Luis Magalh˜aes, and Francisco Pereira for all their assistance, support, in-terest and valuable hints.
To my colleagues from UTAD, Emanuel Peres, Paula Oliveira, and Leonel Morgado who were of great help in difficult times.
To the Computer Graphics group of Warwick University members in particular Roger, Kurt, Patrick, and Francesco for all the assistance provided. My special thanks must go to Patrick for helping me with the creation of The 3D models. I am bound to my family who have always supported my decisions and helped me in everything I needed.
I would like to thank Luciana who was always by my side during all the process, and helped me with the review of this thesis for English style and grammar.
At last, I would like to give my special thanks to all the people that have participated in the experiments conducted and all the people who enabled me to complete this work. Without them this PhD was not possible.
Contents
Abstract iii
Resumo vii
Acknowledgements ix
List of Figures xiii
List of Tables xv
1 Introduction 1
1.1 Thesis contribution . . . 3
1.2 Possible applications . . . 4
1.3 Outline of the thesis . . . 6
2 Background 9 2.1 Human vision . . . 9
2.1.1 The structure of the eye . . . 10
2.1.2 Visual pathways . . . 12 2.1.3 Perceiving depth . . . 13 2.1.4 Perceptual constancy . . . 14 2.1.5 Pattern recognition . . . 15 2.1.6 Visual sensitivity . . . 15 2.1.7 Contrast . . . 15 xi
2.2 Visual attention . . . 16
2.2.1 Bottom-up process . . . 17
2.2.2 Top-down . . . 20
2.3 Visual perception and graphics . . . 26
2.3.1 Task maps . . . 28
2.3.2 Multi modal perception . . . 30
2.4 Digital maps for mobile devices . . . 31
2.4.1 2D maps . . . 32
2.4.2 3D maps . . . 36
2.4.3 Technologies in digital maps . . . 38
2.5 Summary . . . 41
3 Key Features for Rapid Navigation 43 3.1 Hypotheses . . . 43 3.2 Conditions . . . 44 3.3 Participants . . . 44 3.4 Procedure . . . 44 3.5 Results . . . 46 3.6 Discussion . . . 51 3.7 Summary . . . 52
4 Selective Rendering Quality for an Efficient Navigational Aid 53 4.1 Hypotheses . . . 53 4.2 Conditions . . . 54 4.3 Participants . . . 54 4.4 Procedure . . . 54 4.5 Results . . . 57 4.6 Discussion . . . 59 4.7 Summary . . . 63 5 Selective Rendering 65 5.1 Hypothesis . . . 65 5.2 Conditions . . . 65 5.3 Participants . . . 67 5.4 Procedure . . . 69 5.5 Results . . . 72 5.6 Discussion . . . 76 5.7 Summary . . . 78 xii
6 Lighting Conditions in Navigational Tasks 79 6.1 Hypothesis . . . 79 6.2 Conditions . . . 80 6.3 Participants . . . 81 6.4 Procedure . . . 81 6.5 Results . . . 83 6.6 Discussion . . . 84 6.7 Summary . . . 86
7 Conclusions and Future Work 87 7.1 Future work . . . 90
7.2 Final remarks . . . 91
Bibliography 92
A Experimental Informed Consent Form 107
B Questionnaire 111
List of Tables
3.1 Results of the first phase: average time spent, standard deviation, and average number of items that subjects used to identify each photograph. 46 3.2 Results of the second phase: average time spent, standard deviation,
and average number of items that subjects used to identify each pho-tograph. . . 46 4.1 Results of the main group that performed the task using the SQ image. 58 4.2 Results of the control group that performed the task using the HQ
image. . . 58 4.3 Results of the control group that performed the task using the LQ
image. . . 59 5.1 Subjects that selected the correct house after performing the
experi-ment with one of four images: HQ, SQ, LQ, RQ. . . 72 5.2 Image qualities chosen by subjects. . . 72 6.1 Subjects that selected the correct house after performing the
experi-ment with one of four images: ND, DN, NN, DD. . . 83
List of Figures
1.1 Screenshot of an urban environment created. Adapted from [CBSF07]. 6 2.1 A schematic representation of the eye. Adapted from [Wik07c]. . . 10 2.2 Normalised absorption spectra of the human cone (S,M,L) and rod
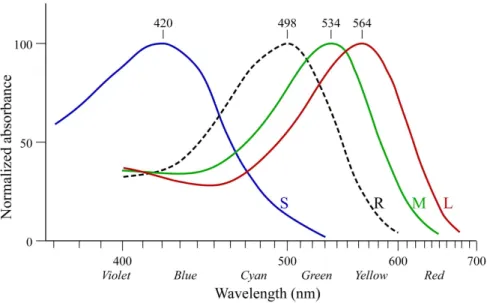
(R) cells. Adapted from [Wik07a]. . . 12 2.3 Visual pathways from the visual cortex (blue). The dorsal stream
(green) and ventral stream (purple). Adapted from [Wik07d]. . . 13 2.4 Koch computational model of attention. Adapted from [KU85]. . . . 18 2.5 Itti and Koch computational model of attention. Adapted from [IKN98]. 20 2.6 Repin’s painting, and recorded eye movements: 1) free examination,
2) estimate the social and economical conditions of the family, 3) guess the ages of characters, 4) speculate about what the characters had been doing before the arrival of the “unexpected visitor”, 5) re-member the clothes worn by the characters, 6) rere-member the position of the people and objects in the room, and 7) estimate how long the “unexpected visitor” had been away from the family. Adapted from [Wik07b]. . . 21 2.7 Example of two images that alternate with a blank screen. Adapted
from [ROC97]. . . 23 2.8 Single frames taken from the original video. Adapted from [SC99]. . . 26 2.9 Importance map examples from the corridor scene (Frame 1): (a)
Rendered Image (b) task objects, (c) task map - IM(1,0,+), (d) saliency map IM(0,1,+), and (e) combined task and saliency map -IM(0.5,0.5,+). Adapted from [SDL+05]. . . . 30
2.10 TomTom One XL [Tom07]. . . 36 2.11 TellMarisGuide on Nokia Communicator. Adapted from [SC04]. . . . 37
2.12 m-LOMA screenshots for PDA and Smartphone. Adapted from [Lab06]. 39 2.13 Performance comparison. Adapted from [SPY+05]. . . . 40
3.1 Location 1 with the key features identified by one subject.a) (left) Unmodified photograph b) (right) Modified photograph. . . 45 3.2 Location 2 with the key features identified by one subject.a) (left)
Unmodified photograph b) (right) Modified photograph. . . 45 3.3 Location 3 with the key features identified by one subject. a) (left)
Unmodified photograph b) (right) Modified photograph. . . 46 3.4 Items identified by the subjects in the first phase of the experiment. . 48 3.5 Items identified by the subjects in the second phase of the experiment. 49 3.6 Images and respective saliency maps of the first location. . . 49 3.7 Images and respective saliency maps of the second location. . . 50 3.8 Images and respective saliency maps of the third location. . . 50 4.1 Images quality for location 1. . . 55 4.2 Images quality for location 2. . . 56 4.3 Images quality and respective saliency maps for location 1. . . 60 4.4 Images quality and respective saliency maps for location 2. . . 61 4.5 Time averages for the three quality images (HQ/LQ/SQ). . . 62 5.1 Four frames from the animation. . . 66 5.2 a) Task Map, b) Saliency Map, c) Importance Map. . . 67 5.3 High quality image. . . 68 5.4 Selective quality image. . . 68 5.5 Low quality image. . . 68 5.6 Raster quality image. . . 68 5.7 Eye tracker data from one subject. . . 71 5.8 Image qualities in percentage chosen by subjects. . . 73 5.9 HQ image and respective saliency map. . . 74 5.10 SQ image and respective saliency map. . . 74 5.11 LQ image and correspondent saliency map. . . 75 5.12 RQ image and respective saliency map. . . 75 5.13 Probability of Detection map. . . 76 6.1 Four frames from the day-time animation. . . 80 6.2 Four frames from the night-time animation. . . 81 6.3 Day-time image (DI). . . 82 6.4 Night-time image (NI). . . 82 6.5 Number of subjects that selected the correct house in percentages. . . 84 6.6 NI and correspondent saliency map. . . 85 6.7 DI and correspondent saliency map. . . 85 7.1 Average of key features used by subjects when completing the
navi-gational task. . . 88 xviii
7.2 Quality chosen by subjects in percentages when using physics-based rendering. . . 89 7.3 Subjects that selected the correct house in percentages. . . 90
1
Introduction
Humans have made representations of their surrounding environment for a long time. The most ancient representations that are known do not address the land, but the sky [Wik06]. One of the oldest surviving maps that illustrates a place on the surface of the Earth is painted on a wall of the C¸ atal H¨uy¨uk settlement in south-central Anatolia (present-day Turkey). This wall painting represents the plan of an ancient city that prospered by trading obsidian and it dates from about 6200 BC. Maps can be accurate representations of our surroundings (geographic maps), or they can incorporate only hints (key features) that will conduct us to treasures (treasure maps). Every map has got its own purpose and to use a map we need to have some prior knowledge.
There are several kinds of maps. The science behind maps is known as cartogra-phy, and we can identify two general categories: general cartography and thematic cartography. The former stands for general maps. These serve the interests of a broader public due to its multiple kind of features and are capable of satisfying the needs of different individuals with distinct purposes. The latter involves maps of specific geographic themes oriented towards specific audiences, such as population, weather, geological maps, etc.
2 CHAPTER 1. INTRODUCTION
The most common and sought-after maps are generalist geographic maps, the ones that illustrate reality in two dimensions and are used for orientation aims. Thus, a map is an abstract representation of the environment, and as such, it simply may not be possible to orientate the map correctly in the absence of key information, such as road names, the geographic North, or a building of particular remark.
More recently, since the last quarter of the 20th century, a new generation of maps
has appeared: digital maps, produced by using computers and specific software. These new maps allow users to interact with them, performing tasks like zoom in or zoom out (changing the scale), which can be very helpful when exploring the map. Digital maps can be used with Global Positioning System (GPS) and offer new services based on location. Usually such maps offer route-planning and pro-vide advice on nearby facilities, while monitoring the position of the user by satellite.
The next generation of maps should provide a more realistic representation of our world, a high quality 3D representation, and they should be where we need them most, on our smart phones, Personal Digital Assistants (PDAs) and laptops. Some attempts have been made to produce 3D maps to assist people in orientation tasks. Projects like Tellmaris [SC04] and m-LOMA [Nur06a] aim to develop a generic 3D map interface specially designed for tourist information on mobile computers. The Tellmaris interface relies mainly on 3D maps to access tourist information relevant for boat tourism in the Baltic Sea area.
Notwithstanding, there are many issues that still need to be addressed to provide such extensive and high quality 3D maps at interactive rates on mobile devices. Although the next generation of mobile devices may partially solve some of the performance issues that exist today, such as bandwidth, storage, and the small di-mension of displays, this is likely to increase further demand for even more realistic and complex 3D applications.
1.1. THESIS CONTRIBUTION 3
Several techniques can be used, regarding 3D models, to overcome the issues found currently on mobile devices. Concerning the low storage capacity and bandwidth available on these devices, compression techniques can be used to make models “lighter” and, therefore, more efficient in terms of storage and bandwidth. Seg-mented models can also be adopted in order to make it possible to only store the parts of the virtual model that the user needs at a specific time. When it comes to displays, tone mapping algorithms can be used to make visualization easier when using the device in outdoor environments, where sunshine may pose serious display issues. But the key problem remains in the limitations of processing power. Tech-niques like level of detail (LOD), occlusion, and even the reduction of the models’ complexity can help to fit complex models on mobile devices. In this thesis, we investigate how to exploit features of the human visual system to overcome some issues when dealing with 3D maps on mobile devices. By knowing exactly what users are looking at on the mobile device, it may be possible to render only this part of the image at high quality, and render the rest of the scene at lower quality for a fraction of the computational cost, without the user being aware of this difference in quality.
1.1
Thesis contribution
• We present a literature review, discussing relevant aspects of visual perception, and examining issues regarding the creation of 3D maps.
• We hypothesise that people use only some key-features on a scene to orien-tate themselves correctly in an unfamiliar environment, and obtain evidence through our experiments to support this theory.
• We provide evidence that some key-features must be presented on the maps to navigate efficiently through an unfamiliar environment.
• We studied the reaction of subjects when they perform a navigational task assisted by images of different quality (e.g. High, Selective, and Low quality).
4 CHAPTER 1. INTRODUCTION
• We hypothesise that different lighting conditions between the environment and the rendered scene (day-time, night-time) can affect the performance of subjects when undertaking a navigational related task.
1.2
Possible applications
3D computer graphics applications have always been demanding in terms of com-putational cost. From the beginning, techniques have been developed in order to reduce the complexity of models and, thus, improve the performance of the appli-cations. Only recently have researchers started to look into how the Human Visual System can be exploited in order to increase the performance of 3D applications without losing any perceptual quality.
One of the main contributions of this thesis is the study of selective rendering tech-niques that exploit the Human Visual System. These can be used to render urban environments without the users noticing the differences in rendering quality. By using selective rendering techniques, one is able to reduce the computational time needed to produce an image, by concentrating the computational effort where it is most needed, i.e. important locations. These important locations can be found by the automatic creation of maps that encode which regions are important and are then used to drive a selective rendering engine. While selective rendering is not suitable for producing an image that is going to be viewed for a long time, it can be used in situations where images are briefly watched.
3D maps are the key application that can benefit from the results presented in this thesis. Maps are used as a tool, while people are moving: people spend only a little time watching the image that is presented on the display of the mobile device. For this reason, the probability of noticing details on the image is lower. Exploiting the Human Visual System through such an approach enables us to save computational efforts by performing selective rendering in very realistic models.
1.2. POSSIBLE APPLICATIONS 5
compressing the images to be used in the models. Taking into account the Human Visual System, one can reduce the size of images and continue to have a high-fidelity perceptual model. Lighting is a key characteristic that developers should consider when developing photorealistic maps based on the obtained photographs: Lighting of the model presented to users while they are trying to get their bearings should match the light conditions of the real world. One improvement that can be easily incorporated in this kind of maps is, at least, a night-time version of the same map.
Another issue concerning digital maps in general is the amount of data, which some-times makes it impossible to render the entire scene at once, within a reasonable amount of time. Hence, strategies are needed in order to present firstly the more important objects for the task at hand. In this thesis, evidence is provided for the fact that people only need two or three key features to get their bearings. Also, by devising which are these key features, it is possible to present them first, and in this way aid people in their navigational task.
Another key aspect that must be considered is the creation of the 3D maps mod-els. In this thesis, we present some evidences on how people get their bearings and what objects they use to find out where they are. While some of the objects were expected to be used, others were surprisingly unexpected. This knowledge is impor-tant and should be considered when creating 3D maps. If some objects, like urban furniture or advertisements, are important when someone is trying to locate him-self/herself, they should be incorporated into the models. In fact, in the 3D4LBMS project [CBSF06, BCM+05, CBSF07] this information was essential to select what
key features should be incorporated on the automatic generation of 3D maps, Figure 1.1. Such knowledge is equally important when there are time constraints for model creation within the project. Thus, the efforts should be placed on modelling those objects within the scene that are important to aid people get their bearings.
6 CHAPTER 1. INTRODUCTION
Figure 1.1 – Screenshot of an urban environment created. Adapted from [CBSF07].
1.3
Outline of the thesis
Chapter 2: Provides fundamental information on visual perception, beginning with aspects of the human visual system and where the two major processes humans use to perform a visual task are analysed, followed by an overview on how human vision is currently being exploited in computer graphics. Also, this chapter reflects on current mobile devices technology available to render three dimensional graphics. Finally, mobile devices along with both 2D and 3D maps and technologies in digital maps are also dealt within this chapter.
Chapter 3: Presents a formally-designed psychophysical study that was carried out in order to determine what key-features are more likely to be used by humans together with a navigational model for specific orientation purposes on unfamiliar surroundings. In addition, it was concluded that observers can easily identify a cer-tain location without using all key features available.
Chapter 4: Presents a formally-designed psychophysical study showing whether users are able or not to distinguish between different image qualities when trying to orientate themselves on an unfamiliar environment. This study has also shown what images qualities help people to perform this task better.
1.3. OUTLINE OF THE THESIS 7
Chapter 5: Presents a formally-designed psychophysical study that aims at verify-ing how people perform dependverify-ing on the quality of the images they are usverify-ing and whether their performance is better when using the higher quality images or not. Results have also shown the different types of perceptual experience people have by means of different quality images.
Chapter 6: Presents a formally-designed psychophysical experiment that studies how different lighting conditions affect the performance of subjects when undertak-ing a navigational related task.
Chapter 7: This final chapter summarises the results and contributions of this thesis and future work is suggested.
2
Background
Mobile technology offers new possibilities, such as virtual interactive complements to museum exhibits, navigation and multi-user interaction. Assisting navigation with 3D maps can be a key application for these devices, providing a more natural and intuitive interface. However, in order to manage the creation of 3D maps and ren-der them in real time, one needs to unren-derstand several different areas including the Human Visual System (HVS), computer graphics and mobile devices. This chapter provides an overview of the fundamental concepts required for this study.
2.1
Human vision
Understanding how human senses work can help achieve better results when pro-ducing digital contents to be experienced by humans. It is known that lossy sound compression can be performed without compromising quality, by removing those frequencies that humans cannot hear, for they will not be aware of the difference between the original sound and the compressed one. An identical approach can also be done with images: one can use a perceptual approach in order to achieve better results.
10 CHAPTER 2. BACKGROUND
The majority of perception-based technologies used in computer graphics are in-spired by properties of the HVS. Therefore, in order to better understand the com-plexity of human visual perceptual behaviour, the HVS will be described in the following sections.
2.1.1
The structure of the eye
The physical structure of the eye is quite well known. This physical structure is made of some particular and important visual organs, without which Visual Infor-mation Processing would not operate.
Figure 2.1 – A schematic representation of the eye. Adapted from [Wik07c].
2.1. HUMAN VISION 11
processing that the cornea, the aqueous humor, the pupil, the lens, the vitreous humor, and the retina work with an external element. This element is light. Those visual organs or optic elements let light pass through each of them, until it reaches the retina, located at the back of the eye. When this happens, a photochemical process converts light into neural activity, which enables the brain to process optical information. The photoreceptors in the retina, made of two particular and distinct retinal cells in the eye, namely the cones and the rods, are the well-known elements which carry out this function.
Rods stretch throughout almost everywhere in the retina, provide peripheral vision, have low spatial acuity and are one thousand times more sensitive than the cones. However, they are not sensitive to colour, only perceiving images as black, white and different shades of grey. Because of their higher sensitivity, rods operate well at night-time and in the detection of motion. Rods start producing a response at low levels of energy, i.e. at low light levels. Vision at these fairly low levels is also known as “Scotopic vision”.
On the other hand, cones provide colour vision at higher levels of light. There are three classes of cones, with different pigments, known as: short (S) or blue, medium (M) or green and long (L) or red. Each type responds to different wavelengths of light, as one can see in Figure 2.2. The ability to see a broad range of colours is a result of the combination of the responses of the excited cones. Cones also provide high acuity and resolution, and operate at “photopic vision”.
The fovea is a small part of the retina that covers a visual angle of only two de-grees, where cones are particularly concentrated. Due to the limited visual field of the fovea, it is only in this region that the human eye is capable of detecting acute details: in the peripheral visual field the eye cannot detect such details. Thus, when an object is being observed, the HVS has to move the eyes in order to enable that the object’s image falls on the fovea, enabling it to be perceived by the cones at their highest capacity of resolution. This movement of the eyes, produced by the
12 CHAPTER 2. BACKGROUND
Figure 2.2 – Normalised absorption spectra of the human cone (S,M,L) and rod (R) cells. Adapted from [Wik07a].
HVS, is known as a saccade [Enc06].
2.1.2
Visual pathways
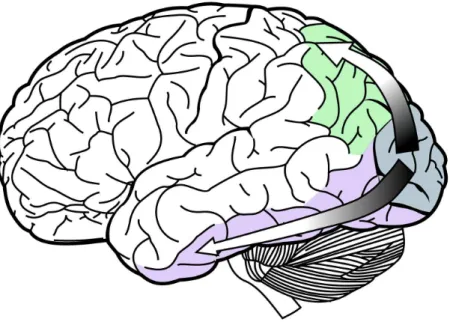
Once rods and cones have converted light energy into neural activity, visual infor-mation progresses along various neural structures, up to the visual cortex. From this stage onwards, information flows into two directions (Figure 2.3), towards the
parietal lobe as the dorsal pathway, also referred to as the WHERE pathway, and
towards the temporal lobe as the ventral pathway or the WHAT pathway [UM82]. Hence, the WHERE pathway processes spatial information, such as motion, depth, space and position, helping in the navigation through space (for instance, observing a car coming towards you, or realising where a particular street sign is located at). The WHAT pathway deals with the recognition of objects, as well as with the de-tection and capture of details such as colour, shape and texture.
2.1. HUMAN VISION 13
Figure 2.3 – Visual pathways from the visual cortex (blue). The dorsal stream (green) and ventral stream (purple). Adapted from [Wik07d].
2.1.3
Perceiving depth
Humans perceive the world in three dimensions, despite of the fact that images’ projections on the retina are in two dimensions. To create a 3D representation of the world, humans have to rely on a wide variety of cues contained in the 2D re-ceived images. These depth perception cues can be divided into three categories: Oculomotor, cues related with the position of the eyes; Monocular, one-eye related cues; and Binocular, cues that work with two eyes. More detailed information about these cues can be found in [Mur94].
Oculomotor cues result from convergence and accommodation. Convergence hap-pens when one focuses nearby objects, moving eyes inwards, while accommodation occurs when one focuses distant objects, moving eyes outwards. The information generated by these eye movements is capable of providing depth cues to the brain. Binocular cues are provided when one uses both eyes, due to the fact that each eye gives a different view of the objects in the environment. This difference is known
14 CHAPTER 2. BACKGROUND
as binocular disparity, enabling the acquisition of depth information referred to as
stereopsis. One example are 3D glasses, that when used in movies filter the light
transmitted by a 2D structure, such as the movie screen, and provides each eye different light information, enabling the user to perceive a 2D structure as 3D. There are several cues that can be interpreted effectively by using only one eye. These are called monocular cues and include: shadows, relative size, familiar size,
atmospheric perspective, linear perspective, texture gradient, and motion parallax.
2.1.4
Perceptual constancy
In spite of changes that may happen in a given pattern of light received by the retina, one may still perceive an ordinary object as the same. When this happens, it is named perceptual constancy. Research has identified several perceptual constancies, such as:
• Shape constancy - in spite of changes in the orientation of a given object, it is perceived as having the same shape.
• Size constancy - in spite of changes that occur when observing objects at different distances, they are perceived as having the same size.
• Lightness constancy - in spite of changes in illumination, the perception of the levels of lightness and darkness of an object remains the same.
• Colour constancy - closely related to lightness constancy, colour constancy is the name given to the unchangeable perception of an object’s colour, in spite of changes in lighting conditions.
So far, it has been seen how HVS processing operates, and how the visual world is organized into ordinary objects by individuals. Yet, an identification of these same objects is still needed. This identification is obtained by visual pattern recognition, which uses different template-matching models.
2.1. HUMAN VISION 15
2.1.5
Pattern recognition
As was previously mentioned, it is mainly through visual pattern recognition that the identification of objects is obtained. Basically, as it was suggested by Marr [Mar82], an ordinary object can be studied as a group of elements. E.g., according to this well known idea, an object such as a horse can be observed as having a torso attached to two legs and a neck.
2.1.6
Visual sensitivity
The perception of objects varies with the levels of light, extending from night-time to high noon. As a result, at night there is a lack of colour vision and acuity - the ability to resolve spatial detail. In such conditions, some visual mechanisms perform an adaptation to darkness, based on the the rods’ response to lower levels of light, such as moonlight. On the other hand, when one goes from a dark environment to a bright one, the cones provide colour vision at these higher levels of light, and are the basis for adaptation to lightness.
2.1.7
Contrast
The visual contrast is the difference of intensity between a given light and dark values. The latter can be low or high depending on the referred different levels of intensity. Therefore, if the difference is large the contrast will be high; on the other hand, if the difference is small, the contrast will be low. One of the many ways contrast sensitivity can be considered is by an equation, also referred as the Michelson formula [Mic27]. This formula as it is presented next is used to compute the contrast obtained in and corresponding to a periodic model.
C = Lmax− Lmin Lmax+ Lmin
Lmax defines the maximum luminance values and Lmin is the minimum luminance
16 CHAPTER 2. BACKGROUND
2.2
Visual attention
One of the most popular definitions of attention was presented by the renowned psychologist, William James [Jam90]: “Everyone knows what attention is. It is the taking possession by the mind in clear and vivid form, of one out of what seem several simultaneously possible objects or trains of thought. Focalization, concen-tration of consciousness are of its essence. It implies withdrawal from some things in order to deal effectively with others.” And in spite of studies that have been carried out more recently in this area, William James´s definition of attention remains as one of the most well established.
Psychologists have set forth the proposal of existence of serial bottlenecks in human visual information processing, areas on which it is no longer possible to carry on processing everything in parallel [Joh04]. A specific bottleneck in visual informa-tion processing is very evident. As we have seen earlier, the small area of the fovea located in the retina is where visual acuity is greatest, whereas the rest of the retina has very low acuity. This foveal area is only capable of registering a small portion of the visual field captured by the human eye. Thus, when one focuses the eyes on a particular zone of the visual field, visual processing resources will be concentrated on that particular zone that the individual is attending, while the remaining of the visual field will receive only a small part of the visual processing capacity. Usually a subject is attending to that part of the visual field which is being focused. One illustrative example can be given by a subject that, while reading a piece of paper, moves his eyes fixating the words he is attending to.
The mechanism by which the subject can rapidly direct his gaze towards objects of interest in his visual environment is called Selective Visual Attention. Attention can be allured by the stimulus itself, by bottom-up, or by top-down, which necessarily depends on the context.
2.2. VISUAL ATTENTION 17
2.2.1
Bottom-up process
Bottom-up mechanisms are thought to operate on raw sensory input, where atten-tion is rapidly and involuntarily driven to salient visual features [Itt00]. Within the bottom-up process, the visual stimulus automatically captures attention without the capability to make conscious choice to attend to features of potential importance. Examples are a red spot against a field of green (red apple on a green tree) or the sudden movement that could be a predator, which instinctively capture our atten-tion.
Treisman and colleagues presented the Feature Integration Theory in 1980 [TG80]. They proposed that the HVS begins by automatically registering features in parallel across the visual field, whereas object identification is done serially and happens at a later stage, which requires focused attention. They believe that the “visual scene is initially coded along with a number of separable dimensions such as colour, orien-tation, spatial frequency, brightness and direction of movement”. To bind all these separate dimensions and guarantee accurate synthesis of features for each object, focal attention is needed to serially process stimulus locations. These stimulus loca-tions are the only part of the visual field which go through the attentional bottleneck for further processing. This theory has served as a basis for many computational models of bottom-up attentional deployment.
Saliency maps
The first neurally-plausible bottom-up computational architecture was proposed by Koch and Ullman [KU85]. Their implementation is intimately connected to the Fea-ture Integration Theory. In this work, the expression Saliency Map was introduced. A Saliency Map is an explicit two-dimensional topographical map which combines the information of individual topographical maps, standing for different dimensions, such as colour, orientation of edges, disparity, and direction of movement. The Salience Map codes conspicuous details belonging to each feature dimension, at ev-ery location in the visual scene. Figure 2.4 shows how the selection process takes
18 CHAPTER 2. BACKGROUND
place.
Figure 2.4 – Koch computational model of attention. Adapted from [KU85].
Koch and Ullman describe the mentioned process as follows[KU85]: firstly, a set of elementary features is computed in parallel across the visual field and is represented in a set of cortical topographic maps also known as feature maps. Locations in vi-sual space that differ from their surroundings with respect to an elementary feature such as orientation, colour or motion are singled out in the correspondent map. The output of these maps is combined in a saliency map, encoding salient features in the visual scene. Secondly, by the Winner-Takes-All (WTA) mechanism operating on this map, the most conspicuous location is singled out. Thirdly, the properties of this selected location are routed to the central representation. The WTA network then shifts to the next conspicuous location. The shift can be biased by proximity and similarity preferences.
2.2. VISUAL ATTENTION 19
This architecture has been further developed and implemented [IKN98, Itt00, IK01, IK00], as illustrated in Figure 2.5. Although based on the model proposed by Koch and Ullman [KU85], this architecture provides a complete implementation of all pro-cessing stages of the Feature Integration Theory. The authors provide an extensive overview of the conceptual model, describing each step of its computational model in detail. They start by processing the visual features using linear filtering at eight spatial scales. The next step consists in computing local spatial contrast in each feature dimension (center-surround differences). Consequently, an interactive lateral inhibition scheme instances competition for salience within each feature map. After salient locations are found, feature maps are then combined into a unique “conspicu-ity map” for each feature type. The seven conspicu“conspicu-ity maps are then summed into the single topographical saliency map. This one is implemented as a 2-D sheet of integrate and fire (I&F) neurons. The WTA, also implemented using I&F neurons, registers the most salient location and directs attention towards it. An Inhibition-of-Return mechanism transiently removes this location in the saliency map, such that attention is directed to the next most salient image location in an automatic way.
Saliency Maps are at the centre of the architecture of several successful models of bottom-up control of attention. Differences between the models are generally found in the strategies employed to analyse the incoming sensory input and extract the salience to construct the saliency map. Wolfe [Wol94] presents the concept of Ac-tivation map as “the signal that will guide the deployment of attention”, which is very similar to the saliency map, but other factors such as top-down processes contributes to it as well. The Activation Map is produced by computing local differ-ences (bottom-up) and task demands (top-down). A limited set of coarse categorical features are computed such as: red, steep producing saliency. A weighted sum of these activation forms the Activation Map. Many other models have been proposed. For a more extensive review, please see [Itt00].
20 CHAPTER 2. BACKGROUND
Figure 2.5 – Itti and Koch computational model of attention. Adapted from [IKN98].
2.2.2
Top-down
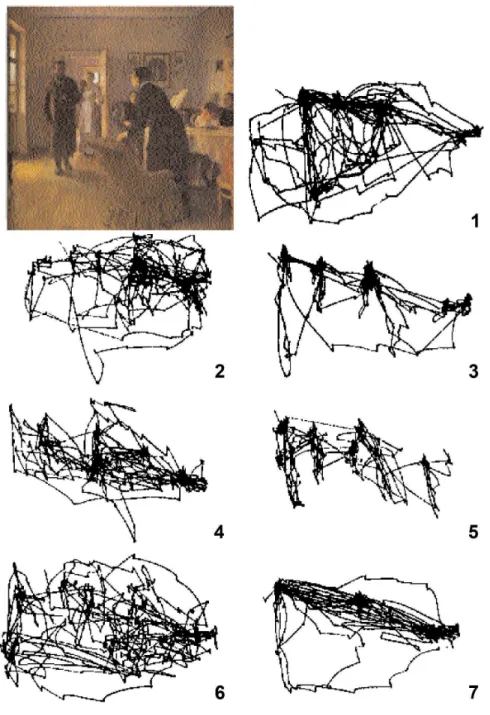
Top-down mechanisms are related to a subject’s long-term cognitive strategies, where knowledge and context play a crucial role on how one selects where to pay attention to. Yarbus [Yar67] showed that the way one perceives an environment depends on who he is and on the task that he is currently performing in that environment. In one of his classic experiments, Yarbus recorded eye movements, fixations and saccades (as referred to before, a rapid irregular movement of the eye, as it changes its focus moving from one point to another [Enc06]), of observers while inspecting Repin’s painting , “The Unexpected Visitor”. Before participants had started the test, they were instructed to perform one of the seven tasks illustrated in Figure 2.6. Although all observers were presented with the same stimulus (Re-pin’s painting), the patterns of eye movements registered were drastically different, depending on the task they were performing Figure (2.6).
2.2. VISUAL ATTENTION 21
Figure 2.6 – Repin’s painting, and recorded eye movements: 1) free examination, 2) estimate the social and economical conditions of the family, 3) guess the ages of characters, 4) speculate about what the characters had been doing before the arrival of the “unexpected visitor”, 5) remember the clothes worn by the characters, 6) remember the position of the people and objects in the room, and 7) estimate how long the “unexpected visitor” had been away from the family. Adapted from [Wik07b].
22 CHAPTER 2. BACKGROUND
in the HVS and demonstrate that although human eyes are excellent they are not perfect, and so when attention is not focused onto items in a scene they can literally go unnoticed.
Change blindness
Several studies have shown that, under certain conditions, observers fail to notice large changes made to a picture. This phenomenon is known by Change Blindness and can be observed when a subject viewing a scene is presented with a brief disrup-tion, such as the large retinal disturbance produced by an eye saccade [MC96, HH99], a brief flicker [ROC97], an eye blink [ODCR00], “mudsplashes” [ORC99], or a film cut in a motion picture sequence [LS97a].
Although researchers have long noticed the existence of such “Change Blindness” [BHS75, Hoc86], only recently renewed interest has appeared after John Grimes published his results [Aki96]. He tested later memory by showing observers pho-tographs of natural scenes. When subjects were studying an image, while jumping from one object to another, during a saccade, details of the scene were changed. Consequently subjects failed to notice large changes made to the photograph (e.g., two people exchanging heads), while identical changes were clearly noticed when they occurred during fixation.
One of the most frequently used paradigms to demonstrate change blindness is the flicker paradigm (Figure 2.7), where original and modified images are presented in rapid alternation with a blank image in between. Subjects are asked to respond as soon as they are able to detect the changing objects. Using this paradigm, Rensink et al. [ROC97] came out with two primary findings: 1) subjects hardly ever de-tected changes occurring during the first cycle of alternation, and sometimes the same changes could not be detected even after nearly one minute of alternation; 2) changes made to the “center of interest” of a scene are detected more rapidly than peripheral or “margin interest” ones, suggesting that attention is focused on central
2.2. VISUAL ATTENTION 23
objects either more rapidly or more often, thereby allowing faster change detection.
Figure 2.7 – Example of two images that alternate with a blank screen. Adapted from [ROC97].
Evidences from the flicker paradigm support the conclusion that attention is neces-sary for change detection: changes made to central objects are detected more readily, together with change blindness for marginal interest objects in scenes and motion pictures [Sim00].
In order to keep hold of the specificities relative to an object it is necessary to cen-tre attention on the changing feature, from one view to the next, and so on. This task requires from the observer a comparison between the initial object, with its conceptual representation, and the transformed object [Sim96]. Hence, the observer will try to apprehend the information inherent to the first object, so as to be able to remember any of its features afterwards. This task is particularly demanding as any observed scene has got multiple characteristics and objects, and observers will only code information and focus attention on the most important ones.
24 CHAPTER 2. BACKGROUND
mentioned changes. In fact, some observers do not detect changes made to central objects when they are not expected. One illustrative example is given by a group of observers who did not come aware of the replacement of the soda bottle, that is the central object, presented in a motion picture, by a box following a brief pan away from the table [Sim96]. Another example of misdetection is the failure of naive observers to notice when the central actor in a film scene was replaced by another actor [LS97b, Sim96].
Change blindness involving central objects also happens in the real world, not just in controlled lab environments [SL98]. And just as in the lab, in the real world ob-servers will only be able to detect changes on central objects and the difference that occurred when they do not focus on or encode the details that change. As it was said previously, attention is not sufficient to come up with a satisfactory represen-tation of details of a given object, nor to detect all the changes that happened. An example of this was presented in a recent study, where an experimenter approached a pedestrian (the subject) to ask for directions. During their conversation two other people rudely interrupted them by carrying a door between the experimenter and the pedestrian. While the subject’s view was obstructed, the first experimenter was replaced by a different experimenter. Remarkably, the result was that only 50 per-cent of the observers noticed the change, even though the two experimenters wore different clothing, were different heights and builds, had different haircuts, and had noticeably different voices [SL98].
Inattentional blindness
Inattentional blindness is the inability one reveals to identify critical stimuli com-ing directly towards his or her eyes, when performcom-ing a task which is attention-demanding. This term was firstly introduced by Mack and Rock, in their book “Inattentional Blindness”[MR98]. In it, both authors explore the relationship be-tween perception and attention, studying how objects are perceived without atten-tion. They devised a task where observers, briefly presented with a cross, were
2.2. VISUAL ATTENTION 25
asked to report which arm of a cross was longer, the horizontal arm or the vertical arm. The observers had to perform a number of trials, in one of which a critical stimulus was introduced, such as a coloured rectangle, appearing on different lo-cations on the screen, along with the cross. Thus, when the cross was located at the fixation spot and the previously mentioned unexpected object was located at the parafoveal area, about 25 percent of the participants failed to see the very same object. Another remarkable result was obtained when the same experiment was con-ducted the other way round, namely when the cross was located at the parafoveal area, whereas the critical stimuli were located at the fixation spot. Within these conditions, the results have shown that nearly 75 percent of the participants did not detect the object. One of the key conclusions they came up with was that there is no conscious perception of the visual world if it is not an object of attention [MR98].
One of the most well-known studies demonstrating inattentional blindness was per-formed by Simons and Chabris [SC99]. The task given to subjects was built upon Neisser’s original work [Nei79], where participants watched a video showing two teams passing basketballs. They were told that they should keep track of total number of passes made by one of the observed teams ignoring the other one. While they were performing the task, one of the following unexpected events happened: a tall women holding an open umbrella and walking from left to right passed through the team players; a shorter woman wearing a gorilla suit covering all her entire body, also passed through the action in the same way. In both situations (Figure 2.8), the unexpected event lasted at least 5 seconds and the team players carried on their actions through all the video sequence. The results showed that almost 50 percent of the observers did not notice the unexpected event. Simons and Chabris made pub-licly available several videos on inattentional blindness used on their experiments [Vis06].
26 CHAPTER 2. BACKGROUND
Figure 2.8 – Single frames taken from the original video. Adapted from [SC99].
2.3
Visual perception and graphics
Knowledge of the human visual system is being increasingly used to improve the quality of digital images presented to human users [Fea96, GTS+97, MCTG00,
MTAS01, MRC+86, RPG99]. Other authors have researched how to reduce
com-plex, detailed models, while preserving the viewer’s perception of the scene [LH01, LRW01, Red97, BM98, MTAS01, CC03, MS95]. A more complete review of tech-niques used in computer graphics, which explore the characteristics of the HVS, can be found in [OHM+04].
Saliency maps have been the basis of several studies in the field of computer graph-ics. Yee and colleagues ([Yee00, YPG01]) developed a method to accelerate the computation of global illumination in prerendered animations, by taking advantage of limitations of the HVS. For each frame, they computed a spatiotemporal error
tolerance map [Dal98] and a saliency map. The saliency map is based on Itti &
Koch’s model of attention [IKN98], with some modifications to account for motion. These two maps are combined to produce an Aleph Map which is used to estimate where computational efforts should be concentrated while processing the lighting solution. They reported a speedup in rendering time of between 4 and 10 times.
Haber et al. [HMYS01] used a computational model of visual attention to obtain the best image quality, as perceived by a human observer, within a limited amount
2.3. VISUAL PERCEPTION AND GRAPHICS 27
of time for each frame. They started by rendering a precomputed global illumina-tion soluillumina-tion using graphics hardware and used the remaining computaillumina-tional power to correct the appearance of non-diffuse objects on-the-fly. They also enforced cor-rective computation in non-diffuse objects, selected by the computational model of visual attention. The adopted model of attention is an extension of Itti & Koch’s model, modified in order to account for volition-controlled and task dependant at-tention. Volition-controlled attention relates to the fact that users typically place objects of interest near the centre of an image; task-dependent attention is related with the judgment of the relative importance of objects, in the context of the task which is being currently performed. Using this approach, the authors were able to display and update frames at interactive rates (10 fps for medium-complexity scenes).
Research in peripheral vision demonstrates that it is possible to reduce detail in the periphery of the visual field without disturbing visual processing. Watson [WWHR97] evaluated the effectiveness of high detail insets in head-mounted dis-plays. The high detail inset used was rectangular, and presented at a fine level of resolution. Results showed that observers found their search targets faster and more accurately in a full high resolution environment. However, experiments have shown that observers using this full high resolution environment did not perform significantly better than the ones presented only with high-resolution insets, in the context of either medium or low peripheral resolutions.
Loschky [LMYM01] used an eye-linked, multiple resolution display that produces high visual resolution only in the region to which the eyes are directed to. Their work has shown that the image needs to be updated after an eye saccade, within 5 milliseconds of a fixation. Otherwise, the observer will detect the change in resolu-tion.
Recently, Aranha et al. [ADCH06] have conducted research into perceived thresh-olds for mobile device displays. This research was concerned with the analysis of
28 CHAPTER 2. BACKGROUND
human visual acuity, and focused on determining the limits of perception while us-ing small-form-factor (SFF) devices. They devised a experiment where participants were presented with pairs of images and asked to choose between the two which they believed exhibited the best rendering quality. One of the images was in full high quality (25 rays per pixel) while the other was of lower quality (1 ray per pixel, 4 rays per pixel, 9 rays per pixel, or 16 rays per pixel). Results showed that the level of threshold for SFF systems significantly differs from typical displays. This indicates that substantial savings in rendering quality, and thus in computational resources, can be achieved for SFF devices.
Perceptual based image quality metrics are used to compare different rendered
im-ages, taking into account the characteristics of the HVS. One of these metrics is the Visible Difference Predictor (VDP), originally proposed by Daly [Dal93] and used in computer graphics to predict whether differences between pairs of images are perceivable by the HVS. VDP does not take into account visual attention. A detection map is produced by the VDP, which establishes the probability of the detected differences between two images as well as measurements of the degree of differentiation. In the areas where input images are entirely dissimilar, the probabil-ity of detection will be 1; in other areas, the probabilprobabil-ity of detection will be between 0 and 1, depending on the degree of similarity.
2.3.1
Task maps
Cater et al. [CCL02, CCW03, CC03, CCD03, KCD01] showed how properties of the HVS, such as change blindness and inattentional blindness, can be exploited to accelerate the rendering of animated sequences. In [CCD03, KCD01] it is shown that change blindness also occurs in computer-generated images. It is argued that, for virtual reality applications in which blinks and saccades of the observer’s eyes are known or can be predicted in real time, computational savings attained by exploiting Change Blindness can be dramatic [CCL02, CC03].
2.3. VISUAL PERCEPTION AND GRAPHICS 29
graphics scene that would normally attract the viewer’s attention are ignored if they are not relevant to the task at hand (Inattentional Blindness). In these experiments, viewers were presented with two animations: a full, high-quality rendered anima-tion; and a selective quality rendered animation, where only the pixels in the visual angle of the fovea (2 degrees), centred around the location of the objects related to the task the observer is performing, were rendered with high quality. This area was blended with the rest of the image, rendered at a much lower level of quality. When observers were performing the task within an animation, their visual attention was fixed exclusively on the task area, and they consistently failed to notice the signifi-cant difference in rendering quality between the two animations. So, they proposed that by applying a prior knowledge of a viewer’s task focus, rendering quality can be reduced in non-task areas. A progressive animation framework was designed, which combines an indexed task map with a spatiotemporal contrast sensitivity function, to determine which image areas need further refinement. Task maps specify what parts of a scene are perceptually important to perform a given task. These maps can be defined either manually [CCL02] or by automatically predicting the salience of non-diffuse objects [HMYS01].
Sundstedt et al. extended Cater’s original work and introduced the idea of an Im-portance Map Figure (2.9 (e)). This map results from a combination of a task map and a saliency map. The task map (Figure 2.9-c) is constructed using the methodol-ogy proposed by Cater et al. and the saliency map (Figure 2.9-d) is obtained using Itti & Koch’s computational model of visual attention. Research by Sundstedt et al. [SCC04, SCCD04, SCM04, SDC04, SDL+05] showed that rendered animations
based on Importance Maps were perceptually indistinguishable when compared with a high quality animation of the same scene, even under free viewing conditions.
30 CHAPTER 2. BACKGROUND
Figure 2.9 – Importance map examples from the corridor scene (Frame 1): (a) Rendered Image (b) task objects, (c) task map - IM(1,0,+), (d) saliency map - IM(0,1,+), and (e) combined task and saliency map - IM(0.5,0.5,+). Adapted from [SDL+05].
2.3.2
Multi modal perception
Research on multimodal perception applied to graphics has shown how visual per-formance is affected when other senses, such as hearing, require attention. Mas-toropoulou et al. [MDCT05a, MC04] researched the influence sound effects have on the perceptibility of motion smoothness in an animation (i.e., on the percep-tion of delivered frame rate). They devised a task where participants observed pairs of computer-generated walk-through animations (with the same visual content within the pair) displayed at five different frame rates, in all possible combinations. Both walk-throughs in each test pair were either silent or accompanied by sound effects. Tested participants had to decide which animation was perceived as having a smoother motion. They reported that participants observing the walk-through with sound made more mistakes judging the motion smoothness, when compared to observers without sound. They showed that audio stimuli attract a part of the viewers’ attention away from the visuals. As a result, observers find it more difficult to distinguish smoothness variations between audiovisual composites displayed at different rates than with silent animations.
In another study [MDCT05b], the same authors researched how sound effects with abrupt onsets affect a viewer’s perceived quality of rendered images, while watching computer-generated animations. They rendered two animations: in the first ani-mation everything was in High Quality; in the second aniani-mation sound emitting
2.4. DIGITAL MAPS FOR MOBILE DEVICES 31
objects and their surroundings were rendered at High Quality, while the remain-ing of the scene was rendered at Low Quality. Observers watched either the High Quality animation or the Selective Quality animation which were silent or contained a sound effect of a ringing phone. When subjects finished viewing the animation they were asked to choose between two images representing the same frame of the animation. One was rendered at High Quality and the other at Selective Quality. Results showed that observers generally fail to notice the quality variations within the scene while the sound lasts.
More recently, Ellis et al. have studied the influence of translational and rotational motion on how subjects perceived graphics. In [EC06], they looked into how the HVS deals with translational motion to drive a selective rendering system. This system computes perceptually important parts of a scene in high quality and the remainder of the scene in a lower quality, and thus at a much reduced computa-tional cost. They reported that even for this less dramatic form of motion, the viewer’s perception of a scene can be significantly affected. The experiment was conducted using a motion simulator where observers were presented with one of four animations: High Quality, Low Quality, Selective Quality (the quality of each frame depends on an ego-motion map) and Constant Selective Quality (consisting on a simple circle, with origin at the screen centre, radius 200 pixels). Each observer performed the experiment with or without motion. The results confirmed that it is possible to use models of the vestibular system to predict when the image quality of an animation can be dropped, without this being noticed by the viewer. Ellis et al. [ECD06] have also researched rotational motion. Results showed that rotational motion also affects the way subjects perceive high quality graphics.
2.4
Digital maps for mobile devices
Classic maps are an outstanding tool and have been helping people to navigate in unknown environments for centuries. However, current technological evolution in mobile devices, the increasing bandwidth of wireless communications and the
32 CHAPTER 2. BACKGROUND
improved precision of positioning devices have led to the development of a new technology called Location-Based Mobile Services (LBMS). Through LBMS, using a mobile device, the user receives contextualised information, based on his location. This kind of technology is rapidly evolving. An illustrative example is that of tech-nology for providing mobile guides, in projects like Cyberguide [AAH+97], which
provided simple schematic black and white maps, or m-LOMA, whose prototypes provide 3D maps with contextualised information, exemplified by m-LOMA proto-types [Nur06a].
In the last few years, electronic mobile guides have evolved into more than simple maps. Originally envisaged as a replacement of traditional maps, to help people to find their way, these guides now also provide navigational assistance and contextu-alised information. Therefore, electronic mobile guides can offer the information the user needs, when the users needs it and where the user needs it most, on different mobile devices, namely smart phones and PDAs. The development of SmartPhones and PDAs, wireless networks (e.g. GPRS -General Packet Radio Service , WLAN - wireless local area network, UMTS - Universal Mobile Telecommunications Sys-tem) and positioning devices (GPS) has resulted in location-based services emerging in the last few years. There are, however, some important issues that need to be addressed, including how to better deal with small displays, bandwidth constraints and limited processing.
Electronic guides technology has two main application areas: indoor guides, that are suitable to explore buildings and to guide visitors in museums [OS00]; and outdoor guides [Nur06a, SC04], which are an excellent way to provide navigational assistance. In this thesis, only outdoor maps are considered (a more complete review of electronic guides is found in [MZR04]).
2.4.1
2D maps
The CyberGuide project [AAH+97] started with the long term goal of building an
2.4. DIGITAL MAPS FOR MOBILE DEVICES 33
and answer questions he might pose, and provides the ability to interact with other people and the environment”. The Cyberguide application is composed of four com-ponents: map, information, communication, position. The map component contains a map of the entire Graphics, Visualization and Usability Center (GVU). The user can interact with the map by zooming in and out to obtain alternative views. An icon shows the user location and another icon (star) represents demonstration sta-tions. The user’s location can be automatically updated in the map, which is scrolled automatically. The information component contains information about each of the demos on display at the GVU open house. The user is also able to select star icons for a demo. Selecting one of these will bring up the information page for that demo, or search for demos in the information page. The communication component con-sists of a wired internet connection that is mostly used by the users, in order to answer questionnaires prepared by the research team.
The position component, whose INDOOR position system was implemented with infrared (IR) technology, used some remote controls from TVs as active beams to build a serial IR network. A later version has provided outdoor support using GPS as the location means [AAH+97]. To increase the user interaction with the
environ-ment, another prototype of Cyberguide was developed, which aimed to help tourists in pursuit of refreshments in the neighborhood of Atlanta. The tourists could select one establishment and Cyberguide would make available the navigational assistance. Additionally, the users could also enter into the database records for new establish-ments.
The Cheverst et al. system, GUIDE, provides information about the city of Lan-caster [CDM+00]. The guide system integrates the use of personal computing
tech-nologies, wireless communications, context-awareness and adaptive hypermedia in order to support the information and navigation needs of visitors to the city. GUIDE utilises a cell-based wireless communications infrastructure in order to broadcast dy-namic and positioning information to portable GUIDE units that run a customized web browser. The interface is based on the “browser” metaphor. The authors tried
34 CHAPTER 2. BACKGROUND
to give GUIDE a friendly personality so that novice users would find a computer-based interactive system more approachable. Hence, the user can interact with the GUIDE system in order to perform the following tasks: Information retrieval, navi-gation of the city using a map, create and then follow a tour of the city, communicate with other visitors or the Tourism Information Centre by sending text messages or booking accommodation. From the field trials, authors found that the GUIDE sys-tem had a high acceptance: 59 in 60 visitors enjoyed using GUIDE to explore the city, and all visitors expressed the opinion that the location-aware navigation and information retrieval mechanisms provided by the system were both useful and re-assuring.
The Deep Map project [MPZC00] is developing a mobile system able to generate personal guided walks for tourists through the city of Heidelberg and to aid tourists in navigating through the city. Such a tour shall consider personal interests and needs, social and cultural backgrounds (age, education, gender), as well as other circumstances (e.g. season, weather, traffic conditions, financial resources). In the Deep Map framework, a prototype of a digital personal mobile tourist guide has been developed, which integrates research from various areas of computer science, namely: geo-information systems, data bases, natural language processing, intel-ligent user interfaces and knowledge representation. The goal of the Deep Map project consists in developing information technologies that can handle huge hetero-geneous data collections, complex functionality and a variety of equipment, but are still accessible for untrained users.
In [Wah02], Wolfgang describes the SmartKom framework. A multi-modal dia-logue system, which allows speech, gesture, and mimic interaction, and a mobile communication assistant under development, are presented. Smartkom-Mobile uses a PDA as front end and can be added to a car navigation system, or carried by a pedestrian. SmartKom mobile provides personalized mobile services, like route planning and interactive navigation through a city, via GPS and Global System for Mobile Communications (GSM), GPRS or UMTS. Speech input can be combined
![Figure 1.1 – Screenshot of an urban environment created. Adapted from [CBSF07].](https://thumb-eu.123doks.com/thumbv2/123dok_br/16078981.1106794/32.892.183.625.172.400/figure-screenshot-urban-environment-created-adapted-cbsf.webp)
![Figure 2.1 – A schematic representation of the eye. Adapted from [Wik07c].](https://thumb-eu.123doks.com/thumbv2/123dok_br/16078981.1106794/36.892.187.624.536.967/figure-schematic-representation-eye-adapted-wik-c.webp)
![Figure 2.4 – Koch computational model of attention. Adapted from [KU85].](https://thumb-eu.123doks.com/thumbv2/123dok_br/16078981.1106794/44.892.130.673.231.654/figure-koch-computational-model-attention-adapted-ku.webp)
![Figure 2.5 – Itti and Koch computational model of attention. Adapted from [IKN98].](https://thumb-eu.123doks.com/thumbv2/123dok_br/16078981.1106794/46.892.181.627.174.556/figure-itti-koch-computational-model-attention-adapted-ikn.webp)
![Figure 2.7 – Example of two images that alternate with a blank screen. Adapted from [ROC97].](https://thumb-eu.123doks.com/thumbv2/123dok_br/16078981.1106794/49.892.174.807.249.552/figure-example-images-alternate-blank-screen-adapted-roc.webp)
![Figure 2.8 – Single frames taken from the original video. Adapted from [SC99].](https://thumb-eu.123doks.com/thumbv2/123dok_br/16078981.1106794/52.892.125.685.168.357/figure-single-frames-taken-original-video-adapted-sc.webp)
![Figure 2.10 – TomTom One XL [Tom07].](https://thumb-eu.123doks.com/thumbv2/123dok_br/16078981.1106794/62.892.152.657.173.538/figure-tomtom-one-xl-tom.webp)