The 6thIEEE International Conference on Intelligent Data Acquisition and Advanced Computing Systems: Technology and Applications
15-17 September 2011, Prague, Czech Republic
Service-Oriented Distributed Measurement and
Control Systems: A Case Study
Vítor Viegas1,2, P. Silva Girão2,3, Miguel Pereira1,2
1EST Setúbal / LabIM, Instituto Politécnico de Setúbal, Setúbal, Portugal 2Instituto de Telecomunicações, Lisboa, Portugal
3DEEC / IST, Universidade Técnica de Lisboa, Lisboa, Portugal Email: vitor.viegas@estsetubal.ips.pt
Abstract – The paper presents a Distributed Measurement and Control System (DMCS) applied to a physical process equipped with all the instrumentation needed to run control loops for temperature, level, flow and pressure, quantities widely found in the process industry. The system is supported by a service-oriented middleware platform based on the IEEE 1451.1 std and the Windows Communication Foundation (WCF). Tests were made to evaluate the performance of the system in terms of sampling frequency and behavior of control loops. The methodology of each experiment is described, results are analyzed and conclusions are extracted.
Keywords - DMCS; IEEE 1451.1; WCF; middleware I. INTRODUCTION
The productivity and interoperability offered by the .NET Framework [1] and the Windows Communication Foun-dation (WCF) [2] are very tempting to be applied in the context of Distributed Measurement and Control Systems (DMCS). Following this idea, we developed a service-oriented middleware platform that takes advantage of the object model defined by the IEEE 1451.1 [3] and the communication model provided by WCF services. This approach is very promising but has some pitfalls and drawbacks, in particular those related with the overhead introduced by additional software layers involved in data transfer and data processing.
In order to clarify the performance issues of the mid-dleware platform, we built a pilot DMCS and saw how it worked on a real plant. Tests were made to evaluate the performance of the system in terms of sampling frequency and behavior of control loops. The results obtained can serve as guidelines and benchmarks for the future. The paper is organized as follows: section II explains the architecture of the system, section III presents the physical process used as test bench, section IV describes the tests performed, and section V extracts conclusions.
II. SYSTEMARCHITECTURE
The pilot system is completely based on the service-oriented middleware platform. The middleware platform provides the “bricks” with which we can build distributed control and supervision applications.
A. Service-Oriented Middleware Platform
The middleware platform merges the strengths of the IEEE 1451.1 std with the benefits supplied by the .NET Frame-work and WCF. The idea was to materialize the 1451.1-object model using last-generation software technologies, in order to obtain an open middleware solution targeted for instrumentation. The solution thus found was named Service eXtensions for Instrumentation (SXI).
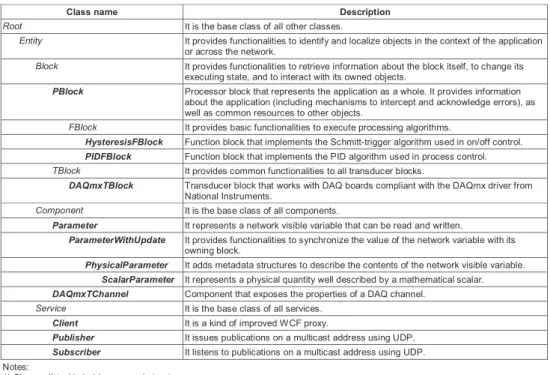
The SXI platform implements a fully-functional subset of the 1451.1-object model (see table I). The subset is composed by blocks, components and services, making a total of 19 classes, all coded in VB.NET 2008 and assem-bled in the reusable library sxi.dll. Despite all attempts to follow as closely as possible the 1451.1-object model, some changes had to me made, such as the modification of some classes and the introduction of new ones, the redefinition of some datatypes and methods, and the use of native WCF proxies instead of client and publisher ports. Therefore, we do not expect the SXI platform to be compatible with the IEEE 1451.1 std, but rather an alternative (and improved) approach.
On the field side, the SXI platform works with Data Ac-Quisition (DAQ) boards compliant with the DAQmx driver [4] from National Instruments (NI). Field sensors/actuators are respectively connected to the input/output channels of a DAQ board. Each DAQ channel can be automatically configured by reading the Transducer Electronic Data Sheet (TEDS) of the attached transducer according the directives
Class name Description
Root It is the base class of all other classes.
Entity It provides functionalities to identify and localize objects in the context of the application or across the network.
Block It provides functionalities to retrieve information about the block itself, to change its executing state, and to interact with its owned objects.
PBlock Processor block that represents the application as a whole. It provides information about the application (including mechanisms to intercept and acknowledge errors), as well as common resources to other objects.
FBlock It provides basic functionalities to execute processing algorithms.
HysteresisFBlock Function block that implements the Schmitt-trigger algorithm used in on/off control.
PIDFBlock Function block that implements the PID algorithm used in process control. TBlock It provides common functionalities to all transducer blocks.
DAQmxTBlock Transducer block that works with DAQ boards compliant with the DAQmx driver from National Instruments.
Component It is the base class of all components.
Parameter It represents a network visible variable that can be read and written.
ParameterWithUpdate It provides functionalities to synchronize the value of the network variable with its owning block.
PhysicalParameter It adds metadata structures to describe the contents of the network visible variable.
ScalarParameter It represents a physical quantity well described by a mathematical scalar. DAQmxTChannel Component that exposes the properties of a DAQ channel.
Service It is the base class of all services.
Client It is a kind of improved WCF proxy.
Publisher It issues publications on a multicast address using UDP.
Subscriber It listens to publications on a multicast address using UDP. Notes:
1) Classes listed in bold are non-abstract.
2) The indexing of each class represents its position in the hierarchy.
Table I. OBJECT MODEL OF THESXIPLATFORM.
of the IEEE 1451.4 std [5]. At the present, only numeric field variables, well represented by mathematical scalars, can be handled.
On the network side, communications are completely based on WCF services following the best practices de-scribed in the literature [6]. All non-abstract classes of the SXI platform are implemented as services marked with following attributes:
• InstanceManagement = single: This means that the service is a unique instance that is shared by all the clients.
• ConcurrencyMode = single: This means that remote calls are served one at a time, in absolute exclusivity. As a result, the internal state of the service is preserved between remote calls.
• UseSynchronizationContext = false: This means that each remote call is served by a dedicated thread. In each moment, there may be multiple threads servicing multiple remote calls on different services.
All WCF services natively support the client/server commu-nication model. Whenever a service is created, it registers itself on a client/server endpoint and exposes its methods on the network. If a client wants to invoke a method, it gets the dispatch address of the service, creates a proxy at run-time, invokes the remote call, and collects the results (if
any). Client/server endpoints can use one of the following bindings:
• BasicHttpBinding: This binding is totally compatible with web services [7]. It uses the Simple Object Ap-plication Protocol (SOAP) [8] to format messages, and the Hyper Text Transport Protocol (HTTP) to transport them over the wire. It promotes interoperability over performance making it suitable for communications between cross-platform applications in the internet. • WSHttpBinding: This binding also uses the SOAP
format and the HTTP transport. However, it also sup-ports WS* extensions [9] (which are not compatible with web services), making it more versatile but also less interoperable. It is indicated for communications between uni-platform applications in the internet. • NetTcpBinding: This binding uses a proprietary binary
protocol to format messages and the Transmission Control Protocol (TCP) to transport them. It promotes performance over interoperability making it suitable for communications between uni-platform applications inside an intranet.
By choosing the right binding, client/server communications can be tuned for performance or interoperability, depending on the needs of the system.
model is trickier as it requires the dedicated classes
Pub-lisher and Subscriber. These classes use a non-standard
binding [10], based on the User Datagram Protocol (UDP), to issue/intercept publications to/from a multicast address. A publication is a method with no return values (equivalent to a “one-way” message) that is called by the publisher and forwarded to all subscribers registered in the multicast address.
For now, the SXI platform is limited to one transducer block, two function blocks and one type of parameter. In the future, the object model shall include new transducer blocks (to improve field communications), new function blocks (to improve data processing capabilities), and new classes to support vector parameters, time parameters and files.
B. Control Stations
Control stations are object-oriented applications that use the SXI platform to control physical processes. They are hosted in computers connected to an intranet allowing the execution of local control loops (inside a control station), as well as distributed control loops (involving two or more control stations).
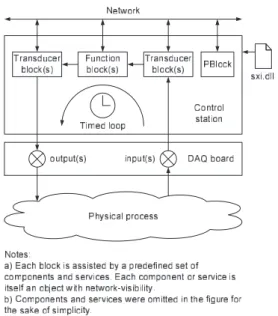
A control station resembles a Programmable Logic Con-troller (PLC) in the sense that it executes the control routine periodically by means of a timed loop. On every loop iteration, data is acquired from sensors (using one or more transducer blocks), control algorithms are executed (using one or more function blocks), and output values are written to actuators (using one or more transducer blocks), always by this order, as depicted in figure 1. Each block owns a predefined set of components and services, all working as its assistants: parameters are used to store block variables, publishers are used to broadcast block variables across the network, and subscribers are used to collect data from the network and feed block variables.
All control stations must provide publications to an-nounce themselves to the network and to describe all the WCF services they expose. These publications must be issued at start-up and on demand (and optionally at regular intervals as a heart beat).
Figure 2 proposes a Graphical User Interface (GUI) for control stations. The interface is dominated by a tree list where the operator can see all objects created by the applica-tion. Each object is identified by its name and is positioned according its owning relation. In the right column, the operator can see (and edit) the value of application variables.
C. Engineering Stations
Engineering stations are object-oriented applications that use the SXI platform to configure and monitor control
Figure. 1. Data flow inside a control station.
Figure. 2. Proposal of GUI for control stations.
stations. They are hosted in computers connected to the same intranet as the control stations. This arrangement makes possible for an engineering station to “take care” of the control stations located in the neighborhood. An engineering station serves two main purposes:
• System configuration: System configuration is done by intercepting publications carrying announcements of control stations and their WCF services. The attached data is extracted and used to build a virtual image of the network, including the type, name, identifier and dispatch address of all registered services. This information is all we need to create a proxy and invoke any method on any service. In other words, this is all we need to configure the entire system.
intercept-ing publications carryintercept-ing block variables. The attached data, which includes the value of the variable and its identification, is extracted and optionally logged to a file.
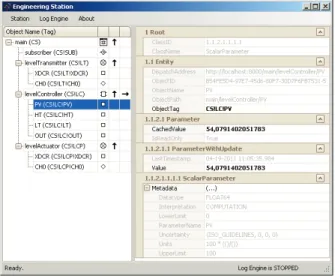
Figure 3 presents the GUI of engineering stations. On the left pane, the operator can see all the services registered in the network. By clicking on a given service, the operator gains access to the properties of the remote object on the right pane.
Figure. 3. GUI of engineering stations.
III. PHYSICALPROCESS
The pilot system was tested in the physical process pre-sented in figure 4. The process is a training plant – model TE34 from Plint & Partners Ltd – that includes all the instrumentation needed to run the following control loops: • Pressure loop: The pressure inside the closed tank C2 is measured by the transmitter PT and is controlled by operating the control valves PCV1 and PCV2 (which form a complementary pair). The pressure increases when PCV1 opens and PCV2 closes, and vice-versa. • Level loop: The water level inside the closed tank C2
is measured by the transmitter LT and is controlled by operating the control valves FCV1 and FCV2 (which also form a complementary pair). The water is continuously pumped from the open tank C1 to C2 and returns back through FCV1 and the hand valve HV.
• Temperature loop: The temperature of the water enter-ing in the open tank C1 is measured by the transmitter TT and is controlled by operating the control valve TCV. The flow of hot water is constant while the flow
of cold water can be adjusted. C1 is equipped with an overflow tube that drains the excess water out to the sewer.
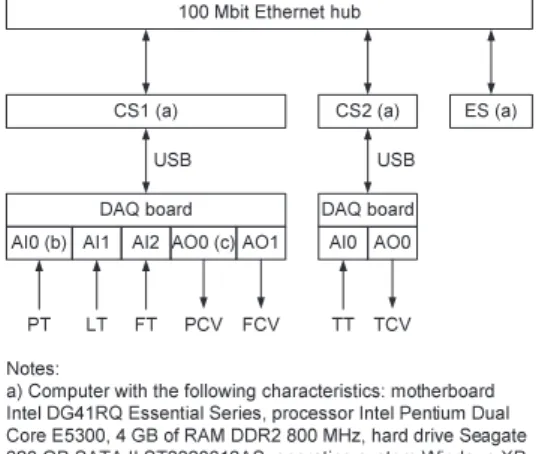
Two control stations were used to execute the control loops: the pressure and level loops were assigned to control station number one (CS1) and the temperature loop was assigned to control station number two (CS2). Both control stations were equipped with a DAQ board, model USB-6008 from NI.
The control strategy of station CS1 consists of two Proportional-Integral (PI) controllers implemented by two objects of type PIDFBlock, both having the derivative component equal to zero. The control strategy of station CS2 is slightly different as it consists of one fully-functional Proportional-Integral-Derivative (PID) controller. In this case, the derivative component is needed to compensate the high inertia of the temperature loop.
Finally, an engineering station (ES) was added to con-figure and monitor the system. The three stations were installed on three distinct machines, all having the same characteristics. The three computers were connected to an eight port Ethernet hub (model 3C16753 from 3Com) forming a 100 Mbit intranet. Figure 5 presents the final arrangement of the system.
Figure. 4. Physical process.
IV. EXPERIMENTALRESULTS
The performance of the pilot system was evaluated in terms of sampling frequency and behavior of control loops.
A. Sampling Frequency
Each control station executes the control routine periodi-cally by means of a timed loop. Precise timing is achieved by performing passive waits with a resolution of 1 ms. The
100 Mbit Ethernet hub
USB
DAQ board AI0 AO0 DAQ board
AI0 (b) AI1 AI2 AO0 (c) AO1 FCV PCV FT LT PT TT TCV CS2 (a) CS1 (a) ES (a) USB Notes:
a) Computer with the following characteristics: motherboard Intel DG41RQ Essential Series, processor Intel Pentium Dual Core E5300, 4 GB of RAM DDR2 800 MHz, hard drive Seagate 320 GB SATA II ST3320613AS, operating system Windows XP Home SP3 plus .NET Framework 3.5.
b) Analog Input number zero. c) Analog output number zero.
Figure. 5. Arrangement of the pilot system.
elapsed time between loop iterations, here called “cycle time”, determines the sampling frequency of the control station and has a strong impact on the quality of control algorithms.
The experiments to evaluate the sampling frequency took place in station CS1 because its workload is larger than that of station CS2. The following methodology was adopted:
1) A stopwatch object was added to the code in order to measure the elapsed time between loop iterations. The stopwatch object is capable of measuring time intervals with a microsecond resolution [11]. 2) The station CS1 was started assuming a nominal cycle
time of 100 ms. About 1000 samples of effective cycle time were acquired and logged to a file.
3) Step 2 was repeated for the following nominal cycle times: 50 ms, 200 ms and 1000 ms. Table II summa-rizes the results of all experiments.
4) If station CS1 remains in operation for a long period of time, the memory available in the computer grad-ually decreases, returning to the baseline from time to time. When this happens, the hard drive is heavily accessed and the cycle time suffers variations of tens of milliseconds.
The collected data can be analyzed as follows:
• Above 100 ms inclusive, the mean value of effective cycle time is very close to the nominal value. The mean relative error tends to decrease suggesting that larger cycle times are more accurate, as expected.
• Above 100 ms inclusive, the percentage of centered samples is 100%, meaning that Windows XP performs reasonably well although it is not a real-time operating system.
• Below 100 ms, the nominal cycle time is not satisfied. The minimum mean value of effective cycle time is approximately 60 ms, which corresponds to a maxi-mum sampling frequency of 16 Hz. Given the inertia of the physical process, a sampling frequency of 2 Hz was chosen to control it.
• The strong variations observed occasionally in the cycle time are caused by the garbage collector of the .NET Framework. When it starts working, all applications are blocked waiting for it to clean up the memory.
Nominal value (ms)Effective value (ms) Mean relative error (%) (a) samples (%) (b)Centered Mean Min Max
50 60,19 57 65 20,38 0
100 100,48 100 101 0,480 100
200 200,52 200 201 0,260 100
1000 1000,46 1000 1001 0,046 100
Notes:
a) Defined as 100×|“nominal value”–“mean effective error”|/“nominal value”. b) Percentage of samples inside the interval “nominal value”±1 ms.
Table II. CYCLE TIME OF STATIONCS1.
B. Behavior of Control Loops
All control loops were tested over their dynamic ranges. For each controller, the setpoint, the process variable and the output were remotely monitored from station ES.
1) Pressure and Level Loops: The experiments to
eval-uate the behavior of pressure and level loops took place in station CS1. The following methodology was adopted:
1) The sampling frequency of station CS1 was adjusted to 2 Hz.
2) The PI controllers were tuned in advance using the Ziegler-Nichols method based on the open loop step response [13]. The pressure controller was configured with proportional gain (Kp) = 200 and integral time (Ti) = 6 s, while the level controller was configured with Kp = 8 and Ti = 4 s.
3) The system was started with pressure and level set-points of 2 bar and 50%, respectively. Time was given for all variables to stabilize after which they started to be logged to a file.
4) At t = 60 s, the pressure setpoint was changed to 3 bar.
5) At t = 180 s, the pressure setpoint was changed to 1 bar.
6) At t = 300 s, the pressure setpoint returned to 2 bar. 7) At t = 420 s, the level setpoint was changed to 75%. 8) At t = 540 s, the level setpoint was changed to 20%. 9) At t = 660 s, the level setpoint returned to 50%. 10) At t = 780 s, the logging process was stopped. The collected data can be analyzed as follows:
• With respect to the pressure loop (see figure 6): – At t = 60 and 300 s, the controller opens PCV1
(and closes PCV2) to increase the pressure inside C2. The process response has no overshoot and stabilizes after 20 s.
– At t = 180 s, the controller closes PCV1 (and opens PCV2) to decrease the pressure. The process response has no overshoot and stabilizes after 30 s.
– At t = 420 and 660 s, the pressure has a sudden increase (caused by a level rise) that is quickly canceled by the controller.
– At t = 540 s, the pressure has a sudden decrease (caused by a level fall) that is quickly canceled by the controller.
– The pressure controller is characterized by good tracking capability, no overshoot, short settling time and high immunity to external disturbances (in particular those related with level variations). • With respect to the level loop (see figure 7):
– At t = 60 and 300 s, the water level inside C2 has a sudden decrease (caused by a pressure rise) that is quickly canceled by the controller.
– At t = 180 s, the level has a sudden increase (caused by a pressure fall) that is quickly canceled by the controller.
– At t = 420 and 660 s, the controller opens FCV2 (and closes FCV1) to increase the level. The pro-cess response has small overshoot and stabilizes after 20 s.
– At t = 540 s, the controller closes FCV2 (and opens FCV1) to decrease the level. The process response has small overshoot and stabilizes after 30 s.
– The level controller is characterized by good track-ing capability, small overshoot, short settltrack-ing time and high immunity to external disturbances (in particular those related with pressure variations).
2) Temperature Loop: The experiments to evaluate the
behavior of the temperature loop took place in station CS2. The following methodology was adopted:
1) The sampling frequency of station CS2 was adjusted to 2 Hz.
2) The PID controller was tuned in advance using the method described before. The temperature controller was configured with Kp = 6, Ti = 10 s and derivative time (Td) = 6 s.
3) The system was started with a temperature setpoint of 35 ºC. Time was given for all variables to stabilize
0 100 200 300 400 500 600 700 800 0.5 1 1.5 2 2.5 3 3.5 Time (s) A m p lit u d e ( b a r) process variable pressure setpoint
Figure. 6. Pressure loop response.
0 100 200 300 400 500 600 700 800 10 20 30 40 50 60 70 80 Time (s) A m p lit u d e ( % ) process variable level setpoint
Figure. 7. Level loop response.
after which they started to be logged to a file. 4) At t = 60 s, the temperature setpoint was changed to
38 ºC.
5) At t = 360 s, the temperature setpoint was changed to 32 ºC.
6) At t = 660 s, the temperature setpoint returned to 35 ºC.
7) At t = 960 s, the logging process was stopped. The collected data can be analyzed as follows (see figure 8):
• At t = 60 and 660 s, the controller closes TCV to increase the temperature of the water entering in C1. As the temperature increases, the derivative component gradually allows the entry of cold water to avoid
an excessive overshoot later (anticipation capability). Nevertheless, the process response has an overshoot of 33% and a settling time of 80 s.
• At t = 360 s, the controller opens TCV to decrease the temperature. The process response has a smaller overshoot and a shorter settling time.
• The temperature controller is able to track the setpoint but tends to oscillate due to the long dead time of the process. The anticipation capability introduced by the derivative component is crucial to limit the amplitude of the oscillations. 0 100 200 300 400 500 600 700 800 900 1000 31 32 33 34 35 36 37 38 39 Time (s) A m p lit u d e ( ºC ) process variable temperature setpoint
Figure. 8. Temperature loop response.
V. CONCLUSIONS
The paper aims to clarify the performance issues of the SXI platform, a service-oriented middleware solution targeted for instrumentation. For that purpose, we built a pilot DMCS and saw how it worked on a real plant. The results obtained from the experiments made led us to the following conclusions:
• The SXI platform is a viable solution to implement DMCS. The system as a whole, and the control loops in particular, behaved well. All functionalities of control and engineering stations worked as expected.
• The SXI platform supports sampling frequencies in the range of 10 Hz.
• The SXI platform is not ready for real-time applica-tions. First, because the Windows XP operating system and the .NET Framework do not meet real-time con-straints [14, 15]. And second, because communications across Ethernet are not deterministic by nature.
In our opinion, the lack of support for real time is the major limitation of the SXI platform at the present. To overcome this problem, we will have to do the following:
1) Quit the .NET Framework and migrate the SXI plat-form to a real-time environment (such as C++ together with the Windows CE operating system [16], or a real-time Java virtual machine [17]).
2) Use industrial Ethernet switches [18] to make com-munications deterministic.
REFERENCES
[1] David S. Platt, “Introducing Microsoft .NET”, 3rd Edition, Microsoft Press, USA, 2003, ISBN 0-7356-1918-2 [2] [online] http://msdn2.microsoft.com/
en-us/netframework/aa663324.aspx
[3] IEEE Std. 1451.1-1999, “IEEE Standard for a Smart Trans-ducer Interface for Sensors and Actuators – Network Capable Application Processor (NCAP) Information Model”, USA, 1999
[4] [online] http://www.ni.com/dataacquisition/nidaqmx.htm [5] IEEE Std. 1451.4, “IEEE Standard for a Smart Transducer
Interface for Sensors and Actuators – Mixed-Mode Com-munication Protocols and Transducer Electronic Datasheet (TEDS) Formats”, USA, 2004
[6] Juval Lowy, “Programming WCF Services”, O’Reilly, USA, 2007, ISBN 0-596-52699-7
[7] Gustavo Alonso, fabio Casati, Harumi Kuno, Vijay Machi-raju, “Web Services - Concepts, Architectures and Applica-tions”, Springer, Germany, 2004, ISBN 3-540-44008-9 [8] [online] http://www.w3schools.com/soap/soap_summary.asp [9] [online] http://msdn.microsoft.com/ en-us/library/ms951274.aspx [10] [online] http://msdn.microsoft.com/ en-us/library/ms751494(v=VS.90).aspx [11] [online] http://www.codeproject.com/ KB/testing/stopwatch-measure-precise.aspx [12] [online] http://en.wikipedia.org/ wiki/Garbage_collection_(computer_science)
[13] Karl Johan Åström, Richard M. Murray, “Chapter 10. PID Control”, “Feedback Systems: An Introduction for Scientists and Engineers”, pp. 293-314, Princeton University Press, USA-NJ, 2008, ISBN 978-0691135762
[14] Martin Timmerman, Jean-Cristophe Monfret, “Windows NT as Real-Time OS?”, Real-Time Magazine, Vol. 5, No. 2, pp. 6-13, June 1997
[15] Michael H. Lutz, Phillip A. Laplante, “C# and the .NET Framework: Ready for Real Time?”, IEEE Software Maga-zine, Vol. 20, No. 1, pp. 74-80, February 2003
[16] [online] http://www.microsoft.com/windowsembedded/ en-us/evaluate/windows-embedded-compact-7.aspx [17] [online] http://java.sun.com/javase/ technologies/realtime/index.jsp [18] [online] http://www.cisco.com/web/strategy/docs/ manufacturing/industrial_ethernet.pdf