1
Regional Convergence and R&D Investment:
Applied investigation in Portugal
Gertrudes Saúde Guerreiro1
([email protected]; Department of Economics & CEFAGE-UE, University of Évora, Portugal)
António Henriques Martins Guerreiro1
([email protected]; Department of Economics & CEFAGE-UE, University of Évora, Portugal)
ABSTRACT
R&D investments are seen has having an enormous potential impact on the competitive position of regions and perhaps on regional convergence (or divergence) too. The aim of the paper is to study both the localization of R&D investments and regional income distribution among the NUTs 3 regions of Portugal to conclude if these variables are related or not. We intend to answer questions like if geography influences the pattern of R&D investments and inequality, and if these ones reveal the presence of spatial correlation. Furthermore, we evaluate convergence or divergence in income growth and if it is related with R&D investments. After a brief introduction we evaluate the inequalities among regions using information about per capita GDP and per capita R&D investment. It follows the convergence analysis and conclusions.
To study the spatial convergence (approximation) of per capita income (GDPpc) and R&D investments in the regions of Portugal, we use a standard methodology of spatial econometrics. We compared the values of each geographical unit with the values calculated to the neighboring geographic units, in the first and last year of the period under review.
We conclude that regions with higher GDPpc are not the same with the highest concentration of R&D investments, with the exception of the northern coastline. The R&D investments are geographically linked to the network of higher education institutions, especially in the interior regions of the country. The northern regions reveal more dynamic in terms of R&D, which apparently is not felt in the population's standard of living measured by GDPpc. Our challenge for the future of this work is to understand and to explain this data evidence.
Keywords: R&D Investment, Income Distribution; Regional Inequality; Regional Convergence; Spatial
Econometrics.
JEL Codes: C23, O30, R11, R12
1
The authors are pleased to acknowledge the amendments suggested by colleague António Bento Caleiro the University of Évora and financial support from Fundação para a Ciência e a Tecnologia and
2
1 Introduction
Investment in research and development (R&D) is discussed in the literature as an enhancer element for economic growth and determinative of regions competitive position, notably via the creation of knowledge. Kim (2011) reports that the R&D investment is an important input in the production function of knowledge and as such in human capital.
On the other hand, according Rego & Caleiro (2010, 2012) and Rego et al. (2012), cited in Guerrero & Caleiro (2014), human resources with a high level of training are an essential element in territorial development and binomial social / territorial cohesion. In this context, Guerreiro & Caleiro (2014) conducted a spatial convergence analysis of knowledge in Portugal (Mainland) and concluded that this is an unequal country in terms of location of its most skilled human resources. Between 1991 and 2011, despite the qualifications (percentage of resident population with higher education) have risen considerably, the process of regional convergence was insignificant (Guerreiro & Caleiro, 2014).
In this paper we intend to deepen the study of regional imbalances in Portugal, in particular as regards the R&D investment and its consequences, or reflection, in terms of GDPpc growth and convergence (or divergence) of regions.
In most applied studies, regional (or spatial) economic convergence is studied with GDPpc growth (see is the work of Barro and Sala-i-Martin). However, since R&D investment is a key factor in economic growth is important to know the pattern of spatial distribution of it and whether the regions have converged or not in terms of both R&D spending and employment. It is expected that a relevant spatial convergence of the R&D investment can be reflected in a spatial convergence in terms of economic growth (GDPpc growth). An applied study conducted in Germany (Funke & Niebur, 2000) revealed the existence of regional spillovers in terms of R&D and the geographical proximity importance.
This paper presents the first results of an ongoing research, which aims to find out if geographic location of R&D investment (spending and job creation) is related to regional distribution of income (GDPpc) in Portugal, and if geographic location of R&D investment contributes to the convergence (or divergence) of income in space.
3
After this brief introduction, Section 2 describes the data and methodology, Sections 3 and 4 present the results in terms of regional distribution and spatial convergence of GDPpc and R&D Investment, and Section 4 concludes.
2 Data and methodology
About R&D investment, we use the data for R&D2 spending per capita3 and employment in R&D sector, available on the National Statistical Office (INE) website. The GDPpc (at current prices4, expressed in 1000 euro / inhabitant) is obtained from the regional accounts, also available on the INE website. The geographical unit that we consider corresponds to the regions NUTs 3 of the continent and the period under analysis is 2003-2011.
To evaluate the spatial convergence (approximation) of per capita income (GDPpc) and R&D investment between the Portuguese regions we apply a standard spatial econometric methodology: we compare the values recorded for each geographical unit with the recorded value by neighboring geographic units at the beginning and in the end of the analysis period. Our spatial weight matrix is the inverse function of the geographic distance between the centroid of geographical units (Chen, 2013 cited by Guerreiro & Caleiro, 2014).
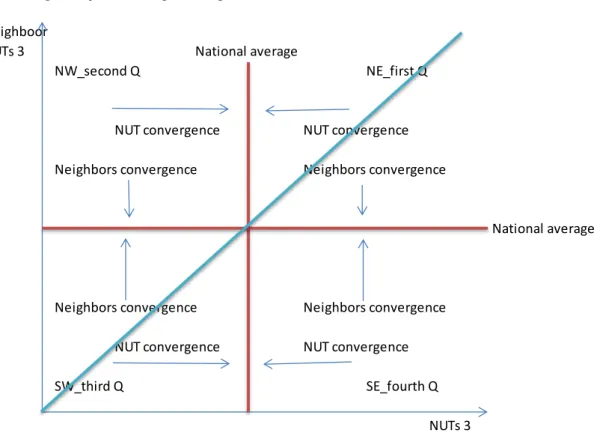
With regard to the assessment of spatial convergence of the variables under study, see Figure 1 (Guerreiro & Caleiro, 2014), for proper interpretation of results.
There is convergence if the regions are closer the national average (bisecting of each axis) and we can evaluate each region relative to its neighbors. We can register three types of situations:
• Convergence of a given region and simultaneously of their neighbors;
• Convergence of the region without observing convergence in neighboring regions;
2 Information on R&D investment is discontinued for regions Pinhal Interior Sul, Serra da Estrela, Oeste e
Baixo Mondego, due to statistical confidentiality. As such, we can not draw conclusions with regard to these regions.
3
The R&D expenditure per capita are obtained by simple division of R & D spending by the total resident population in each region, year by year, both variables available on the INE website. This indicator, in this work, is expressed in 1000 euros / inhabitant.
4
In a next stage of this work (still in progress) we intend to treat GDPpc at constant prices, which is especially relevant when we analyze the (real) growth of this indicator.
4
• Convergence just in neighboring.
Figure 1: Spatial convergence process (Guerreiro & Caleiro, 2014)
3 Regional distribution of GDPpc and R&D investment
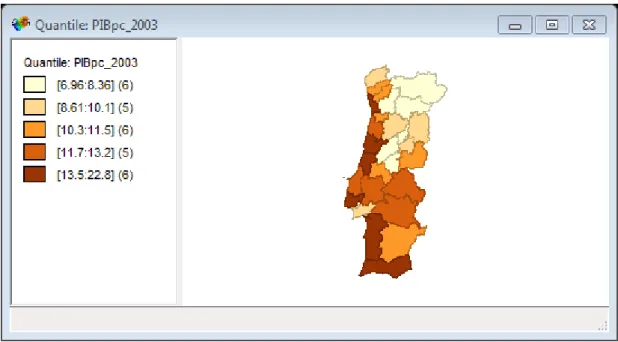
With regard to regional distribution of GDPpc (Figures 2 and 3) we observe that the coastal edge of the continent has the highest values and this trend is maintained for two years - 2003 and 2011 - the beginning and end of the period, respectively.
The behavior of variables related to R&D investment, employment (Figures 4 and 5) and expenses per capita (Figures 6 and 7), denotes a change in the concentration of higher values from inside in 2003, for the coastal regions in 2011. There is a movement of darker spots for coastal regions, both in terms of employment and expenditure per inhabitant, with some exceptions, in particular for regions where they are located universities. For example, look up the regions of Central Alentejo (University of Évora in Évora), Cova da Beira (University of Beira Interior in Covilhã), Douro (University of Tras-os-Montes and Alto Douro in Vila Real) and Algarve (University of Algarve in Faro).
Neighboor
NUTs 3 National average
NW_second Q NE_first Q
NUT convergence NUT convergence Neighbors convergence Neighbors convergence
National average
Neighbors convergence Neighbors convergence NUT convergence NUT convergence
SW_third Q SE_fourth Q
5
Figure 2: Regional distribution of GDPpc in 2003.
6
Figure 4: Regional distribution of R&D employment in 2003.
7
Figure 6: Regional distribution of R&D expenditure per capita in 2003.
Figure 7: Regional distribution of R&D expenditure per capita in 2011.
4 Spatial convergence of GDPpc and R&D investment
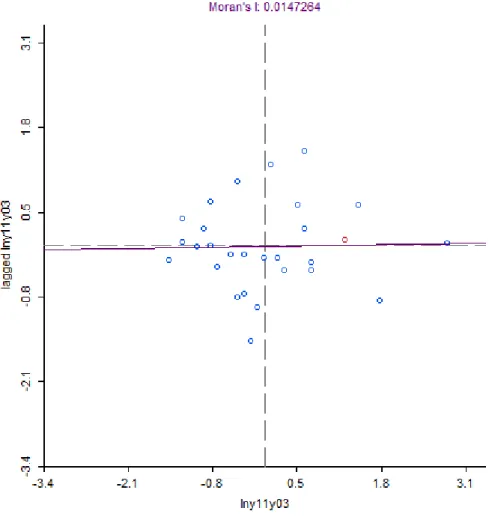
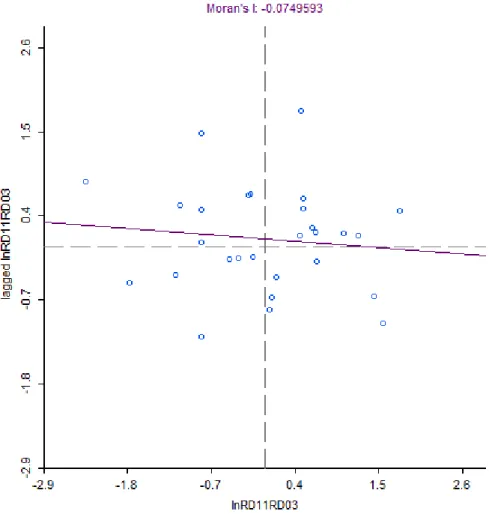
In GDPpc growth (Figure 8) we observed almost homogeneous values (close to the national average for both regions and neighboring regions), which demonstrates a lack of convergence. In R&D investment (Figures 9 and 10), the growth of the various
8
regions when compared to the surrounding regions, proves to be very heterogeneous, which would be expected given the spatial concentration of related variables, as noted in section above.
Figure 8: Growth in GDPpc between 2003 and 2011 - relative positioning of the regions.
9
Figure 9: Growth in R&D employment between 2003 and 2011 – relative positioning of the regions.
10
Figure 10: Growth in R&D expenditure per capita between 2003 and 2011 – relative positioning of the regions.
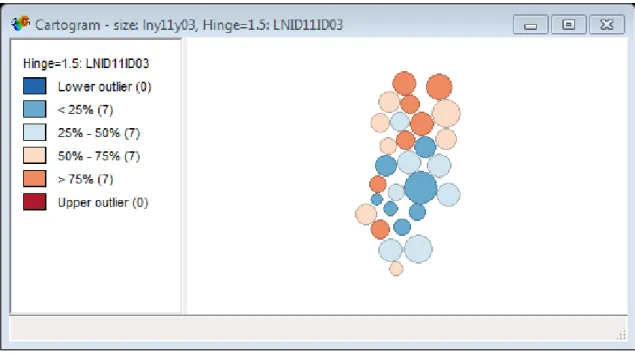
It will also be interesting to note the relationship between the growth of the regions on the one hand, in terms of GDPpc, and on the other in terms of R&D investment. We elaborated cartograms where the size of the associated circumference to every region reflects the growth of GDPpc (larger circles represent major increases) and the color represents the growth rates of R&D employment and R&D expenditure per inhabitant, respectively (Figures 11 and 12).
11
Figure 11: Growth in R&D employment versus growth in GDPpc.
Figure 12: Growth in R&D expenditure per capita versus growth in GDPpc.
If we do not consider the regions mentioned in footnote # 2, cartograms of Figures 11 and 12 show no coincidence, in regional terms, in GDPpc and R&D investment growth dynamics. It is observed however, in terms of R&D investment, a higher dynamic of the northern regions, with the exception of the Alentejo Litoral region due to the influence of the industrial center of Sines (a deepwater port).
12
5 Conclusion
The analysis carried out allows us to conclude that regions with higher GDPpc do not coincide with the areas of highest concentration of R&D investment, with the exception of the northern coastal strip.
In R&D investment, both in terms of job creation as in terms of R&D expenditure, there is a clear shift of the highest values for the northern and coastal regions. This reveals greater dynamics of these regions which is reflected in terms of competitiveness. On the other hand, it is observed that R&D investment is geographically linked to the network of universities, especially in the interior regions of the country. The northern regions reveal greater dynamic in terms of R&D, which apparently is not felt in the population's standard of living measured by GDPpc (in 2011 the northern regions have lower values than those evidenced by the southern regions5). Understand and explain this evidence of data will be challenging for a future work.
In terms of future developments, we intend to continue studying R&D investment at regional level, to see if it can boost investment in other sectors, contributing to job creation in less developed regions and increasing (or not) population's standard of living, and why. This analysis may prove to be important in the context of regional planning.
Other aspects to be improved are related to data and methodology. With regard to data, it is intended to treat the real growth of GDPpc (at constant prices)6 and the real growth of R&D spending per capita7. With regard to methodology, we intend to analyse the growth of variables every year, to better understand the whole process. Finally it is necessary to solve the problem of the regions where information is subject to confidentiality, which could bias the analysis, not allowing any conclusion on these spatial units in particular.
5
The Alentejo Litoral region is an exception, on account of the influence of the industrial hub of Sines.
6 At the time of application of the methodology we just have regional GDPpc information at current
prices.
7
Information on R & D expenditure is only available in current prices, so the values at constant prices will always have to be estimated by the authors.
13
References
Chen, Yanguang (2013), “New Approaches for Calculating Moran’s Index of Spatial Autocorrelation”, PLoS ONE, Vol. 8, n.º7.
Funke, Michael; Niebuhr, Annekatrin (2000), “Spatial R&D Spillovers and Economic Growth – Evidence from West Germany”, HWWA Discussion Paper no.98, Hamburg Institute of International Economics.
Guerreiro, Gertrudes Saúde; Caleiro, António Bento (2014), “A convergência espacial do conhecimento em Portugal”, Livro de Actas do 20.º Congresso da Associação Portuguesa para o Desenvolvimento Regional, APDR, Angra do Heroísmo, pp. 1230-1238, (ISBN: 978-989-8780-01-0).
Kim, ByungWoo (2012), “Growth regression revisited: R&D promotes convergence?”, Applied Economics, 44:11, Taylor & Francis, 1347-1362.
Rego, Conceição; Baltazar, Maria da Saudade; Caleiro, António (2012), “Higher Education and Social Cohesion”, Higher Education of Social Science, Vol. 2, n.º 2, pp. 17-24.
Rego, Conceição; Caleiro, António (2010), “On the Spatial Diffusion of Knowledge by Universities Located in Small and Medium Sized Towns”, iBusiness, Vol. II, n.º 2, pp. 99-105.
Rego, Conceição; Caleiro, António (2012), “Acerca dos impactes da Universidade de Évora no seu meio envolvente. Síntese de alguns resultados obtidos”, in Pereira, S.M.; Vaz, F.L. (coords.), Universidade de Évora (1559-2009). 450 anos de modernidade educativa, Lisboa, Chiado Editora, pp. 751-762.
14
Annexx